Should we expect a breakout or a rebound on EURGBP?

EURGBP is moving towards a resistance line. Because we have seen it retrace from this line before, we could see either a break through this line, or a rebound back to current levels. It has touched this line numerous times in the last 12 days and may test it again within the next 3 days. […]
Should we expect a breakout or a rebound on EURGBP?

EURGBP is moving towards a resistance line. Because we have seen it retrace from this line before, we could see either a break through this line, or a rebound back to current levels. It has touched this line numerous times in the last 12 days and may test it again within the next 3 days. […]
Should we expect a breakout or a rebound on EURGBP?

EURGBP is moving towards a resistance line. Because we have seen it retrace from this line before, we could see either a break through this line, or a rebound back to current levels. It has touched this line numerous times in the last 12 days and may test it again within the next 3 days. […]
ESP35 – getting close to resistance of a Channel Up
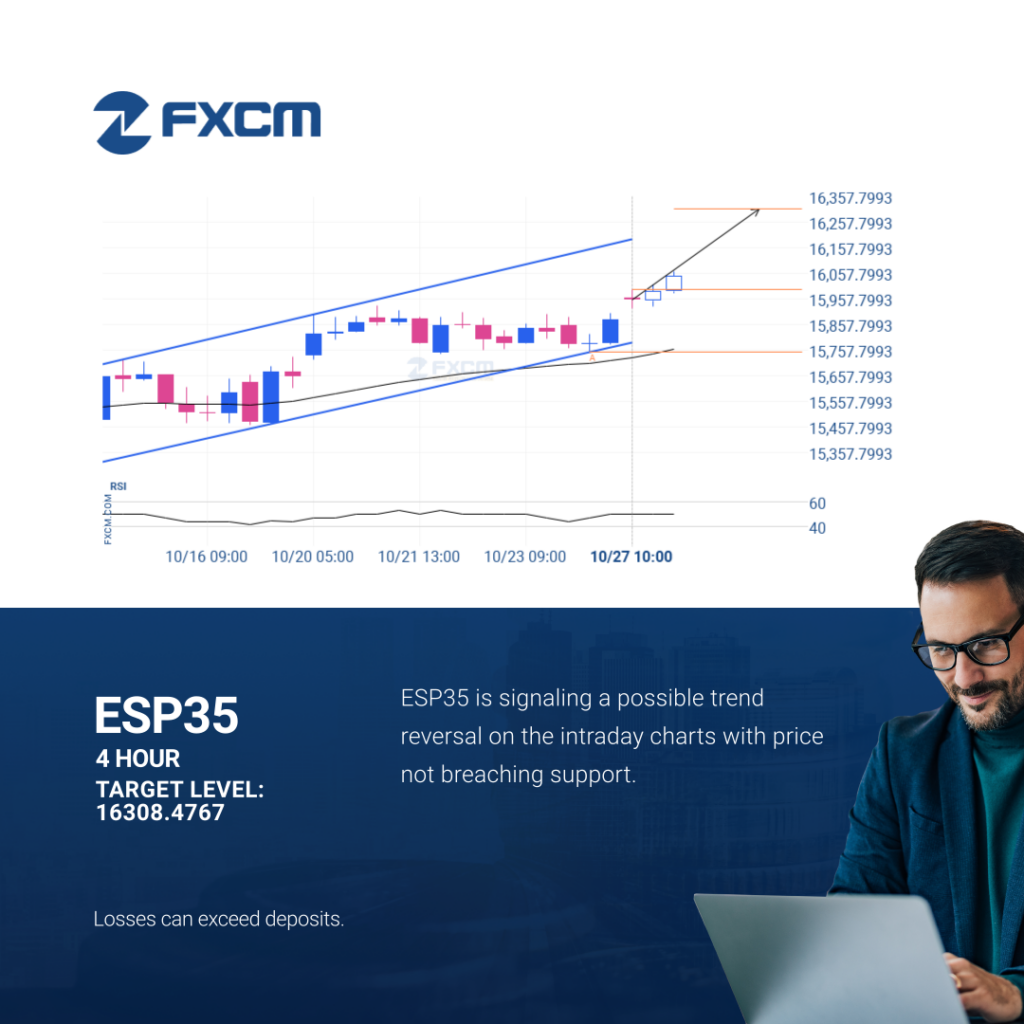
ESP35 is heading towards the resistance line of a Channel Up. If this movement continues, the price of ESP35 could test 16308.4767 within the next 18 hours. It has tested this line numerous times in the past, so this movement could be short-lived and end up rebounding just like it did in the past. Past […]
¿Deberíamos esperar una ruptura o una recuperación del EURGBP?

El EURGBP avanza hacia una línea de resistencia. Como le hemos visto retroceder desde esta línea anteriormente, podríamos presenciar, o bien, una ruptura a través de esta línea o una recuperación a los niveles actuales. Ha llegado a esta línea en numerosas ocasiones en los últimos 12 días y puede probarla de nuevo en las […]
ESP35 – acercándose a la resistencia del Canal alcista

El ESP35 se dirige a la línea de resistencia de un Canal alcista. Si este movimiento se mantiene, el precio de ESP35 podría probar el nivel de 16308.4767 en las próximas 18 horas. Ya ha probado esta línea en numerosas ocasiones, por lo que este movimiento podría durar poco y terminar recuperándose, igual que ha […]
El BTCUSD ha atravesado el soporte
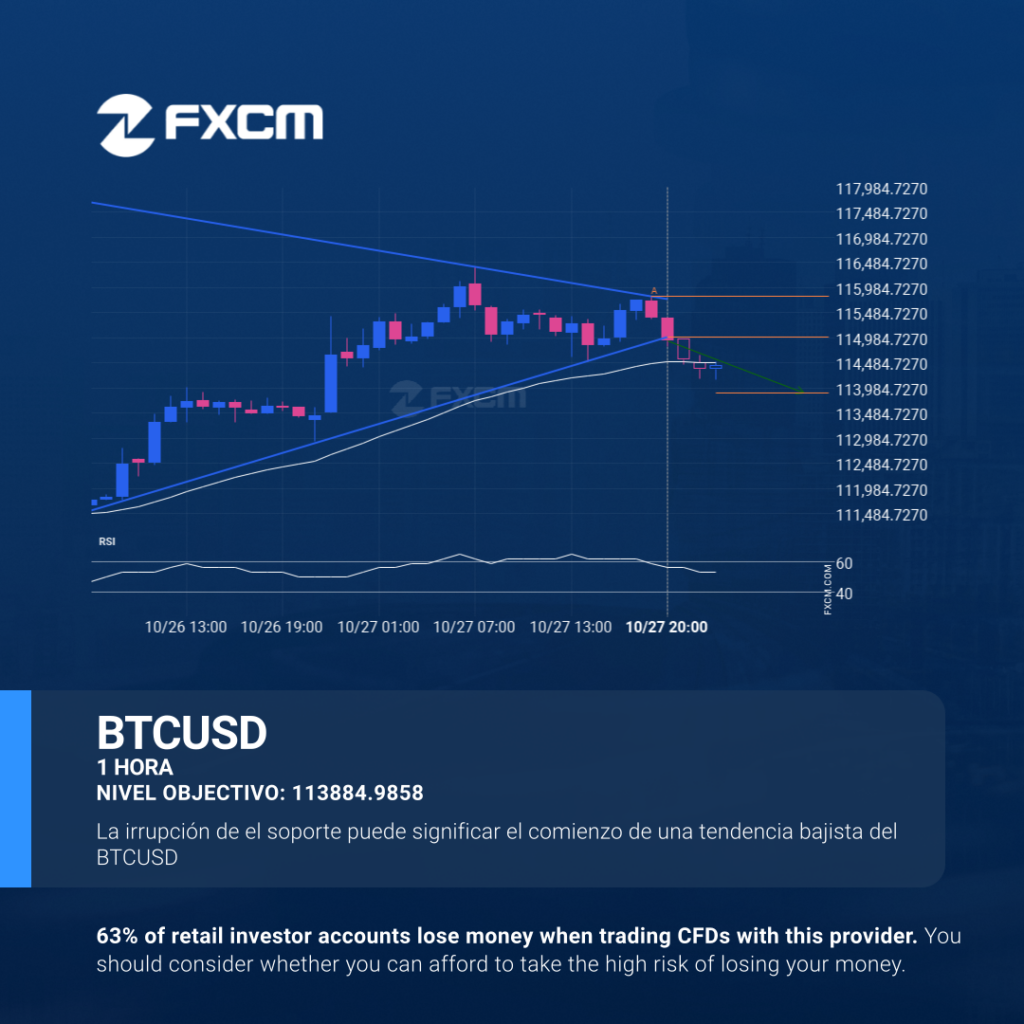
El BTCUSD ha atravesado una línea de soporte de un Triángulo y sugiere un movimiento posible a 113884.9858 dentro de las próximas 8 horas. Ya ha probado esta línea en el pasado, por lo que deberíamos esperar la confirmación de esta irrupción antes de entrar en acción. Si dicha ruptura no se confirma, podríamos presenciar […]
ESP35 – getting close to resistance of a Channel Up
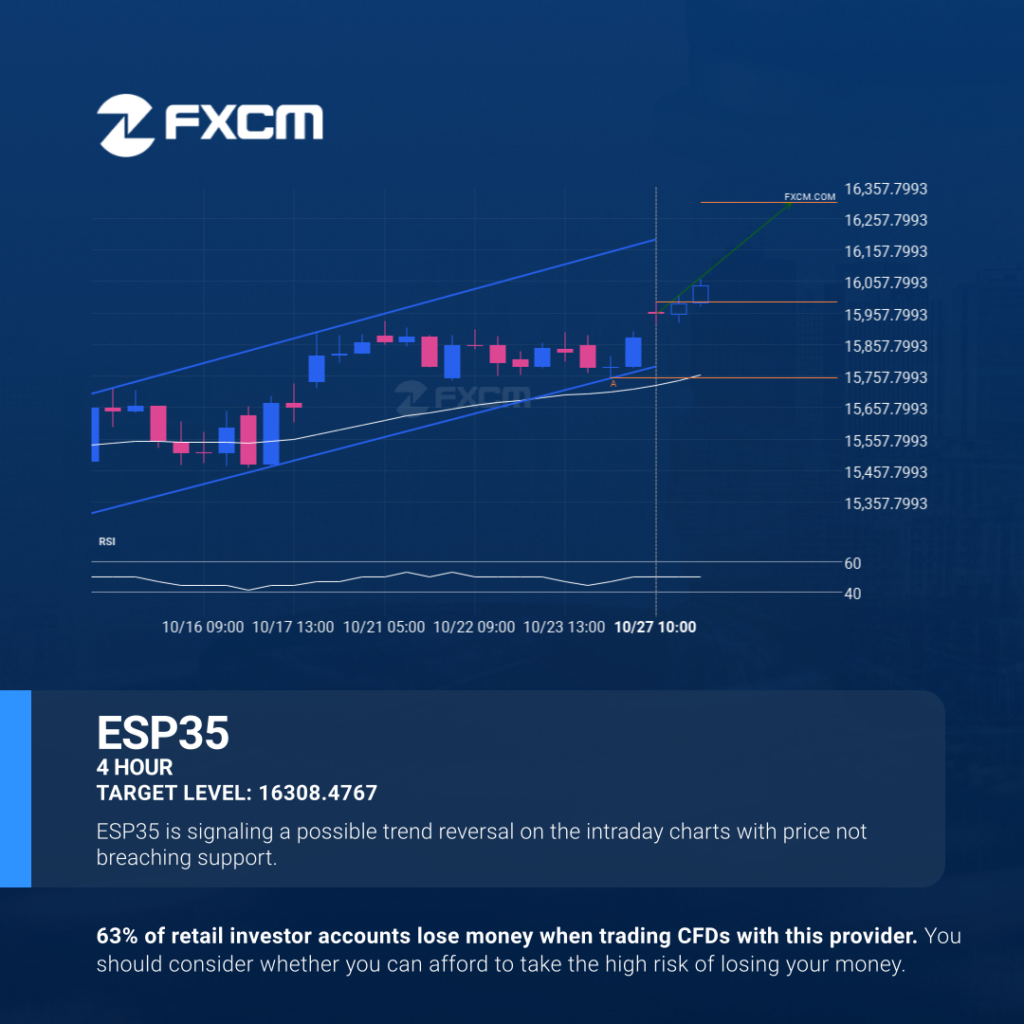
ESP35 is heading towards the resistance line of a Channel Up. If this movement continues, the price of ESP35 could test 16308.4767 within the next 18 hours. It has tested this line numerous times in the past, so this movement could be short-lived and end up rebounding just like it did in the past. Past […]
A potential bearish movement on EURJPY
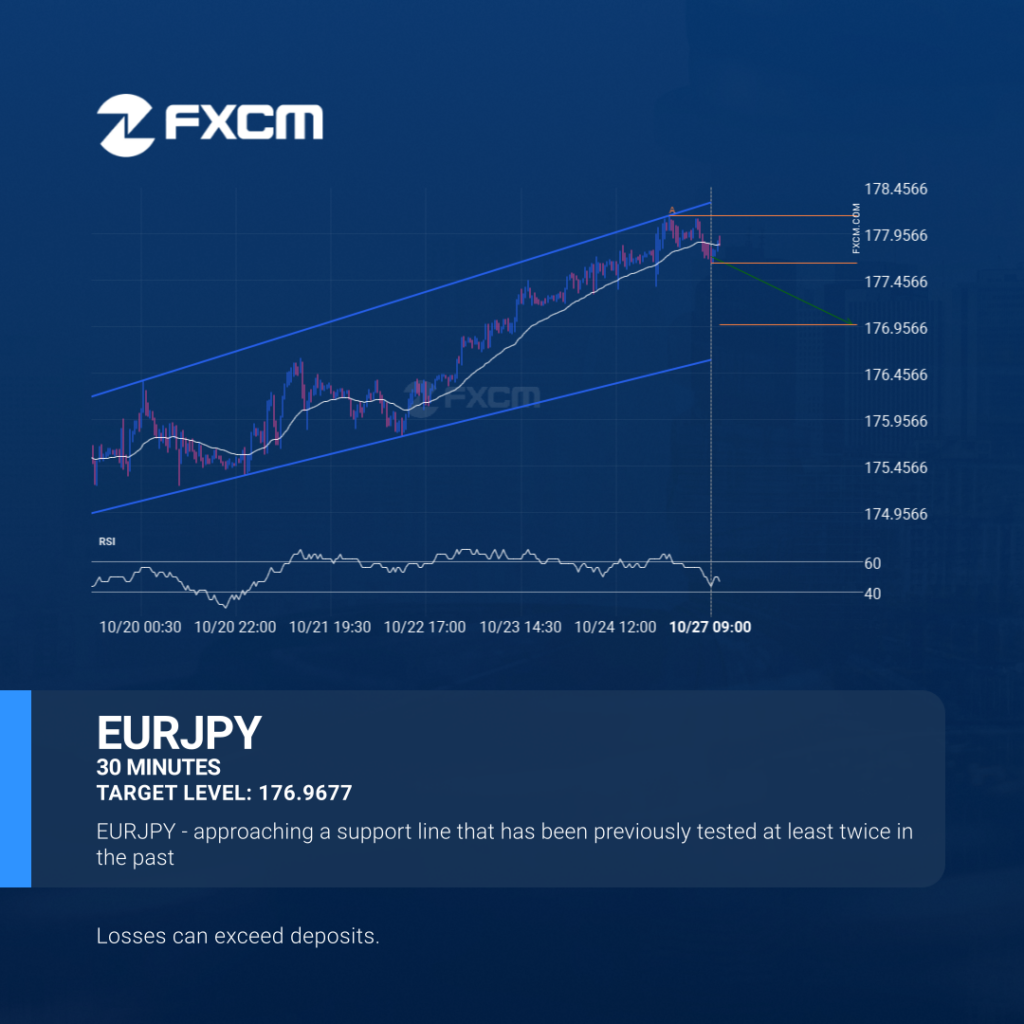
EURJPY is approaching the support line of a Channel Up. It has touched this line numerous times in the last 11 days. If it tests this line again, it should do so in the next 2 days. Past performance is not an indicator of future results. Losses can exceed deposits.
Un posible movimiento bajista en EURJPY
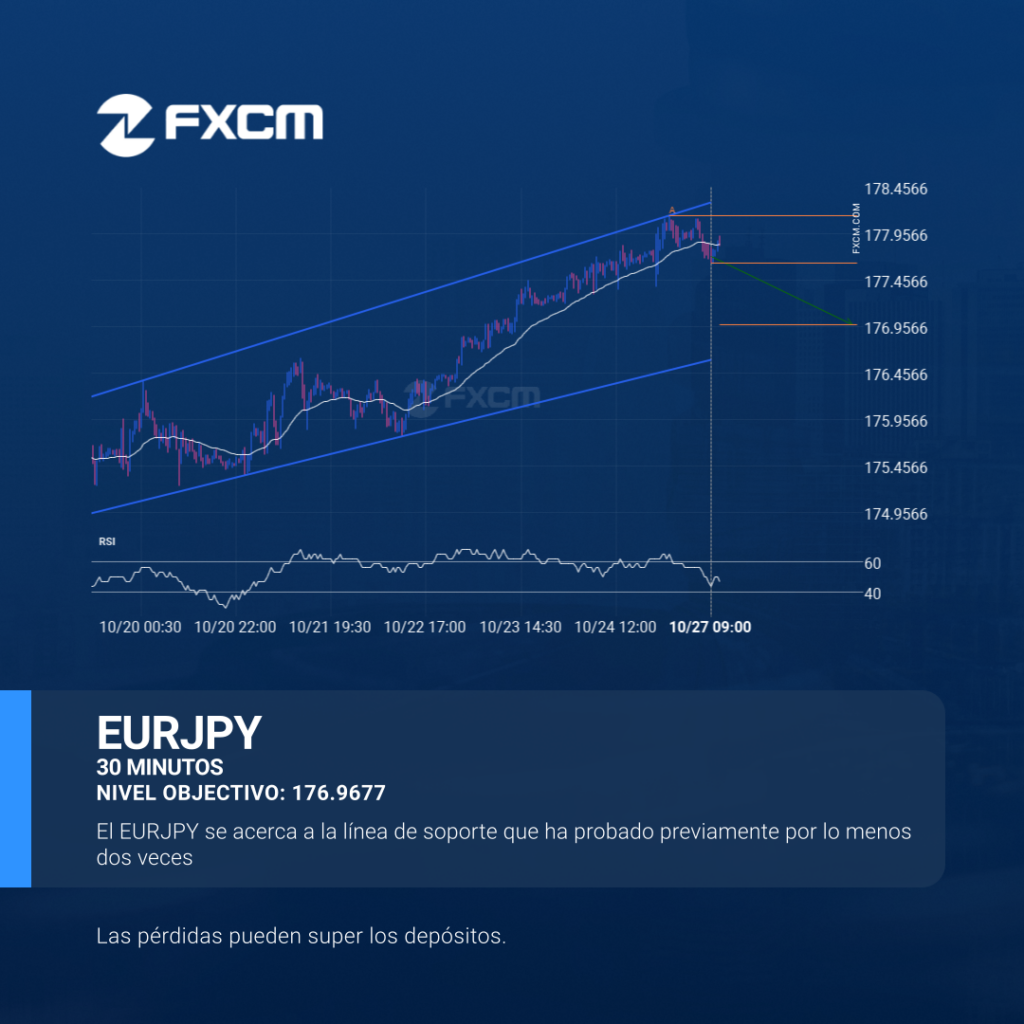
El EURJPY se está acercando a la línea de soporte de un Canal alcista. Ha llegado a esta línea en numerosas ocasiones durante los últimos 11 días. Si vuelve a probarla de nuevo, debería hacerlo en las próximas 2 días. El rendimiento pasado no es indicativo de resultados futuros. Las pérdidas pueden exceder los fondos […]