Technical Analysis Forex
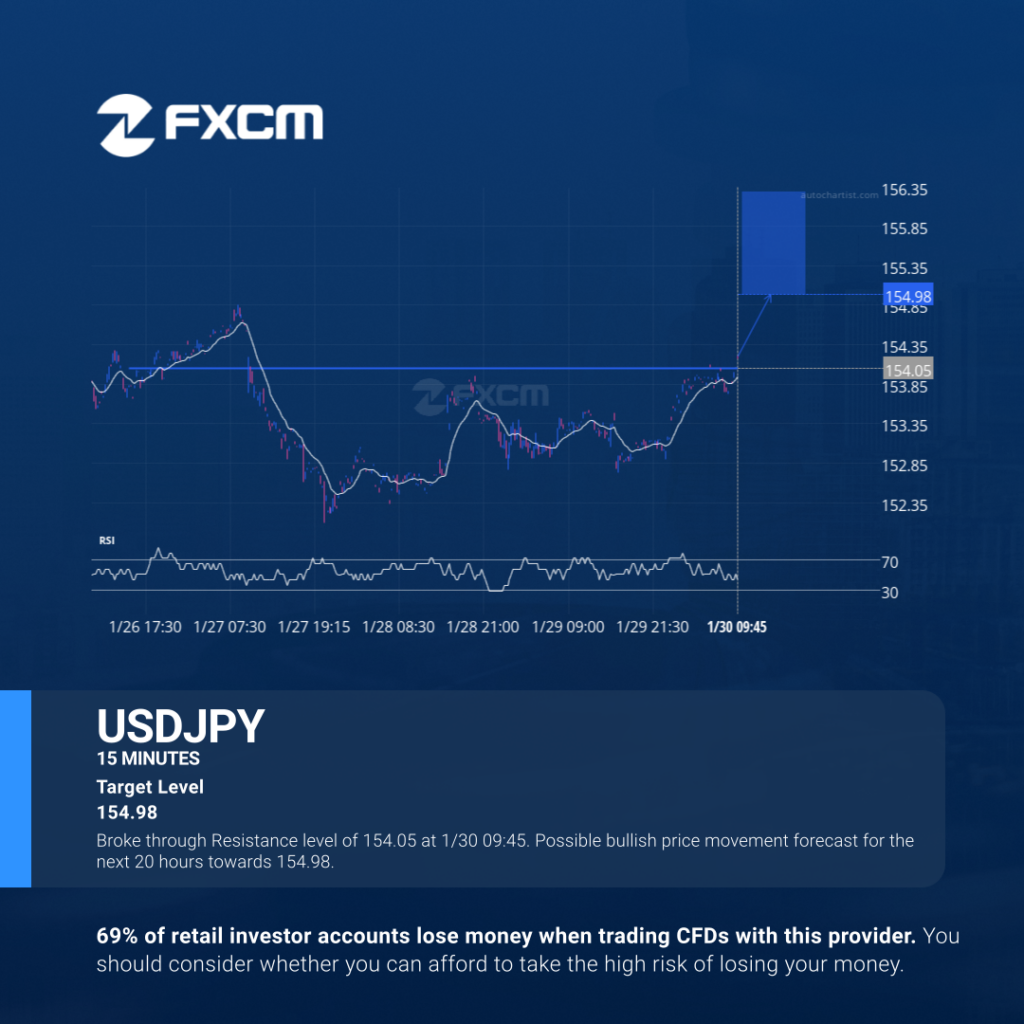
Broke through Resistance level of 154.05 at 1/30 09:45. Possible bullish price movement forecast for the next 20 hours towards 154.98. Past performance is not an indicator of future results. Losses can exceed deposits.
Technical Analysis Indices

Broke through Resistance level of 154.05 at 1/30 09:45. Possible bullish price movement forecast for the next 20 hours towards 154.98. Past performance is not an indicator of future results. Trading leveraged products carries significant risk. Please refer to PDS and TMD on our website. AFSL#309763
Índices de Análisis Técnico
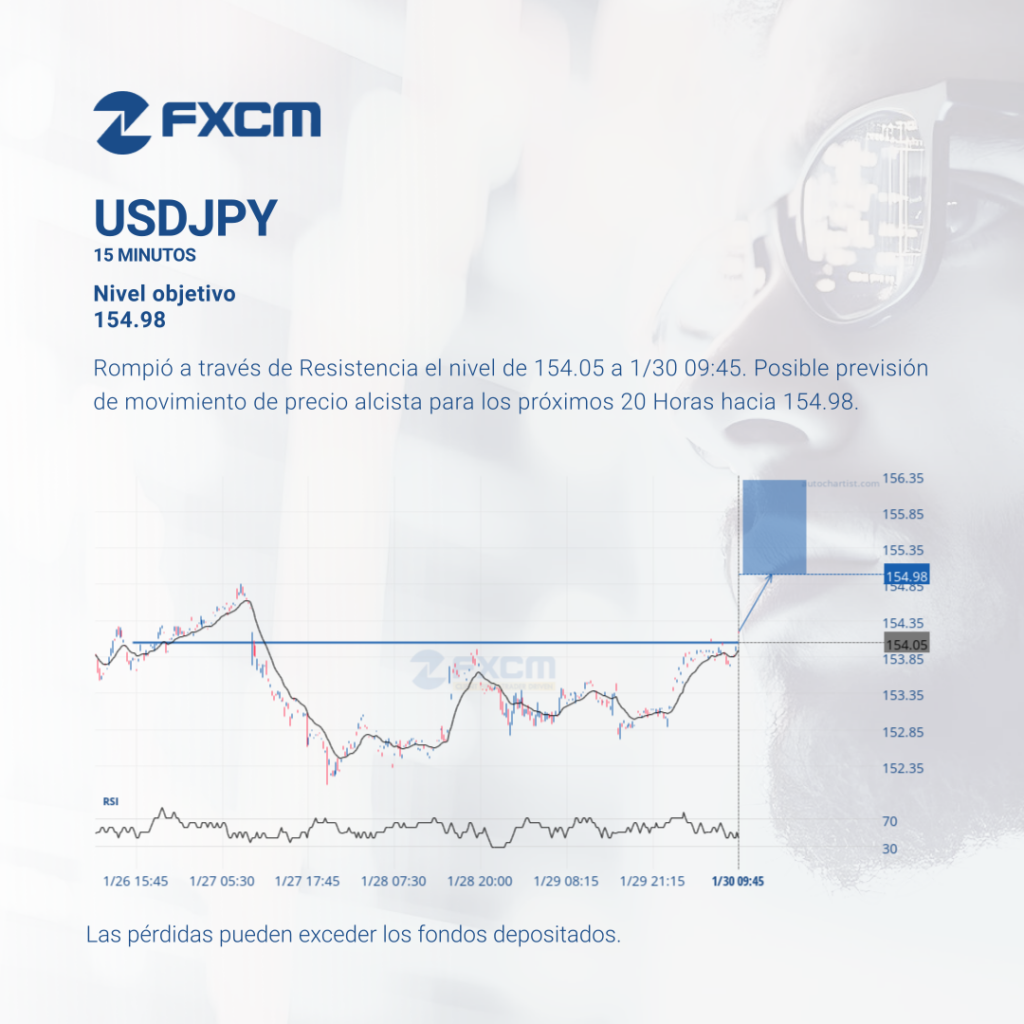
Rompió a través de Resistencia el nivel de 154.05 a 1/30 09:45. Posible previsión de movimiento de precio alcista para los próximos 20 Horas hacia 154.98. Las pérdidas pueden exceder los depósitos.
Technical Analysis Indices

Broke through Resistance level of 10,226.02 at 1/29 12:30. Possible bullish price movement forecast for the next 10 hours towards 10,261.46. Past performance is not an indicator of future results. Trading leveraged products carries significant risk. Please refer to PDS and TMD on our website. AFSL#309763
Technical Analysis Forex

Triangle has broken through the resistance line at 1/26 00:00. Possible bullish price movement forecast for the next 32 days towards 1.3872. Past performance is not an indicator of future results. Losses can exceed deposits.
Índices de Análisis Técnico

Cuña Ascendente ha atravesado la línea de soporte en 1/29 05:30. Posible movimiento de precio bajista previsto para los próximos 3 Horas hacia 64.05. Las pérdidas pueden exceder los depósitos.
Technical Analysis Forex
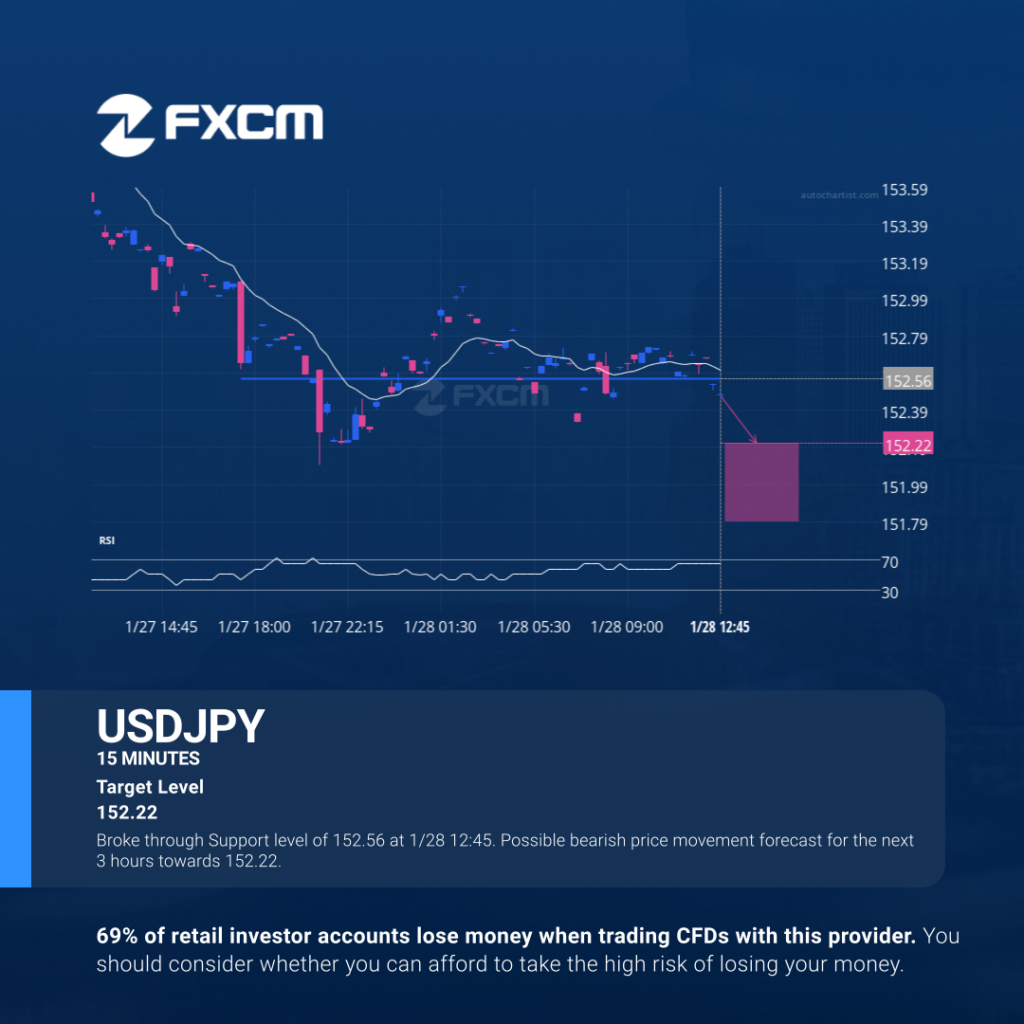
Broke through Support level of 152.56 at 1/28 12:45. Possible bearish price movement forecast for the next 3 hours towards 152.22. Past performance is not an indicator of future results. Losses can exceed deposits.
Análisis Técnico Forex
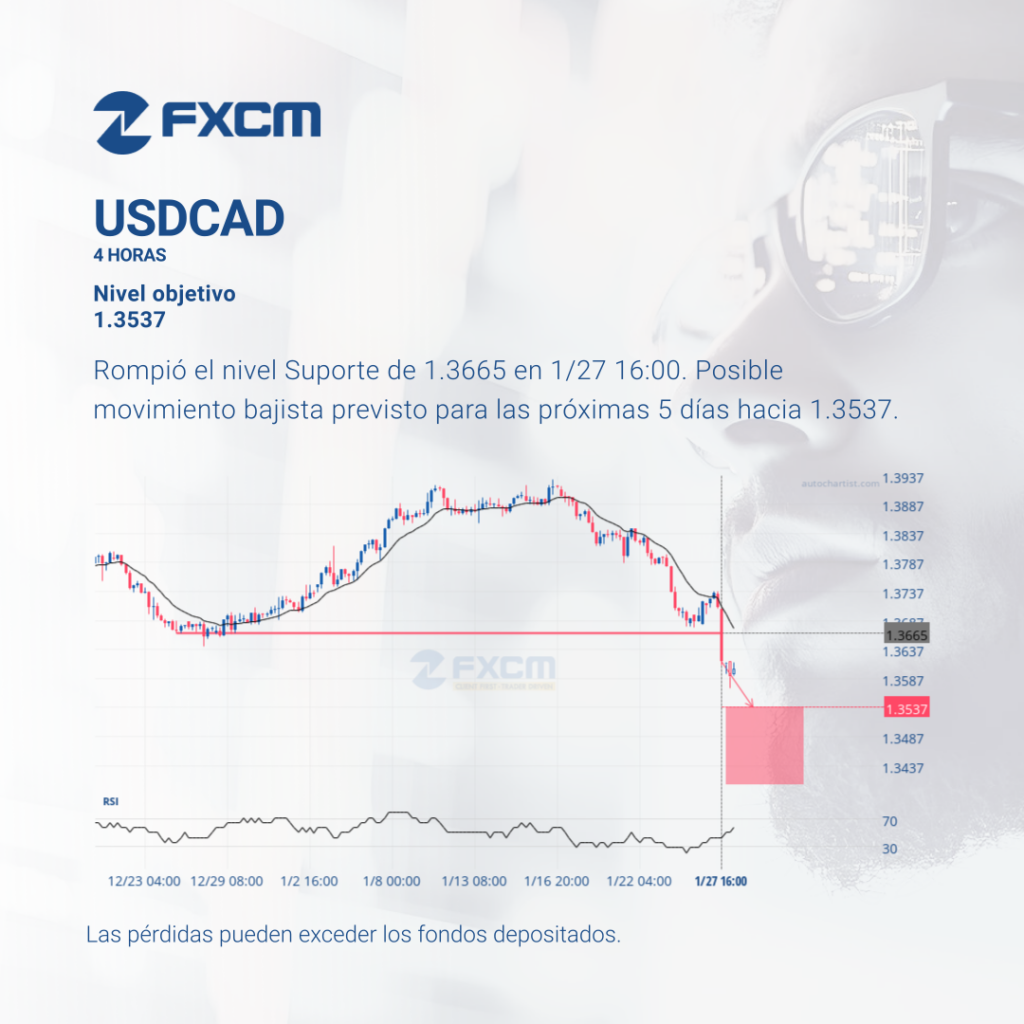
Rompió el nivel Suporte de 1.3665 en 1/27 16:00. Posible movimiento bajista previsto para las próximas 5 días hacia 1.3537. El rendimiento pasado no es indicativo de resultados futuros. Las pérdidas pueden exceder los depósitos.
Technical Analysis Indices

Approaching Support level of 106.41 identified at 1/28 05:45. This pattern is still in the process of forming. Possible bearish price movement towards the support 106.41 within the next 9 hours. Past performance is not an indicator of future results. Losses can exceed deposits.
Índices de Análisis Técnico
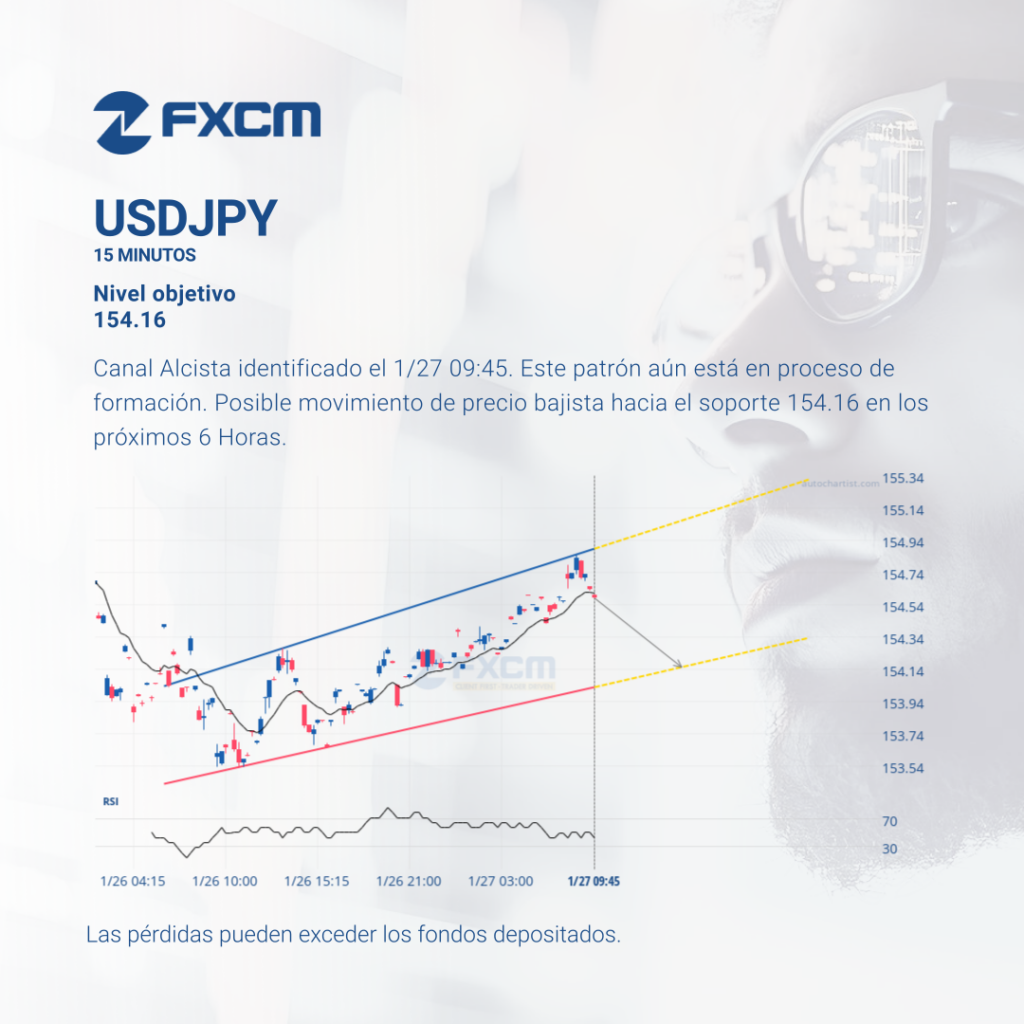
Canal Alcista identificado el 1/27 09:45. Este patrón aún está en proceso de formación. Posible movimiento de precio bajista hacia el soporte 154.16 en los próximos 6 Horas. Las pérdidas pueden exceder los depósitos.