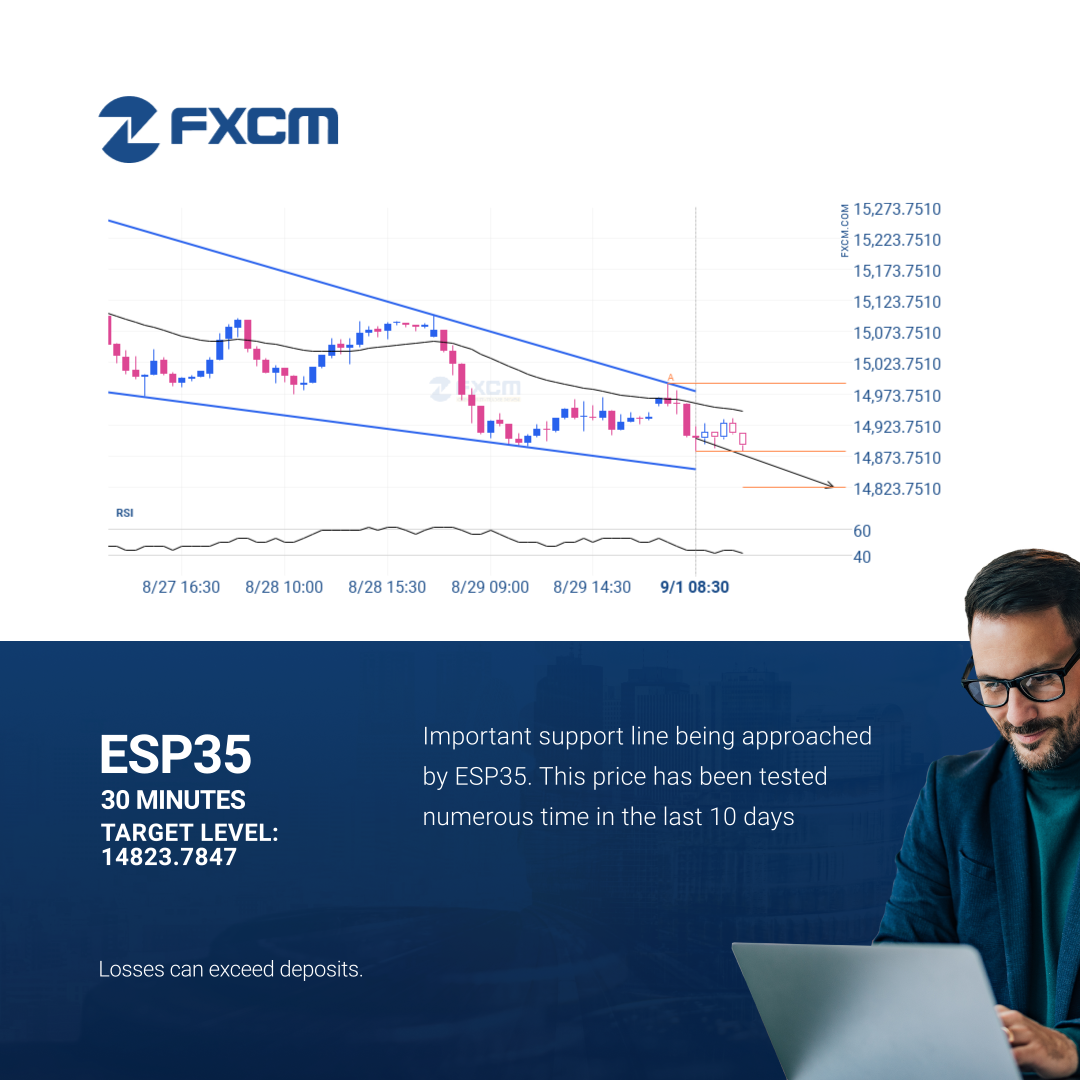
Emerging Falling Wedge pattern in its final wave was identified on the ESP35 30 Minutes chart. After a strong bearish run, we find ESP35 heading towards the upper triangle line with a possible resistance at 14823.7847. If the support shows to hold, the Falling Wedge pattern suggests a rebound back towards current levels.
Past performance is not an indicator of future results.
Losses can exceed deposits.