Big movement possible on EURUSD
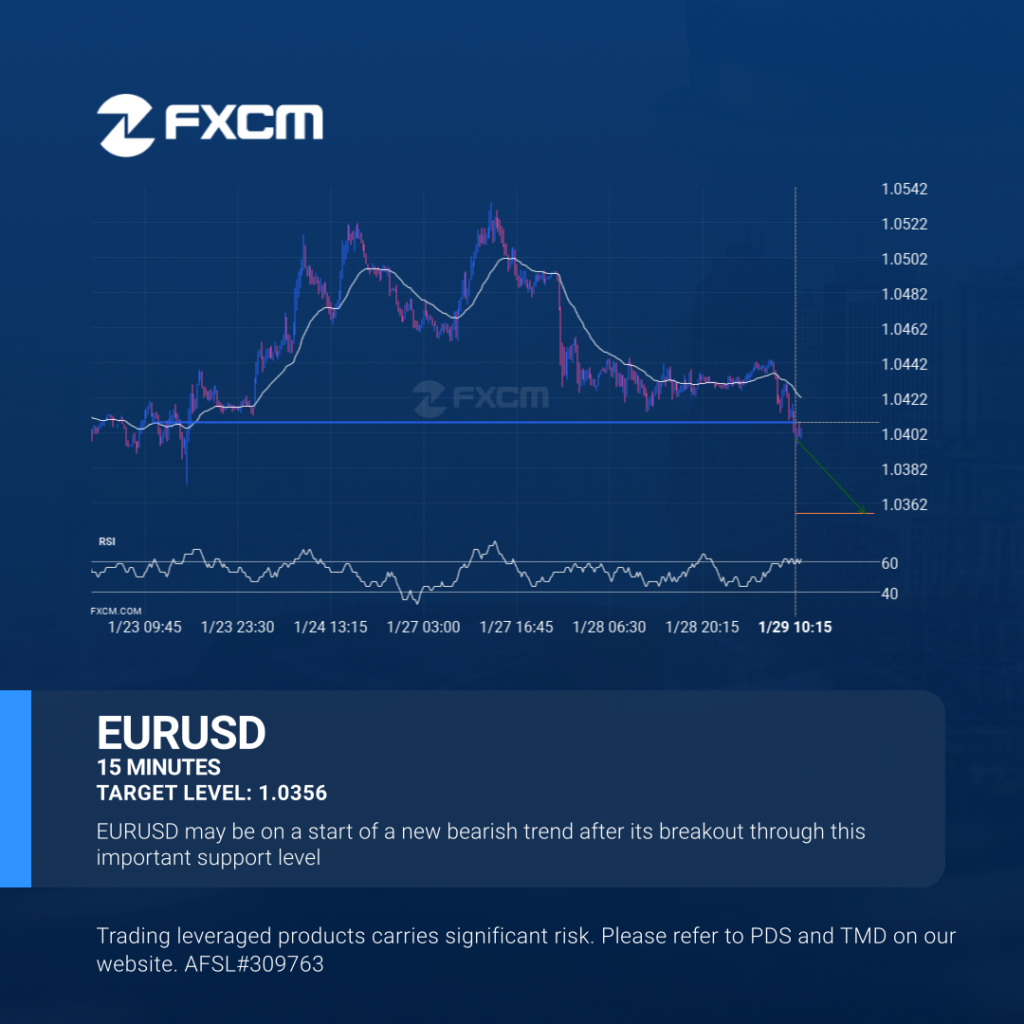
A strong support level has been breached at 1.0408 on the 15 Minutes EURUSD chart. Technical Analysis theory forecasts a movement to 1.0356 in the next 23 hours. Past performance is not an indicator of future results. Losses can exceed deposits.
Confirmed breakout on EURJPY 30 Minutes chart

EURJPY has broken through a support line. It has touched this line at least twice in the last 6 days. This breakout may indicate a potential move to 161.0666 within the next 20 hours. Because we have seen it retrace from this position in the past, one should wait for confirmation of the breakout before […]
USDCAD – Continuation Chart Pattern – Rising Wedge

USDCAD was identified at around 1.44133 having recently rebounded of the support on the 30 Minutes data interval. Ultimately, the price action of the stock has formed a Rising Wedge pattern. This squeeze may increases the chances of a strong breakout. The projected movement will potentially take the price to around the 1.4435 level. Past […]
USDCHF is moving, act now

USDCHF rose sharply for 22 hours – which is an excessively big movement for this instrument; exceeding the 98% of past price moves. Even if this move is a sign of a new trend in USDCHF there is a chance that we will witness a correction, no matter how brief. Past performance is not an […]
Extreme movement on EURUSD
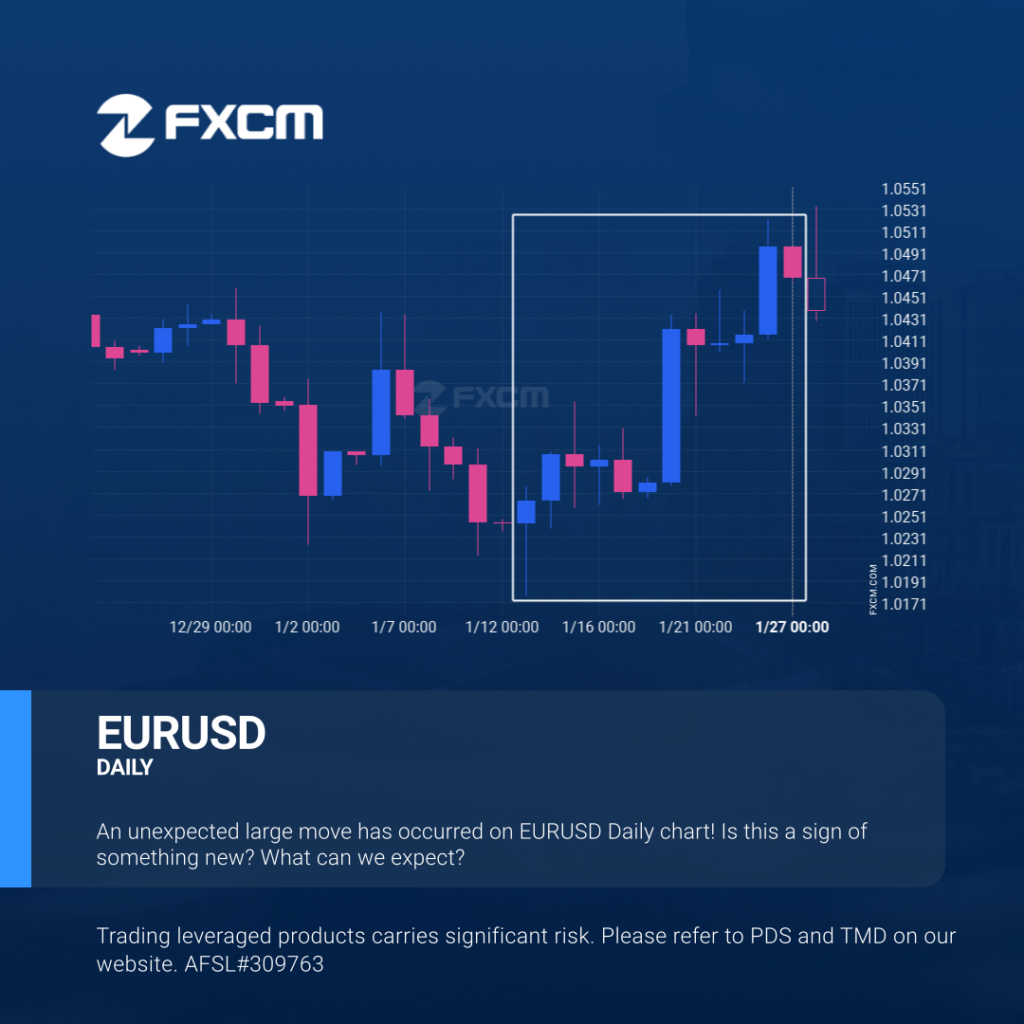
EURUSD has experienced an extremely big movement in last 14 days. It may continue the trend, but this would make the move unprecedented in the recent past. Past performance is not an indicator of future results. Losses can exceed deposits.
bearish technical pattern on EURJPY 4 hour

EURJPY has broken through a support line of a Channel Up and suggests a possible movement to 161.3536 within the next 2 days. It has tested this line in the past, so one should probably wait for a confirmation of this breakout before taking action. If the breakout doesn’t confirm, we could see a retracement […]
What’s going on with USDJPY?
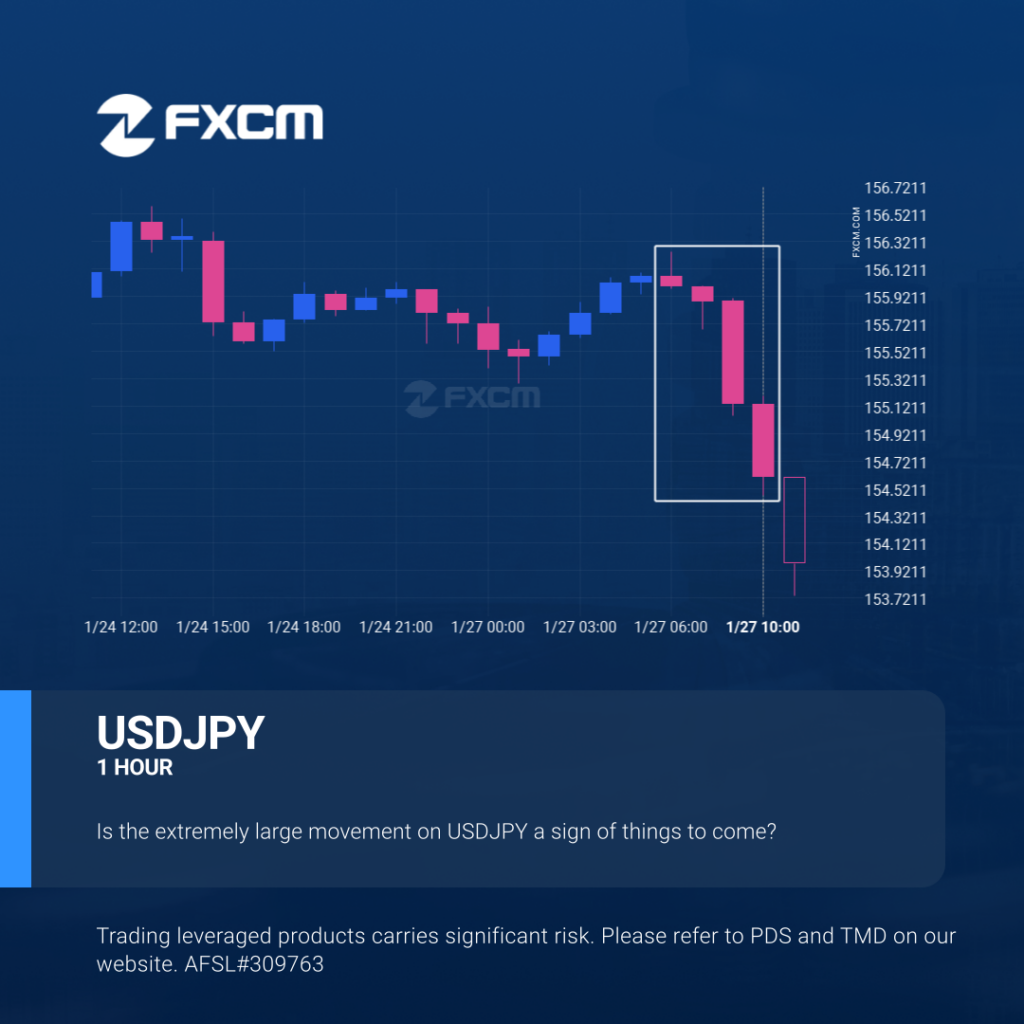
USDJPY hits 154.603 after a 0.89% move spanning 4 hours. Past performance is not an indicator of future results. Losses can exceed deposits.
EURGBP running downward, don’t miss out.

EURGBP hits 0.84048 after a 0.47% move spanning 3 days. Past performance is not an indicator of future results. Losses can exceed deposits.
Possible start of a bullish trend on AUDUSD
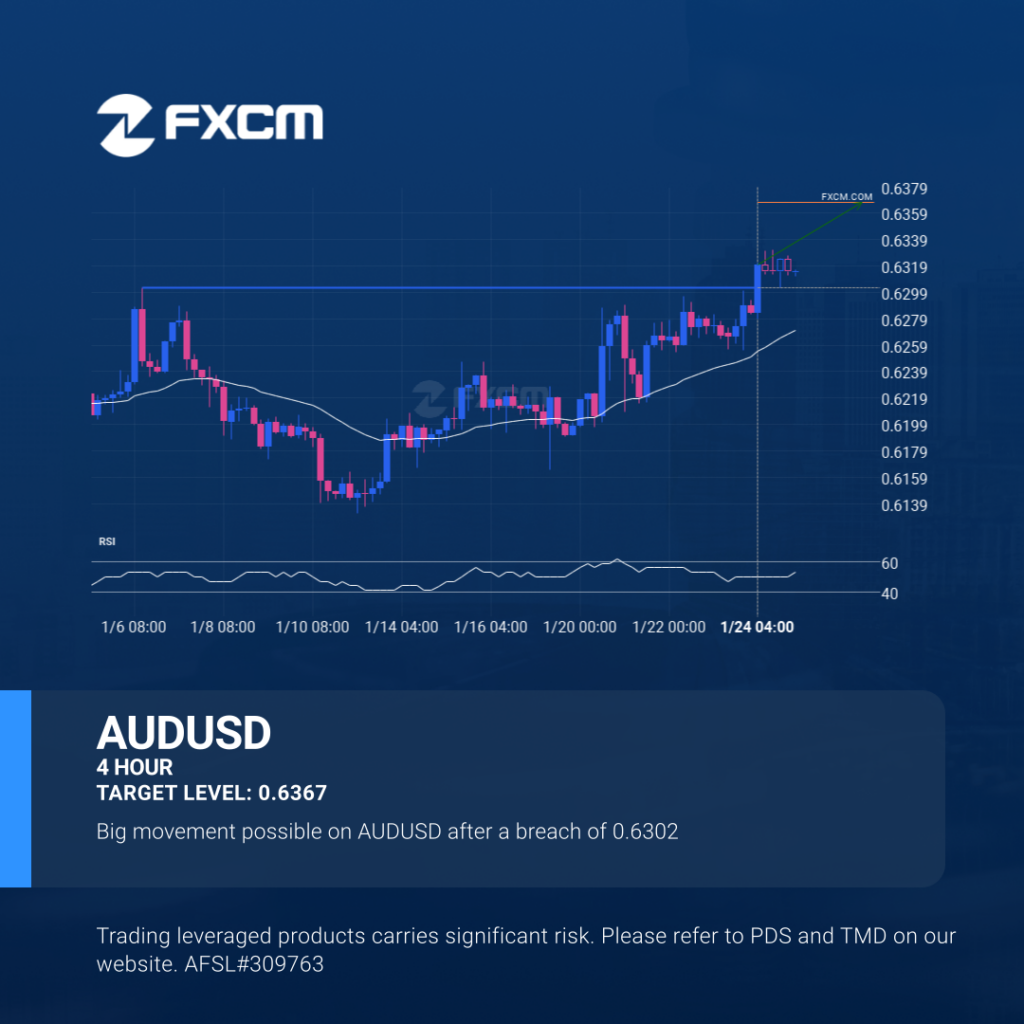
The breakout of AUDUSD through the 0.6302 price line is a breach of an important psychological price that is has tested numerous in the past. If this breakout persists, AUDUSD could test 0.6367 within the next 3 days. One should always be cautious before placing a trade, wait for confirmation of the breakout. Past performance […]
A potential bullish movement on EURCHF

EURCHF is approaching the resistance line of a Rising Wedge. It has touched this line numerous times in the last 11 days. If it tests this line again, it should do so in the next 2 days. Past performance is not an indicator of future results. Losses can exceed deposits.