AUDUSD – Extreme movement, a rare opportunity
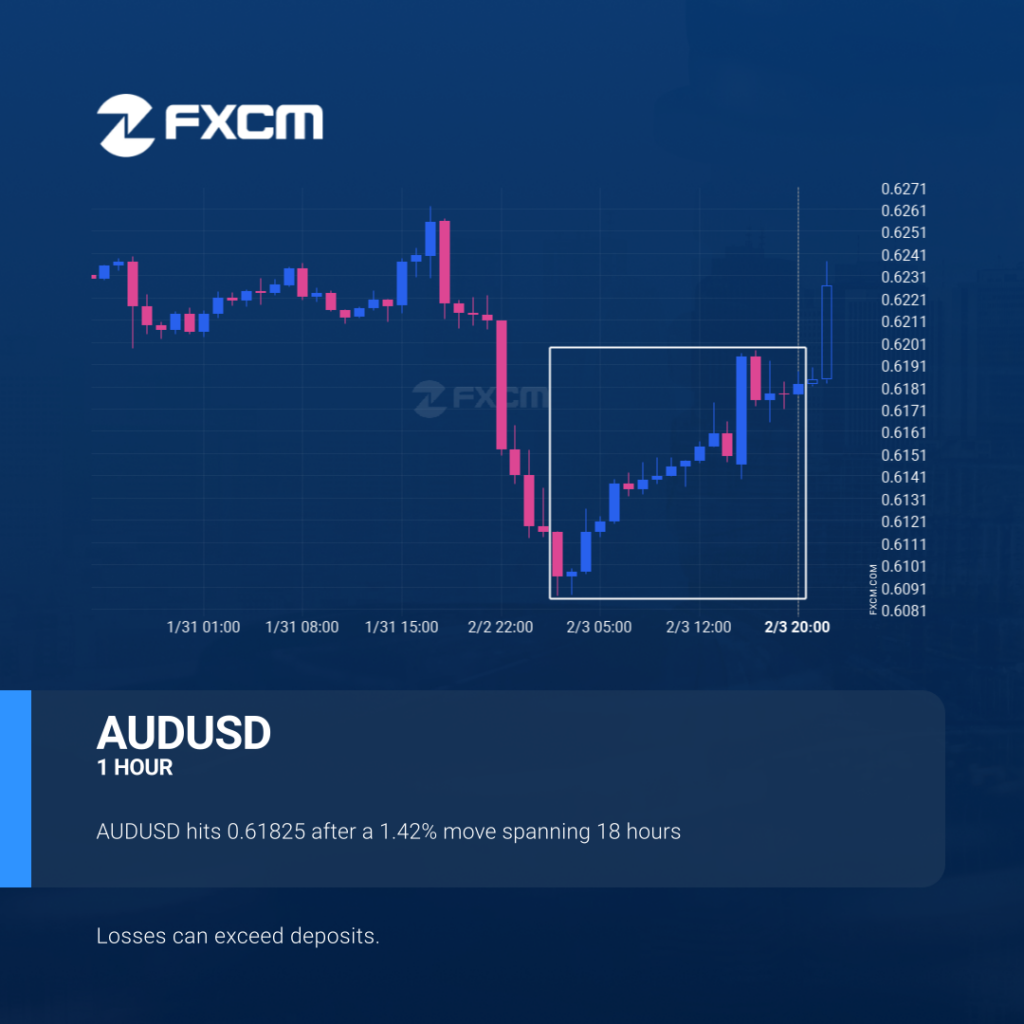
AUDUSD hits 0.61825 after a 1.42% move spanning 18 hours. Past performance is not an indicator of future results. Losses can exceed deposits.
EURJPY was on its way down

Those of you that are trend followers are probably eagerly watching EURJPY to see if its latest 1.66% move continues. If not, the mean-reversion people out there will be delighted with this exceptionally large 3 days move. Past performance is not an indicator of future results. Losses can exceed deposits.
EURGBP running downward for the last 14 days
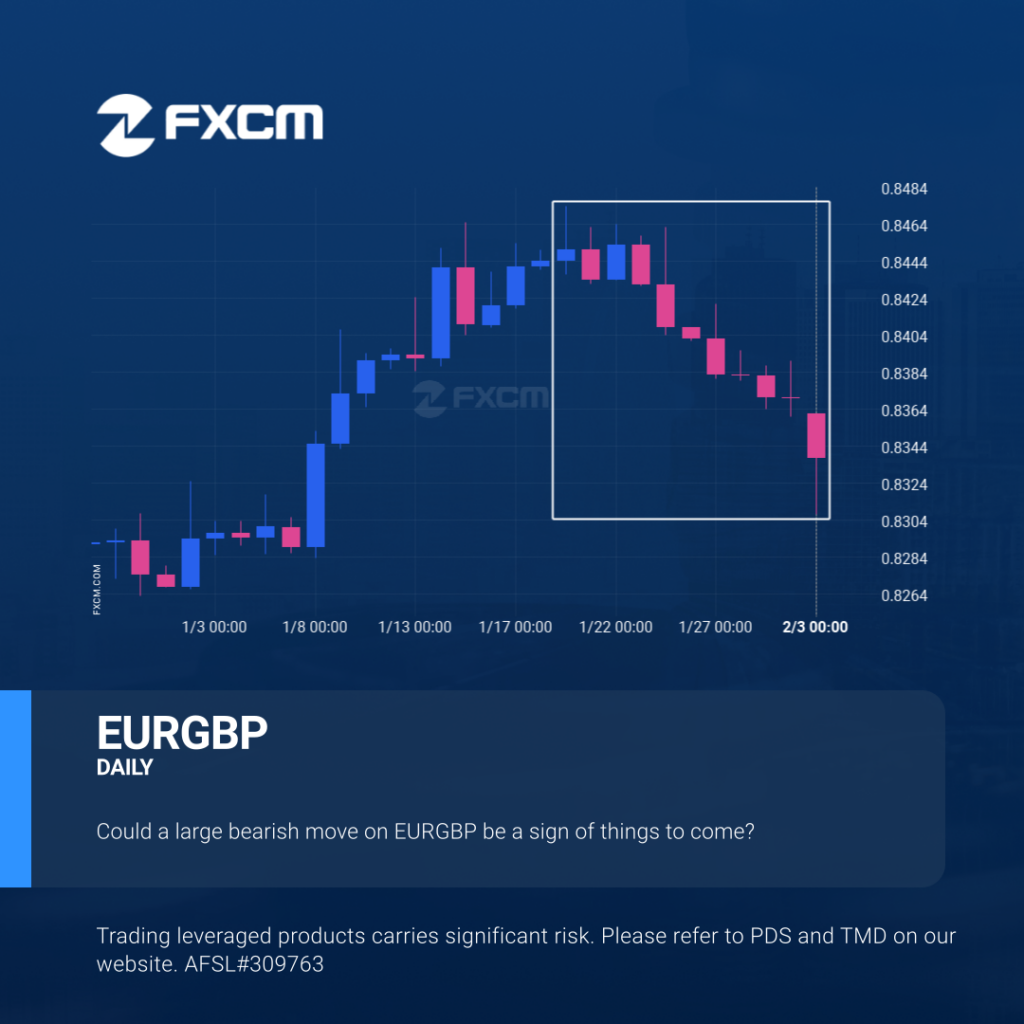
Those of you that are trend followers are probably eagerly watching EURGBP to see if its latest 1.33% move continues. If not, the mean-reversion people out there will be delighted with this exceptionally large 15 days move. Past performance is not an indicator of future results. Losses can exceed deposits.
USDCAD is on its way up
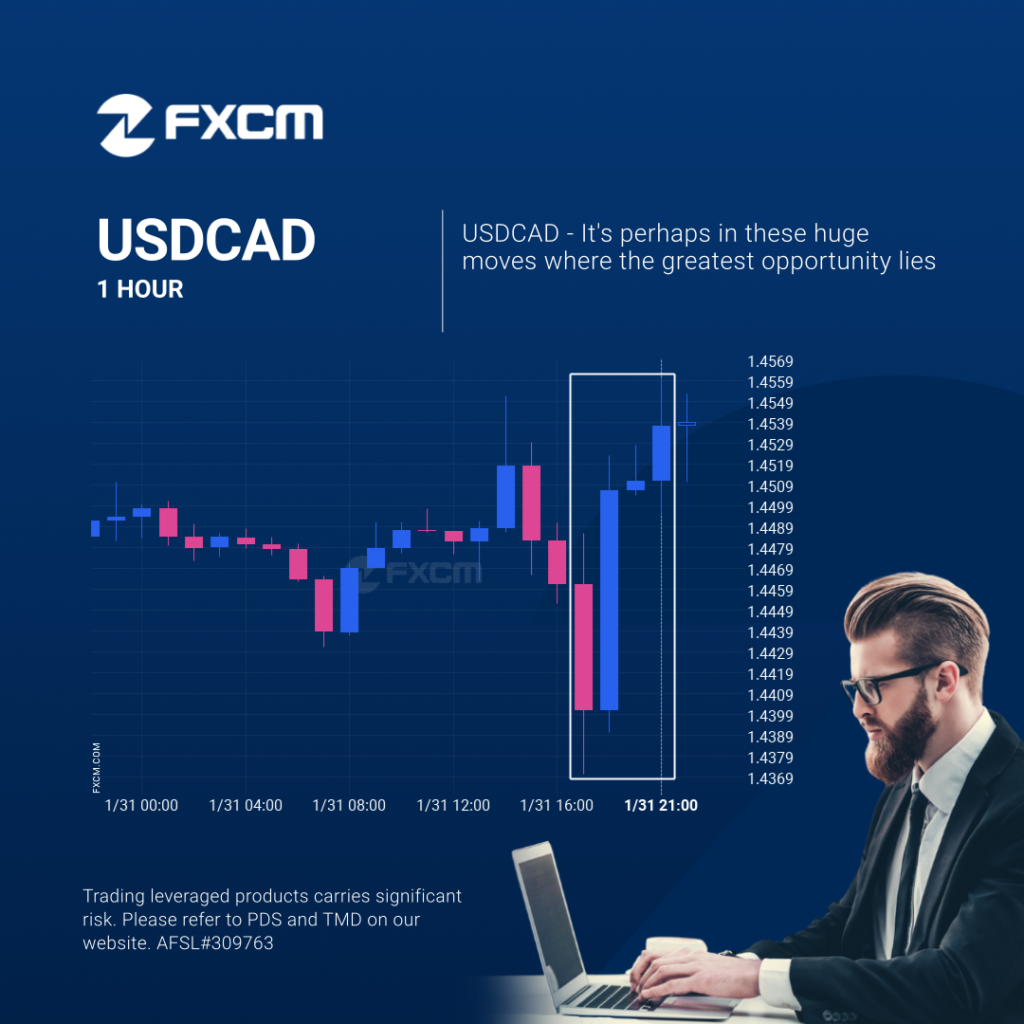
USDCAD rose sharply for 4 hours – which is an excessively big movement for this instrument; exceeding the 98% of past price moves. Even if this move is a sign of a new trend in USDCAD there is a chance that we will witness a correction, no matter how brief. Past performance is not an […]
A potential bullish movement on EURJPY
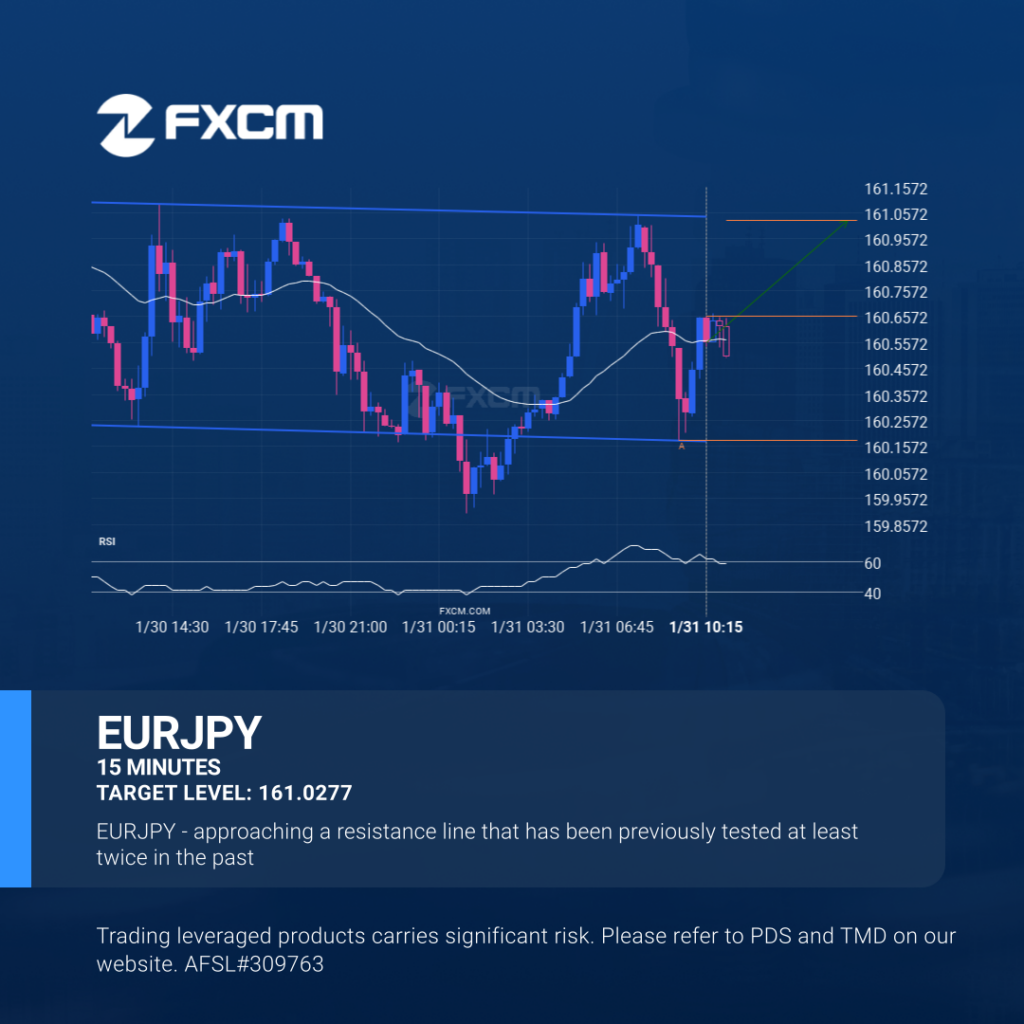
EURJPY was identified at around 160.659 having recently rebounded of the support on the 15 Minutes data interval. Ultimately, the price action of the stock has formed a Inverse Head and Shoulders pattern. This squeeze may increases the chances of a strong breakout. The projected movement will potentially take the price to around the 161.0277 […]
Breach of important price line imminent by NZDUSD

NZDUSD is en route to a very important line that will be a definite deciding factor of what is to come! We may see this trajectory continue to touch and break through 0.5661, unless it runs out of momentum and pulls back to current levels. Past performance is not an indicator of future results. Losses […]
Either a rebound or a breakout imminent on EURCHF

EURCHF is moving towards a support line. Because we have seen it retrace from this level in the past, we could see either a break through this line, or a rebound back to current levels. It has touched this line numerous times in the last 8 days and may test it again within the next […]
EURJPY – Continuation Chart Pattern – Falling Wedge

EURJPY is moving towards a support line which it has tested numerous times in the past. We have seen it retrace from this line before, so at this stage it isn’t clear whether it will breach this line or rebound as it did before. If EURJPY continues in its current trajectory, we could see it […]
Will NZDUSD have enough momentum to break support?
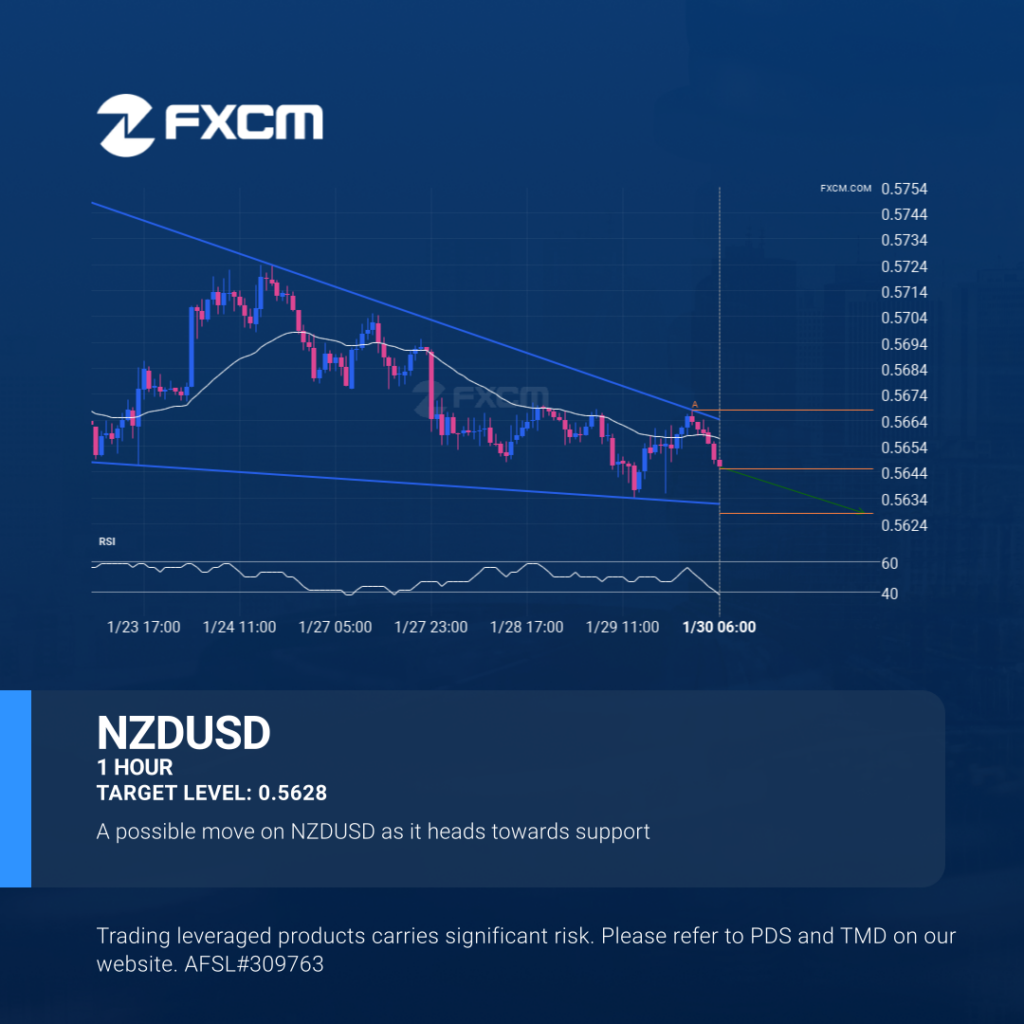
Emerging Falling Wedge detected on NZDUSD – the pattern is an emerging one and has not yet broken through resistance, but the price is expected to move up over the next few hours. The price at the time the pattern was found was 0.56453 and it is expected to move to 0.5628. Past performance is […]
AUDUSD – getting close to psychological price line
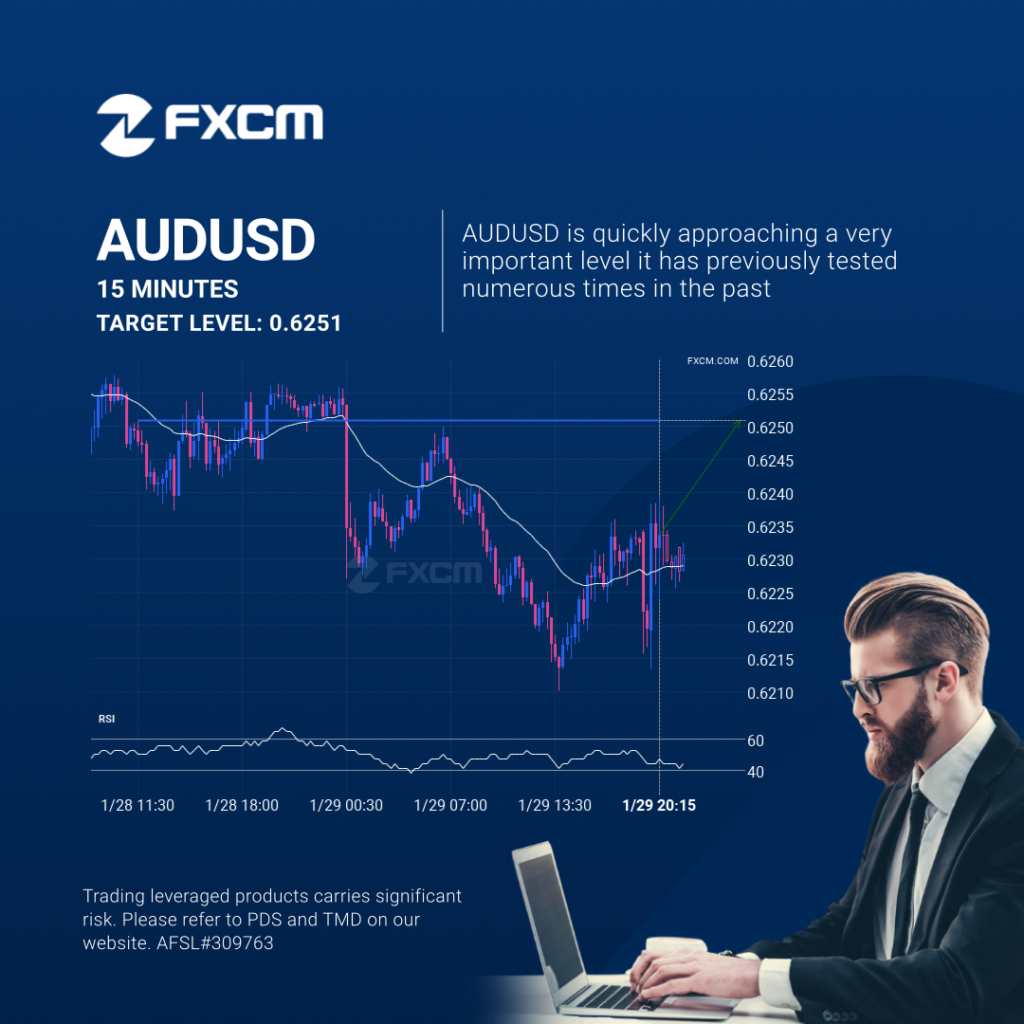
The movement of AUDUSD towards 0.6251 price line is yet another test of the line it reached numerous times in the past. We could expect this test to happen in the next 6 hours, but it is uncertain whether it will result in a breakout through this line, or simply rebound back to current lines. […]