AUDUSD approaching important level of 0.6370
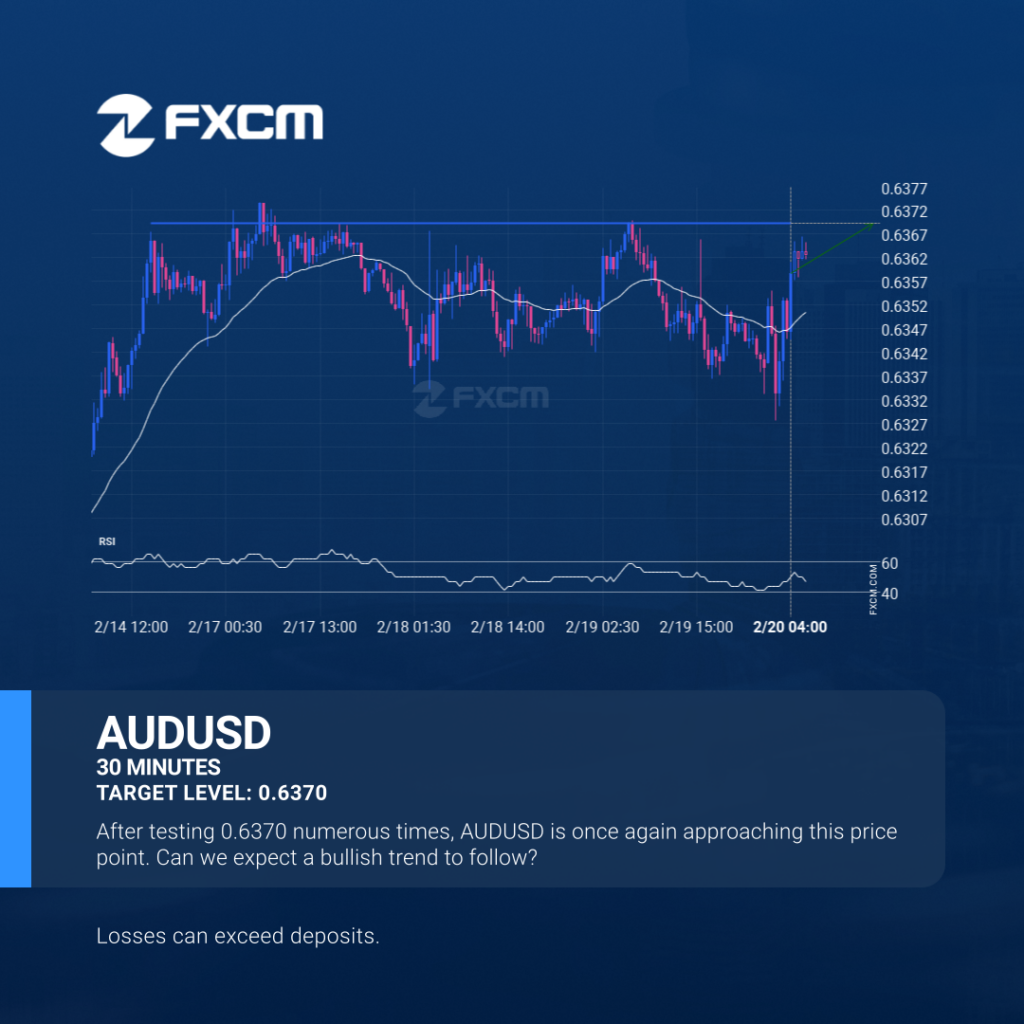
AUDUSD is heading towards 0.6370 and could reach this point within the next 19 hours. It has tested this line numerous times in the past, and this time could be no different, ending in a rebound instead of a breakout. If the breakout doesn’t happen, we could see a retracement back down to current levels. […]
Will NZDUSD have enough momentum to break resistance?

A Rising Wedge pattern was identified on NZDUSD at 0.5733, creating an expectation that it may move to the resistance line at 0.5779. It may break through that line and continue the bullish trend or it may reverse from that line. Past performance is not an indicator of future results. Losses can exceed deposits.
A potential bearish movement on EURGBP
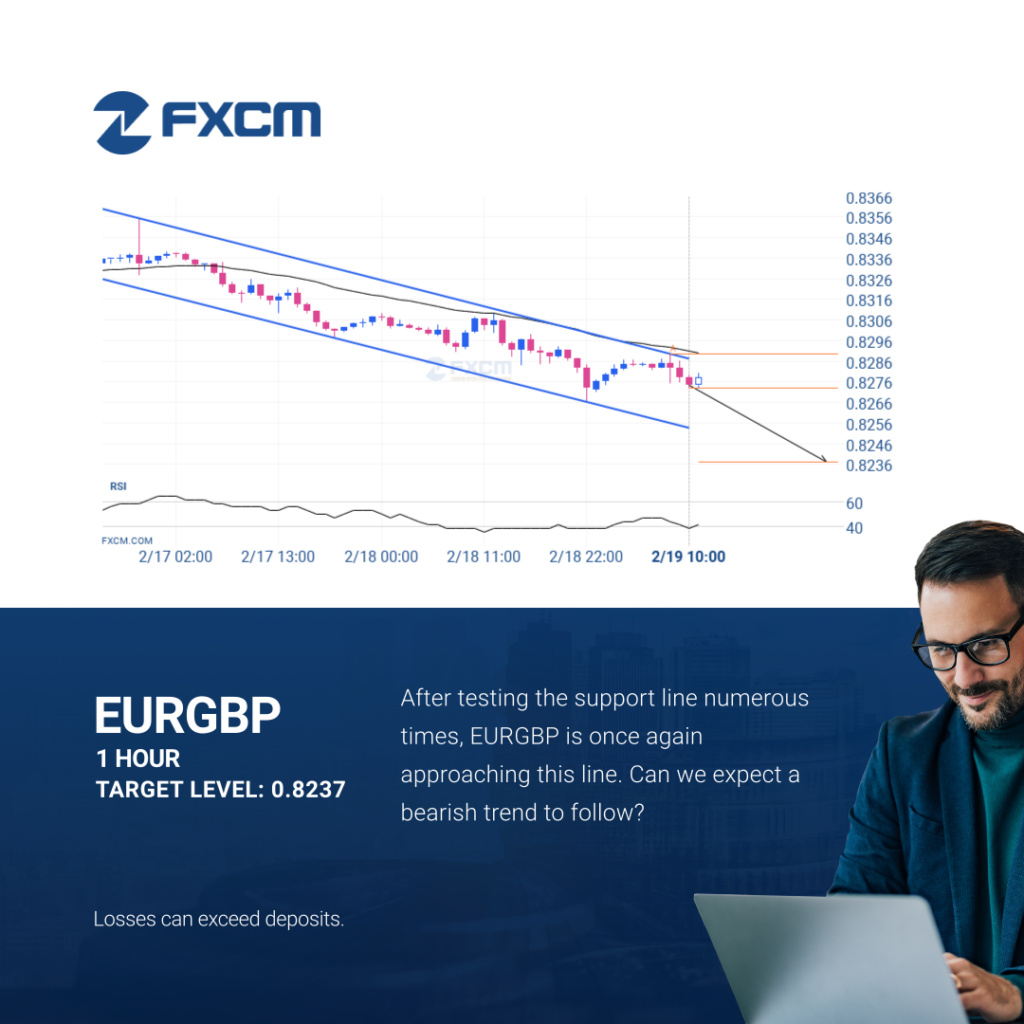
An emerging Channel Down has been detected on EURGBP on the 1 hour chart. There is a possible move towards 0.8237 next few candles. Once reaching resistance it may continue its bearish run or reverse back to current price levels. Past performance is not an indicator of future results. Losses can exceed deposits.
EURCHF has broken through resistance
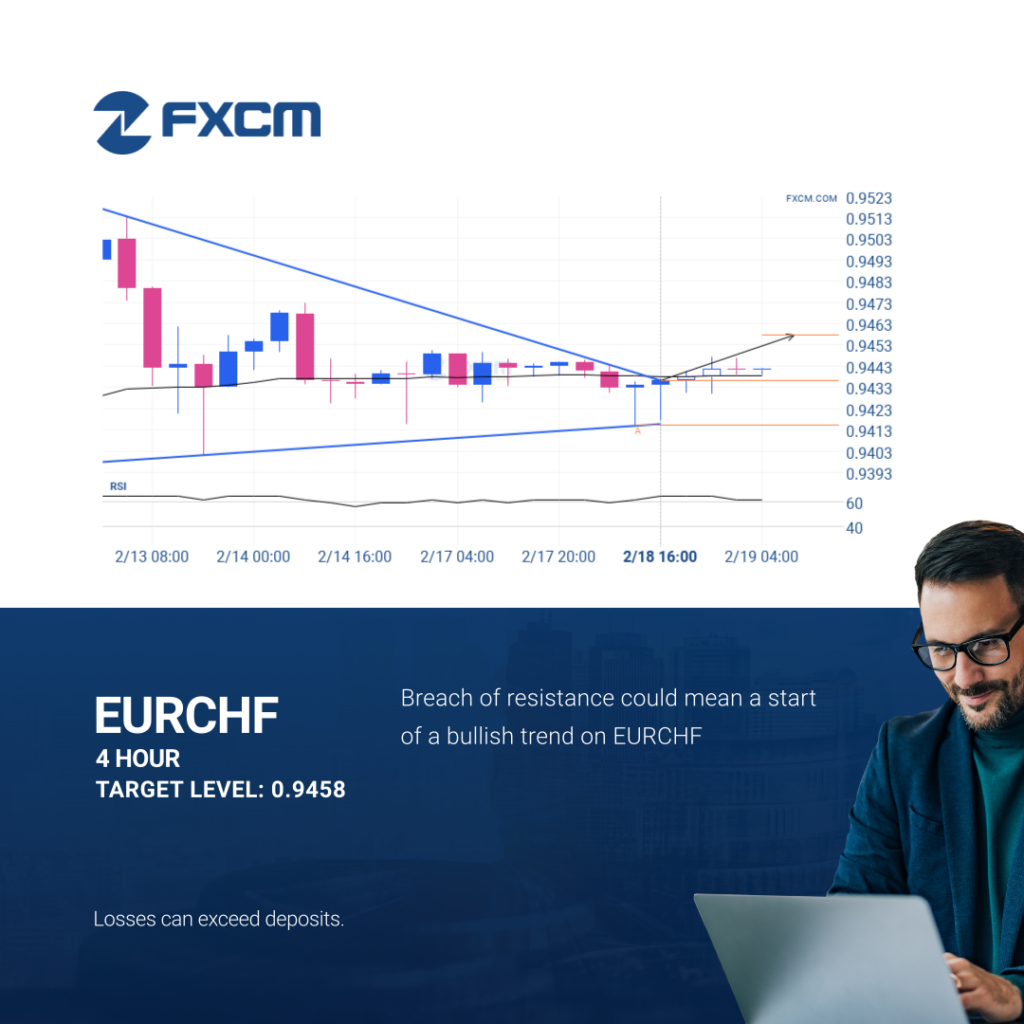
The last 9 4 hour candles on EURCHF formed a Triangle pattern and broken out through the pattern lines, indicating a possible bullish movement towards the price level of 0.9458. Past performance is not an indicator of future results. Losses can exceed deposits.
AUDUSD approaching resistance level
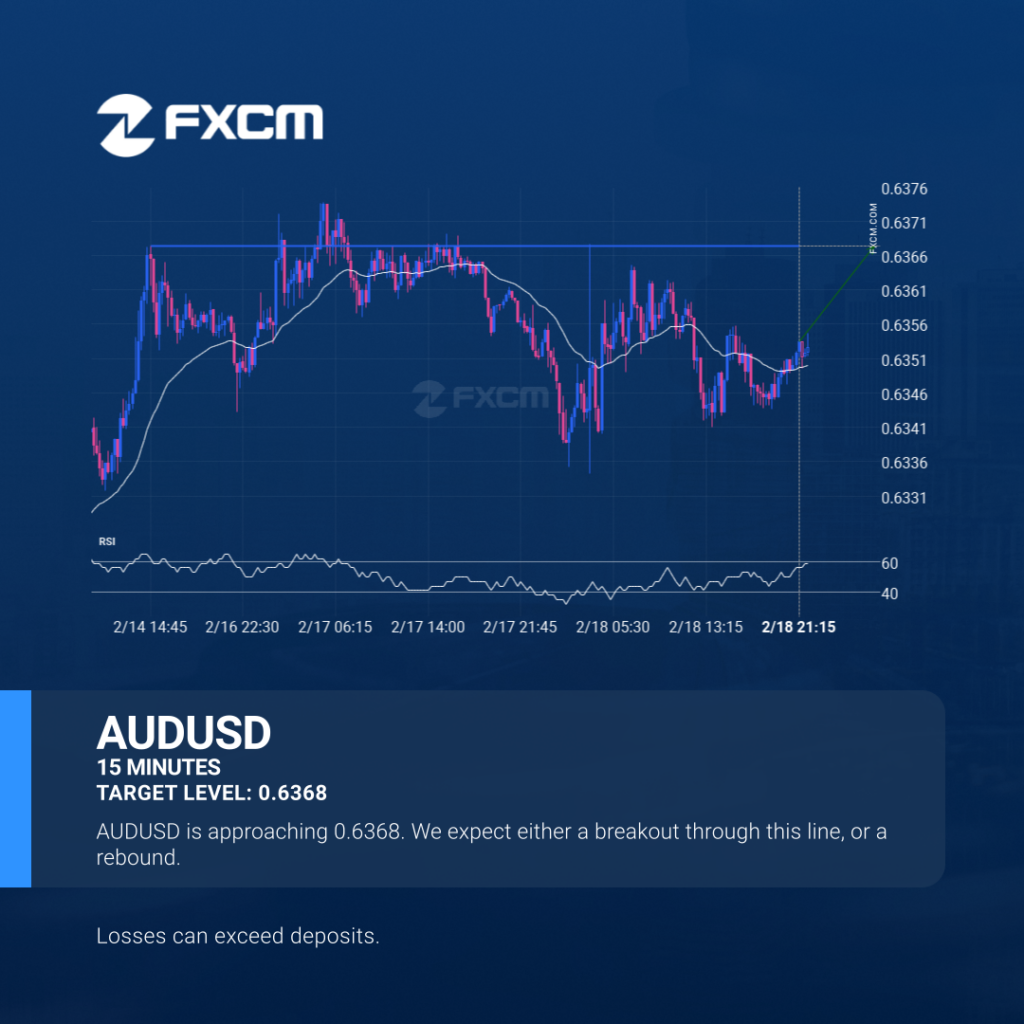
AUDUSD is approaching a resistance line at 0.6368. If it hits the resistance line, it may break through this level to continue the bullish trend, or it may turn around back to current levels. Past performance is not an indicator of future results. Losses can exceed deposits.
USDCAD is on its way down
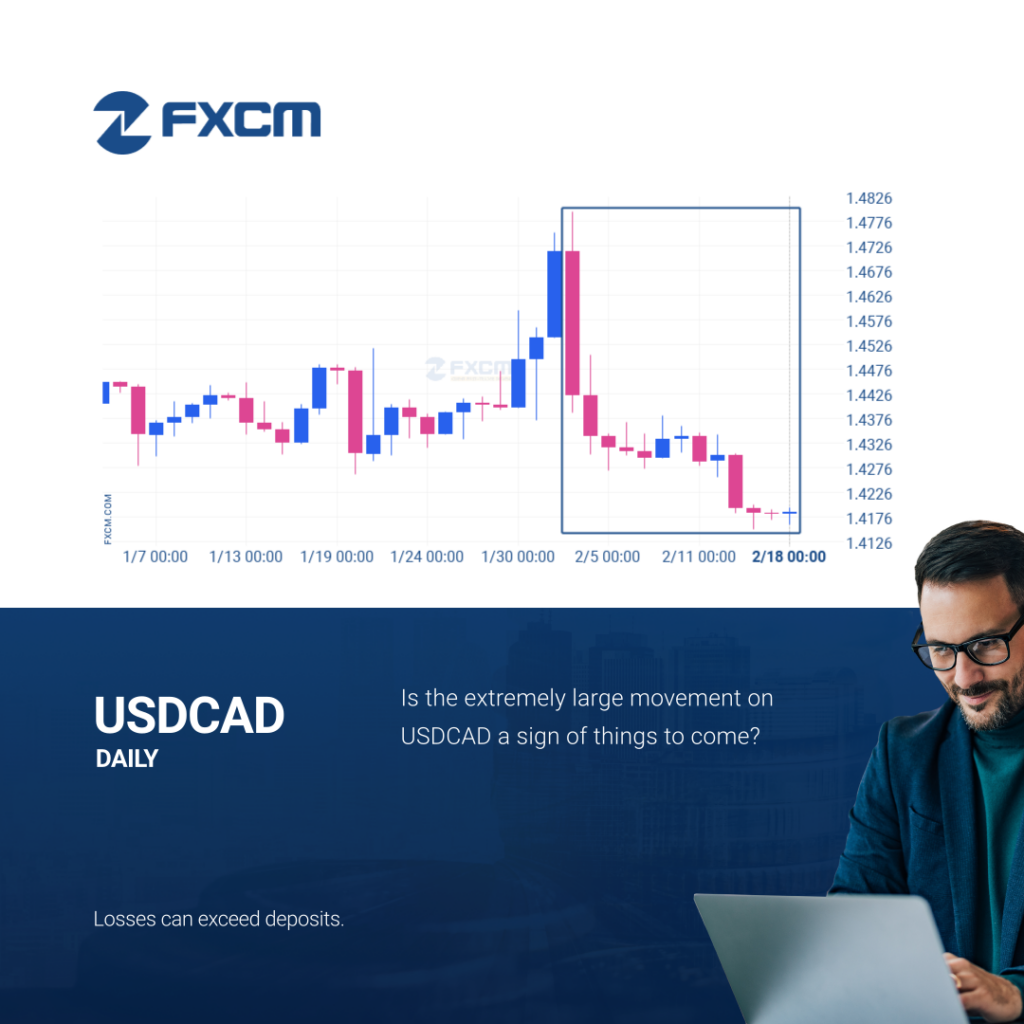
USDCAD has moved lower by 1.64% from 1.44219 to 1.41856 in the last 16 days. Past performance is not an indicator of future results. Losses can exceed deposits.
Resistance breakout on XAUUSD
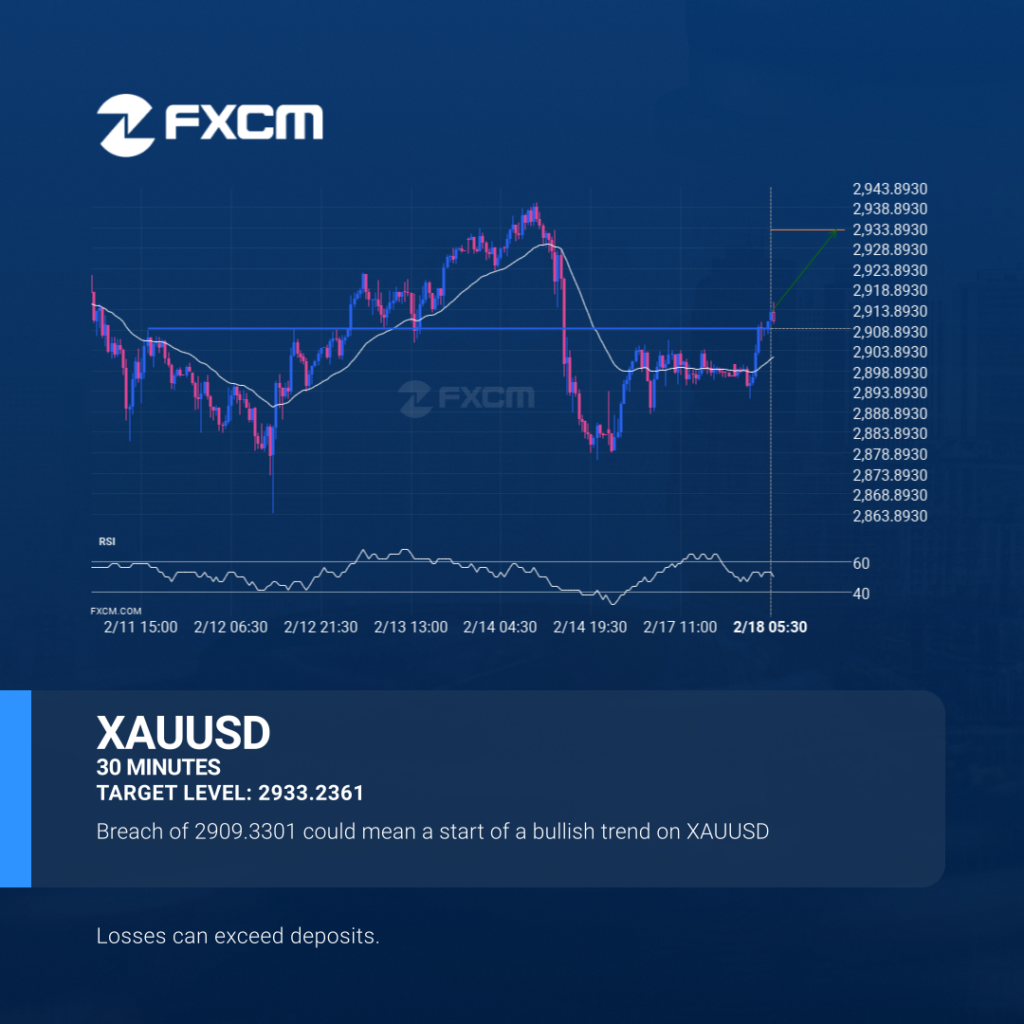
XAUUSD is once again retesting a key horizontal resistance level at 2909.3301. It has tested this level 6 times in the recent past and could simply bounce off like it did last time. However, after this many tries, maybe it’s ready to start a new trend. Past performance is not an indicator of future results. […]
EURGBP – psychological price line breached
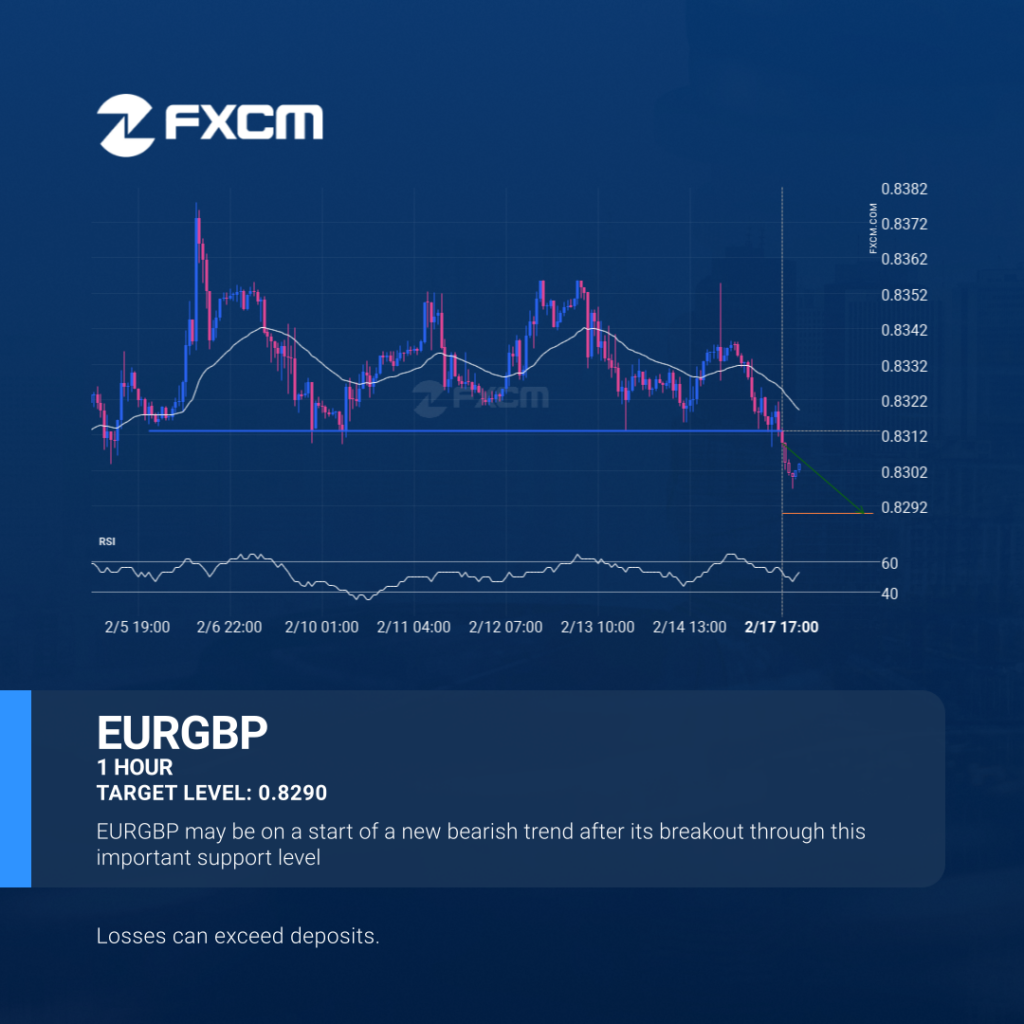
EURGBP has broken through a line of 0.8314. If this breakout holds true, we could see the price of EURGBP heading towards 0.8290 within the next 2 days. But don’t be so quick to trade, it has tested this line numerous times in the past, so you should probably confirm the breakout before placing any […]
USDJPY approaching important bearish key level
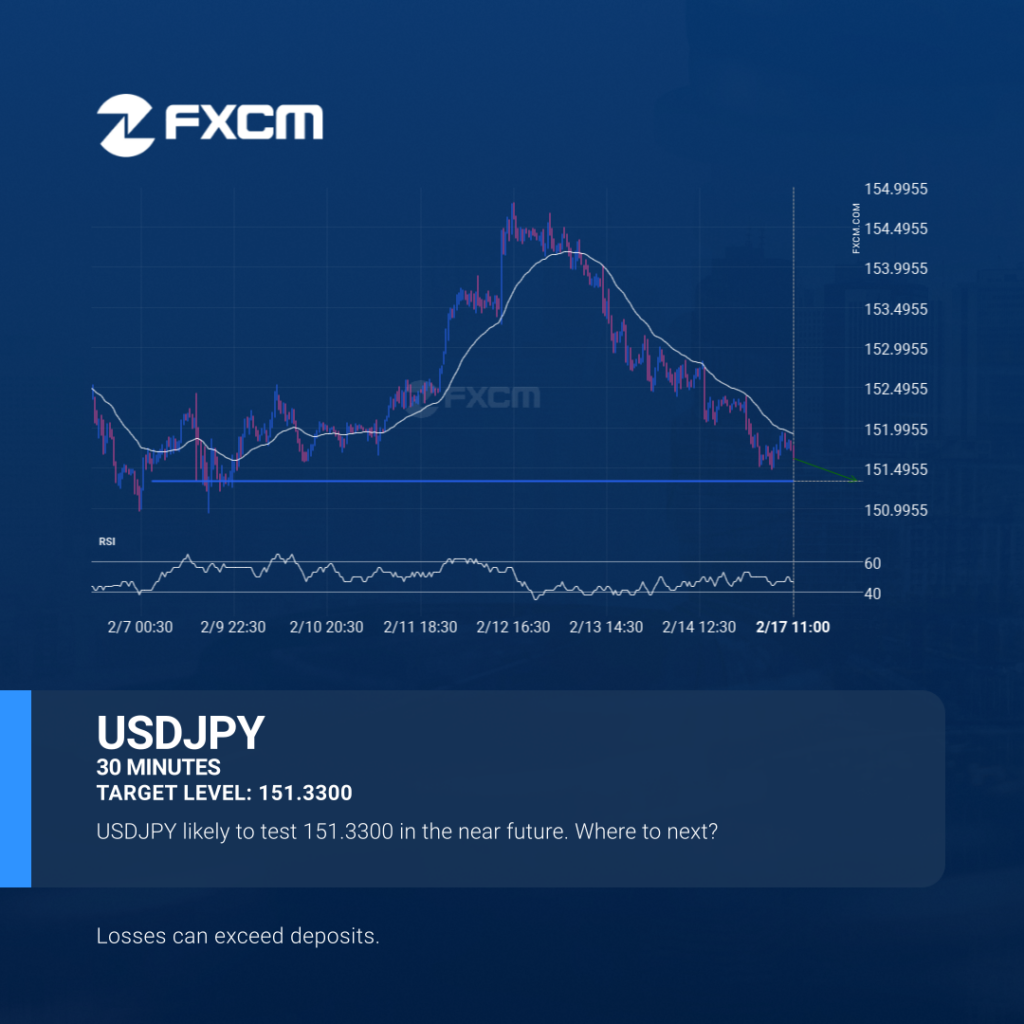
USDJPY is moving towards a key support level at 151.3300. USDJPY has previously tested this level 6 times and on each occasion it has bounced back off this level. Is this finally the time it will break through? Past performance is not an indicator of future results. Losses can exceed deposits.
Will USDCAD bounce after a massive drop?
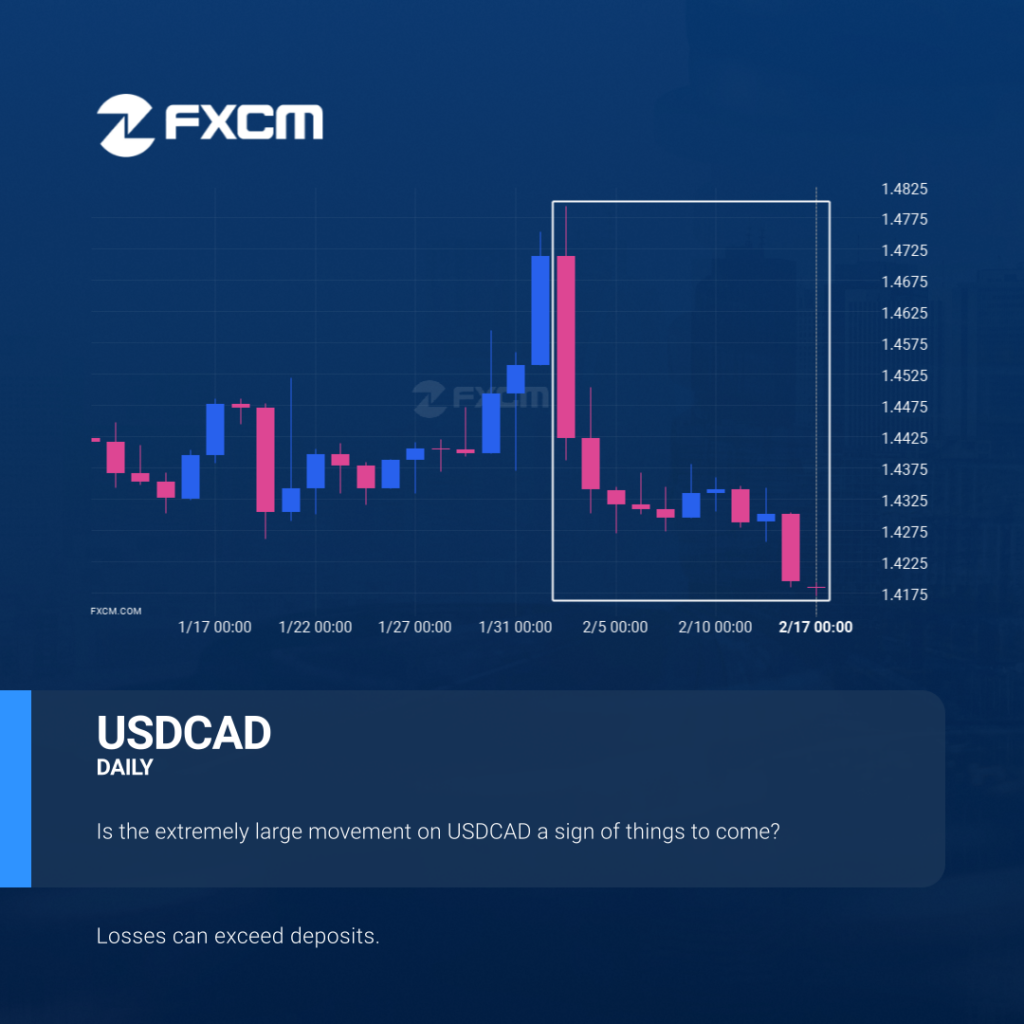
Those of you that are trend followers are probably eagerly watching USDCAD to see if its latest 1.67% move continues. If not, the mean-reversion people out there will be delighted with this exceptionally large 15 days move. Past performance is not an indicator of future results. Losses can exceed deposits.