EURJPY approaching important level of 157.4210

EURJPY is moving towards a key resistance level at 157.4210. EURJPY has previously tested this level 4 times and on each occasion it has bounced back off this level. Is this finally the time it will break through? Past performance is not an indicator of future results. Losses can exceed deposits.
Will EURUSD have enough momentum to break resistance?
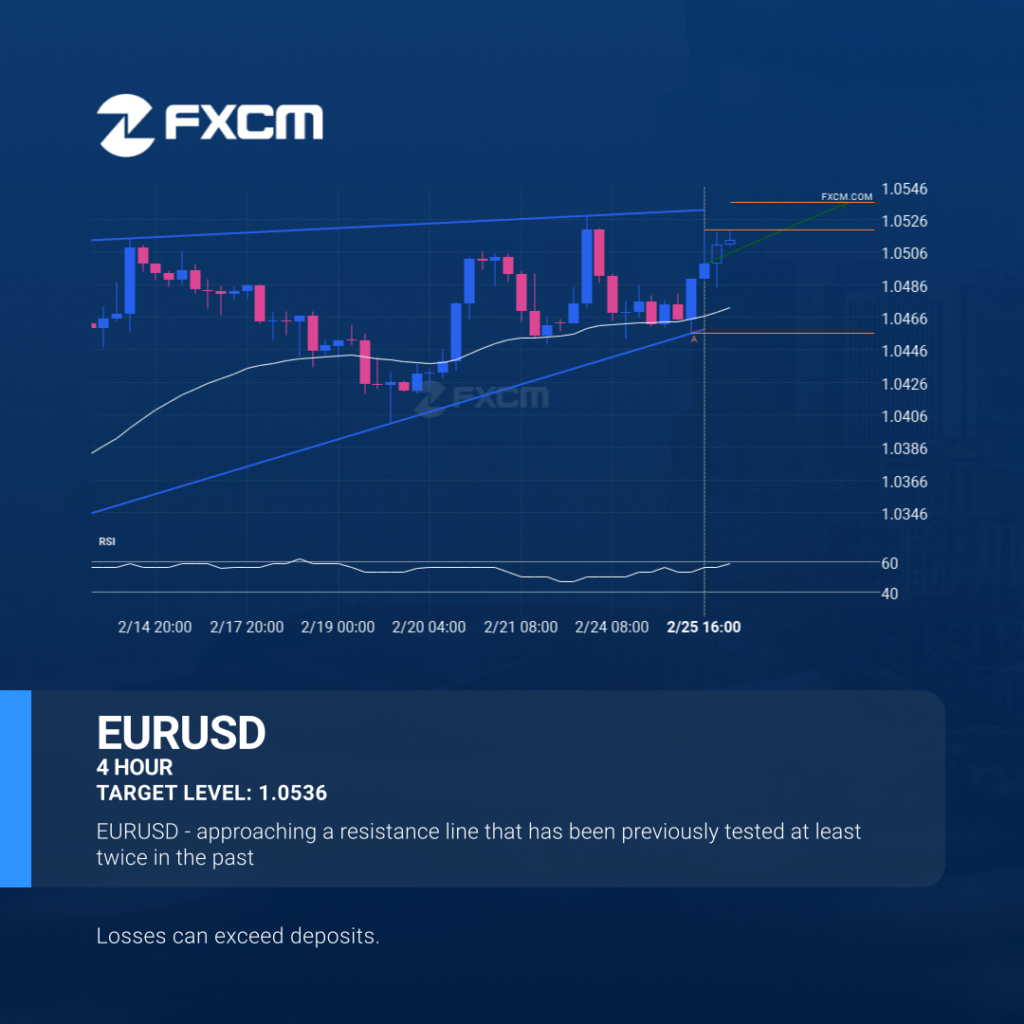
EURUSD is moving towards a resistance line which it has tested numerous times in the past. We have seen it retrace from this line before, so at this stage it isn’t clear whether it will breach this line or rebound as it did before. If EURUSD continues in its current trajectory, we could see it […]
Possible start of a bearish trend on AUDUSD

The price of AUDUSD in heading in the direction of 0.6303. Despite the recent breakout through 0.6334 it is possible that it will struggle to gain momentum to the forecast price and move back in the other direction. This has happened many times in the past so watch for a possible bounce back. Past performance […]
A potential bearish movement on USDJPY
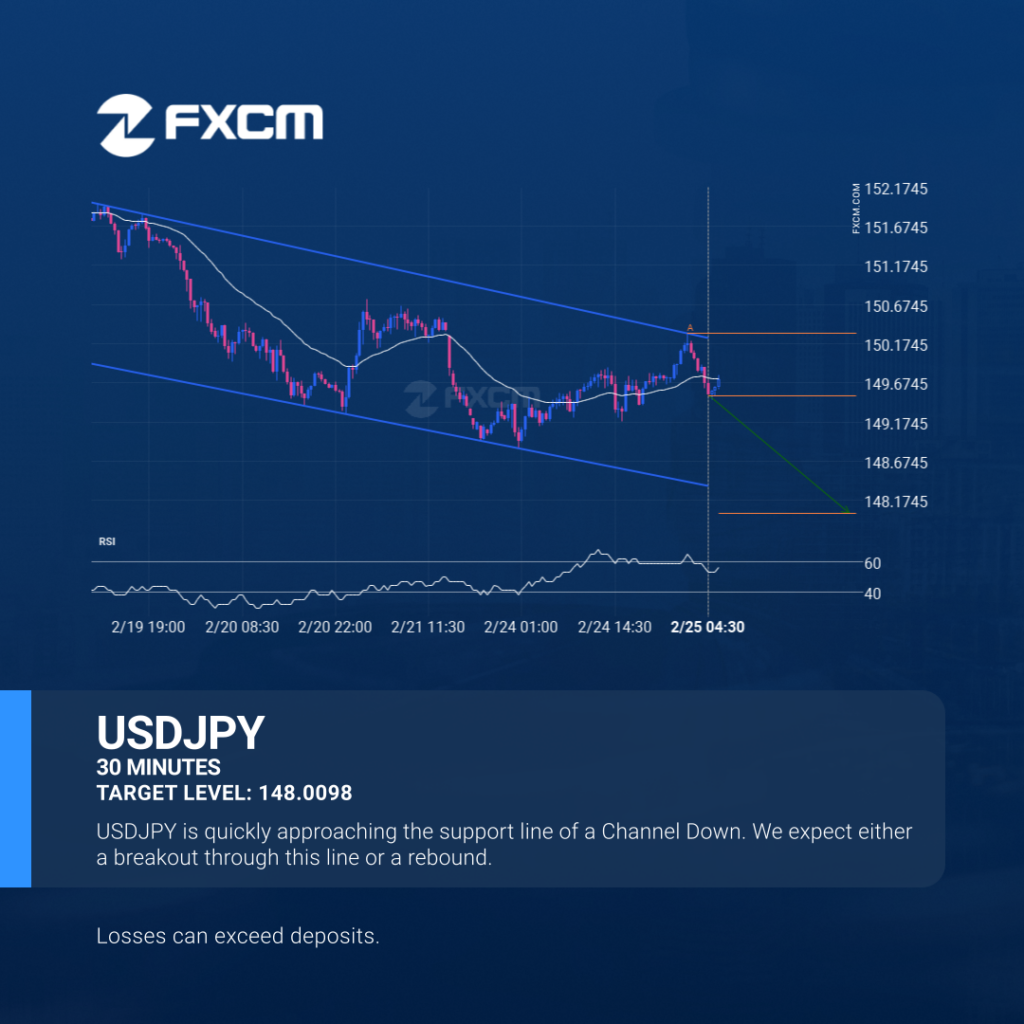
USDJPY is moving towards a support line which it has tested numerous times in the past. We have seen it retrace from this line before, so at this stage it isn’t clear whether it will breach this line or rebound as it did before. If USDJPY continues in its current trajectory, we could see it […]
EURJPY – Reversal Chart Pattern – Triangle

EURJPY is heading towards the support line of a Triangle and could reach this point within the next 10 hours. It has tested this line numerous times in the past, and this time could be no different from the past, ending in a rebound instead of a breakout. If the breakout doesn’t happen, we could […]
AUDUSD – getting close to psychological price line
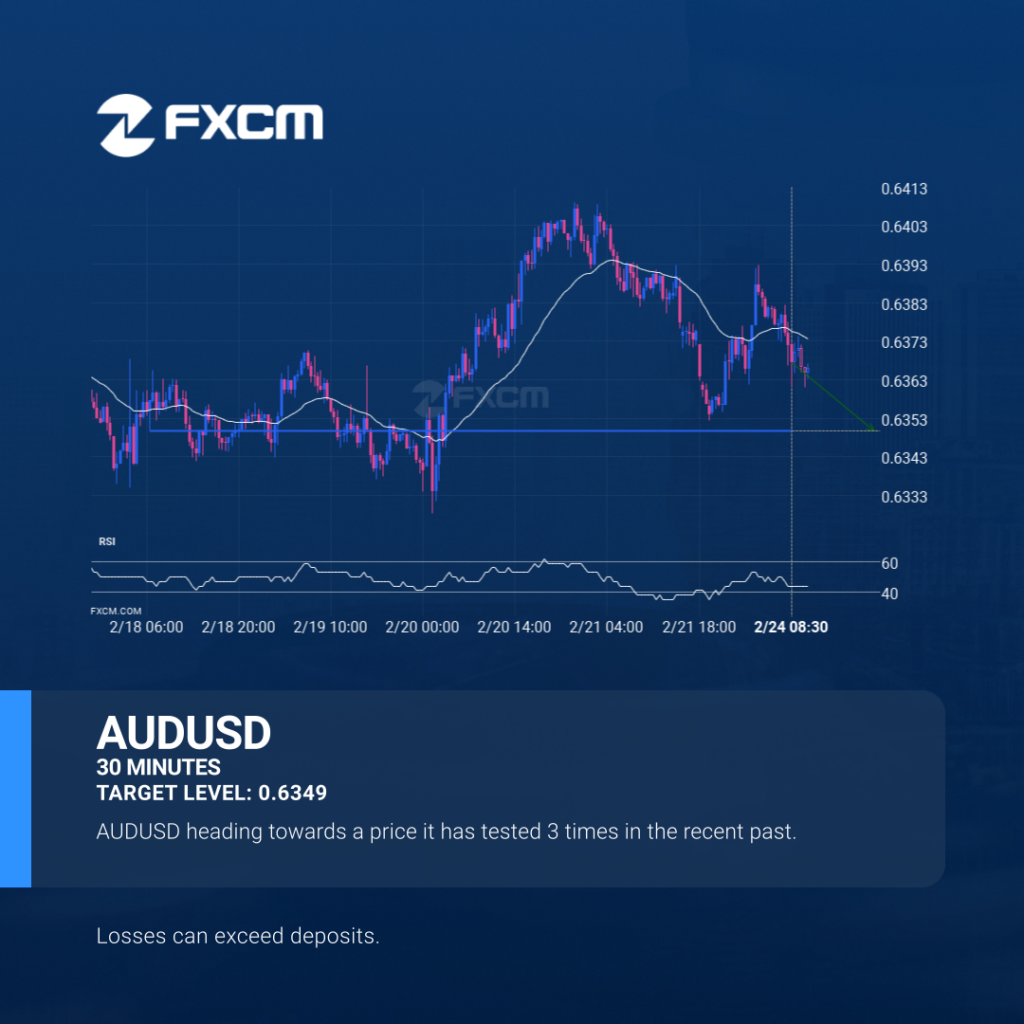
AUDUSD is moving towards a key support level at 0.6349. This is a previously tested level for AUDUSD. This could be a good trading opportunity, either at the spot price, or after breaching this level. Past performance is not an indicator of future results. Losses can exceed deposits.
Is EURGBP likely to correct after this massive movement?

A movement of 0.32% over 3 days on EURGBP doesn’t go unnoticed. You may start considering where it’s heading next, a continuation of the current upward trend, or a reversal in the previous direction. Past performance is not an indicator of future results. Losses can exceed deposits.
Triangle breakout on EURCHF

The breakout of EURCHF through the support line of a Triangle could be a sign of the road ahead. If this breakout persists, we may see the price of EURCHF testing 0.9381 within the next 2 days. Past performance is not an indicator of future results. Losses can exceed deposits.
GBPUSD – Continuation Chart Pattern – Rising Wedge
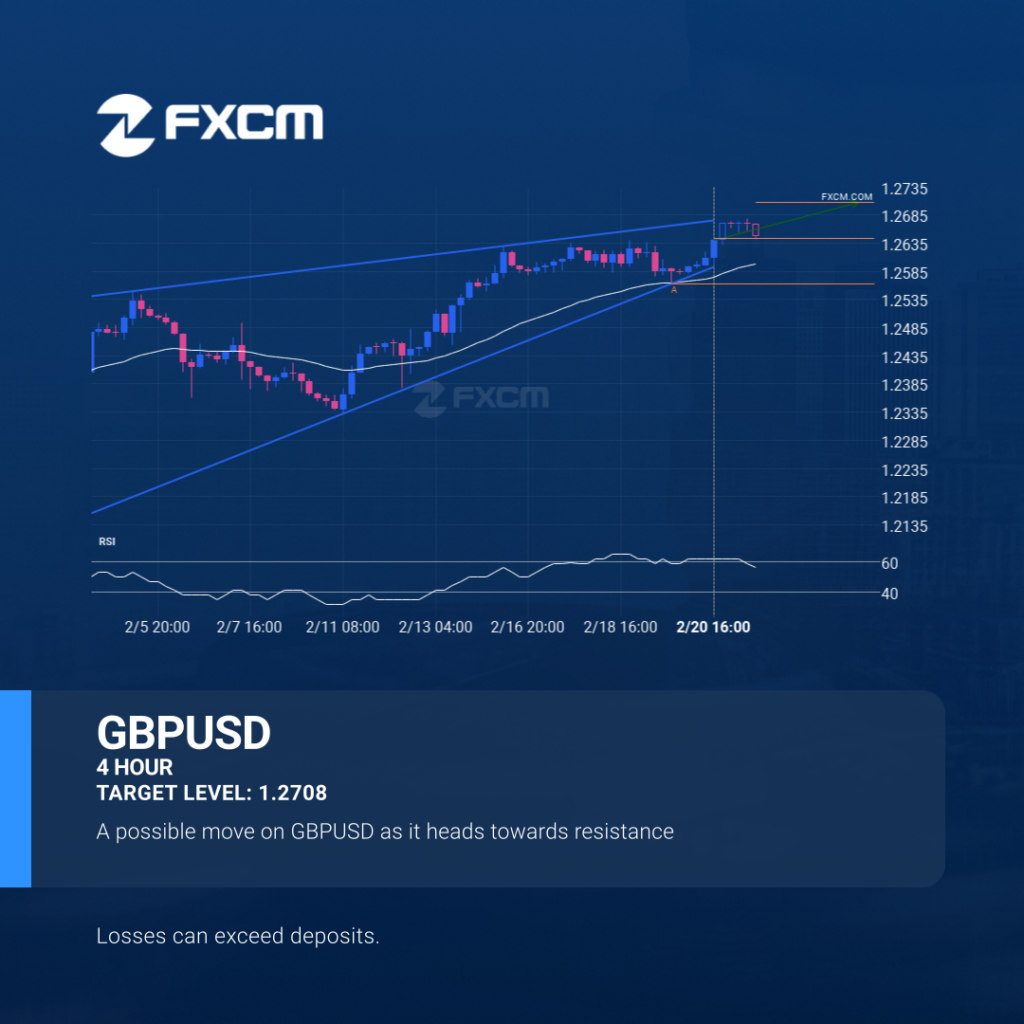
Emerging Rising Wedge detected on GBPUSD – the pattern is an emerging one and has not yet broken through support, but the price is expected to move up over the next few hours. The price at the time the pattern was found was 1.26437 and it is expected to move to 1.2708. Past performance is […]
USDCAD approaching important bearish key level

The movement of USDCAD towards 1.4177 price line is yet another test of the line it reached numerous times in the past. We could expect this test to happen in the next 2 days, but it is uncertain whether it will result in a breakout through this line, or simply rebound back to current lines. […]