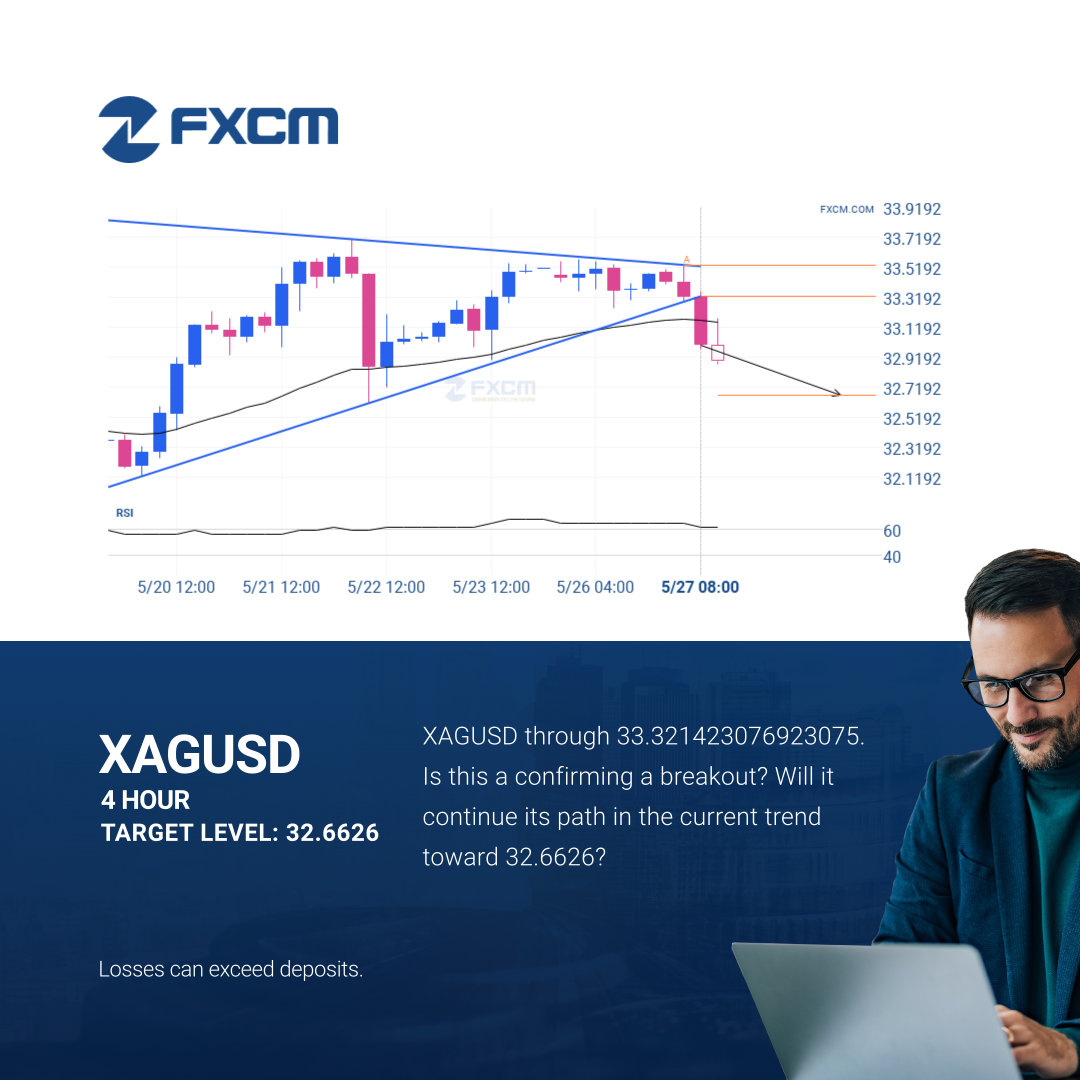
XAGUSD moved through the support line of a Triangle at 33.321423076923075 on the 4 hour chart. This line has been tested a number of times in the past and this breakout could mean an upcoming change from the current trend. It may continue in its current direction toward 32.6626.
Past performance is not an indicator of future results.
Losses can exceed deposits.