GBPUSD – se acerca a la línea de precio psicológico

¡GBPUSD está en camino a una línea muy importante que definitivamente será un factor decisivo de lo que está por venir! Es posible que veamos que esta trayectoria continúa tocando el nivel en 1.3306 y lo acabe rompiendo, a menos que se quede sin impulso y vuelva a los niveles actuales. El rendimiento pasado no […]
GBPUSD – getting close to psychological price line
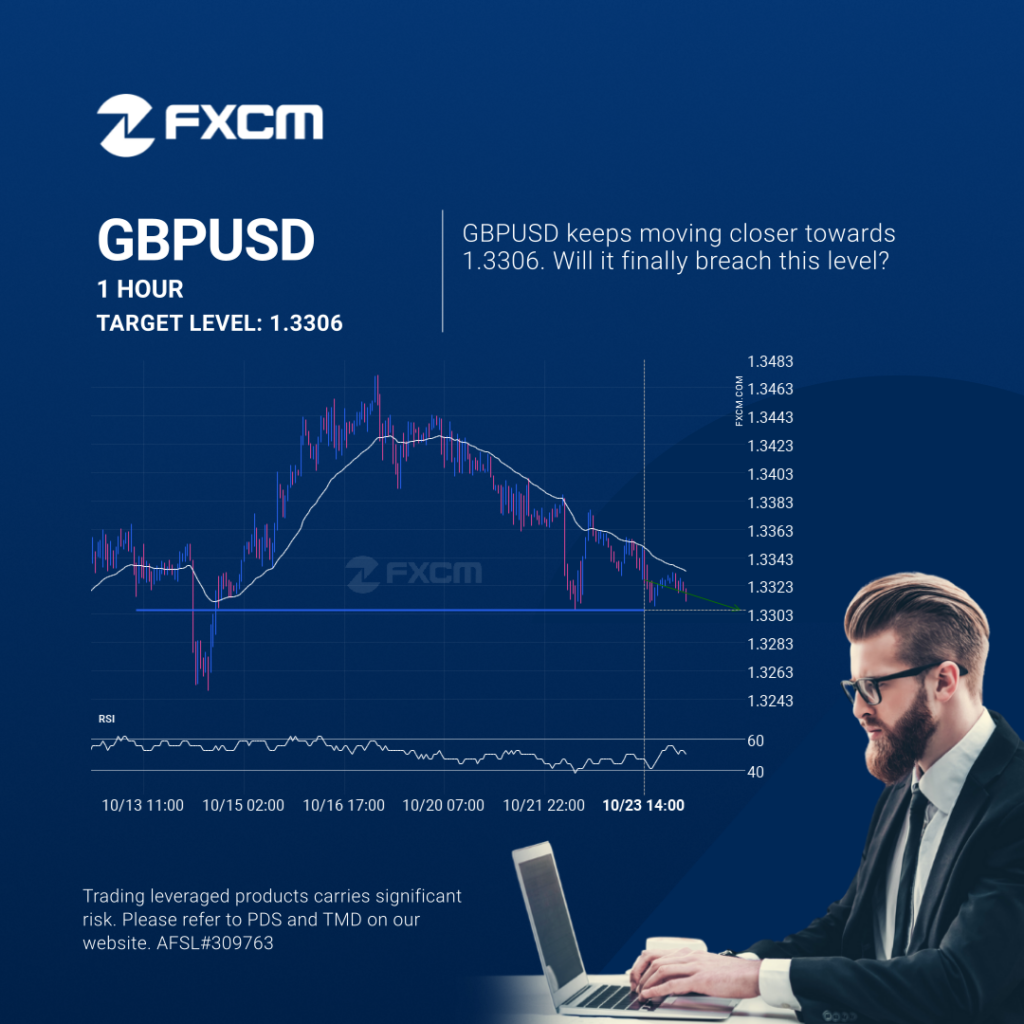
GBPUSD is en route to a very important line that will be a definite deciding factor of what is to come! We may see this trajectory continue to touch and break through 1.3306, unless it runs out of momentum and pulls back to current levels. Past performance is not an indicator of future results. Trading […]
GBPUSD – getting close to psychological price line
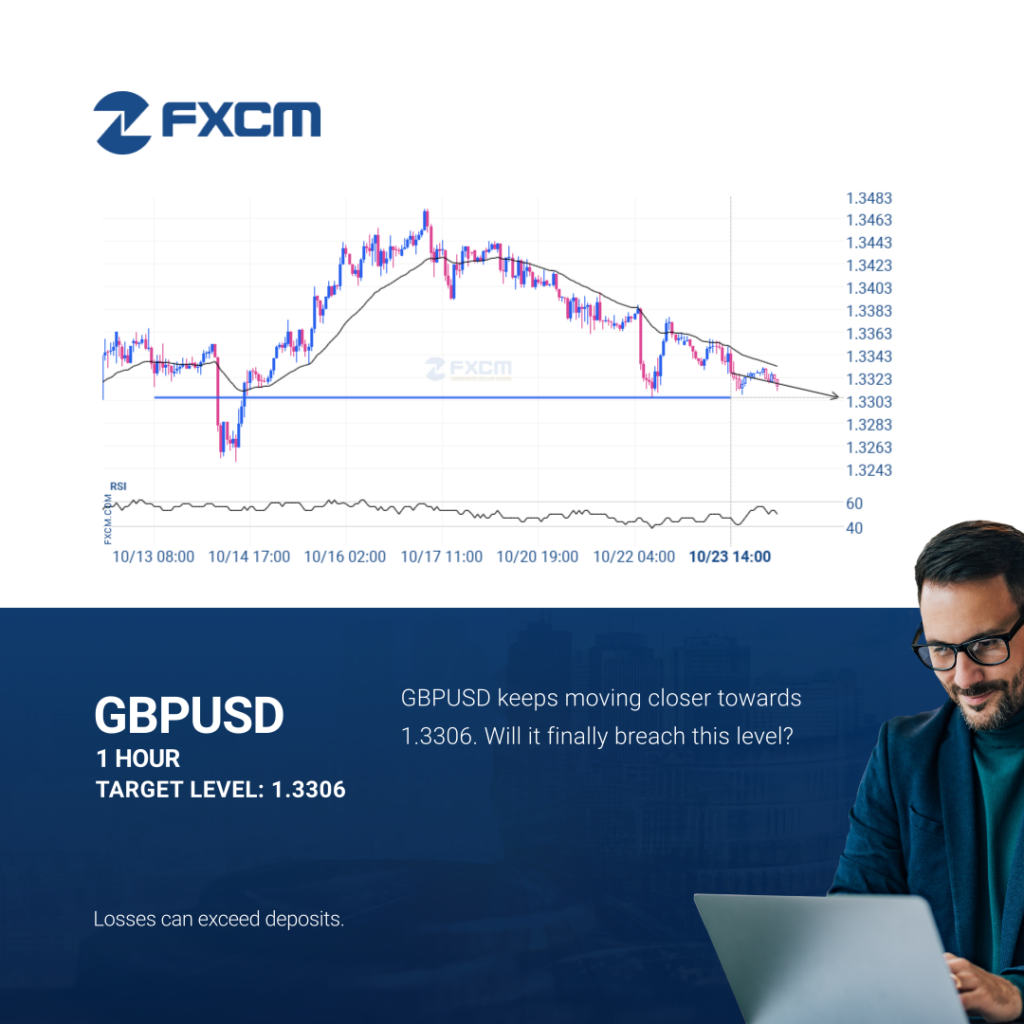
GBPUSD is en route to a very important line that will be a definite deciding factor of what is to come! We may see this trajectory continue to touch and break through 1.3306, unless it runs out of momentum and pulls back to current levels. Past performance is not an indicator of future results. Losses […]
EURCHF showing momentum.

A movement of 0.32% over 2 days on EURCHF doesn’t go unnoticed. You may start considering where it’s heading next, a continuation of the current upward trend, or a reversal in the previous direction. Past performance is not an indicator of future results. Losses can exceed deposits.
Un posible impulso final en el ESP35

El precio de ESP35 ha vuelto a la zona de soporte. Es posible que tenga dificultades para atravesarla y que retroceda en la otra dirección. El precio eventualmente puede romper, pero normalmente el precio rebota en el nivel varias veces antes de hacerlo. El rendimiento pasado no es indicativo de resultados futuros. Las pérdidas pueden […]
AUDUSD approaches important level of 0.6525
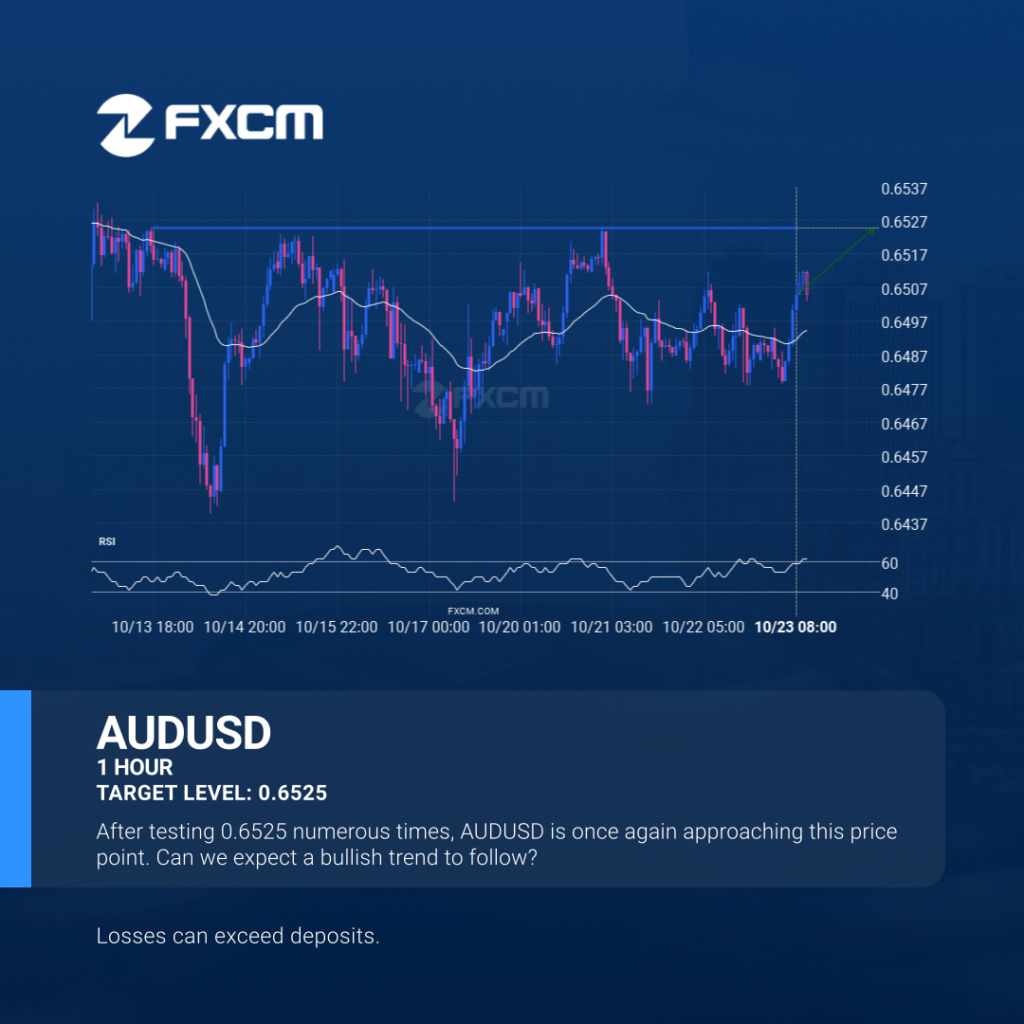
AUDUSD is heading towards a line of 0.6525. If this movement continues, the price of AUDUSD could test 0.6525 within the next 2 days. But don’t be so quick to trade, it has tested this line numerous times in the past, so this movement could be short-lived and end up rebounding. Past performance is not […]
HKG33 – getting close to resistance of a Channel Up

HKG33 is heading towards the resistance line of a Channel Up. If this movement continues, the price of HKG33 could test 26784.6029 within the next 2 days. It has tested this line numerous times in the past, so this movement could be short-lived and end up rebounding just like it did in the past. Past […]
HKG33 – getting close to resistance of a Channel Up

HKG33 is heading towards the resistance line of a Channel Up. If this movement continues, the price of HKG33 could test 26784.6029 within the next 2 days. It has tested this line numerous times in the past, so this movement could be short-lived and end up rebounding just like it did in the past. Past […]
AUDUSD se acerca a un nivel importante en 0.6525
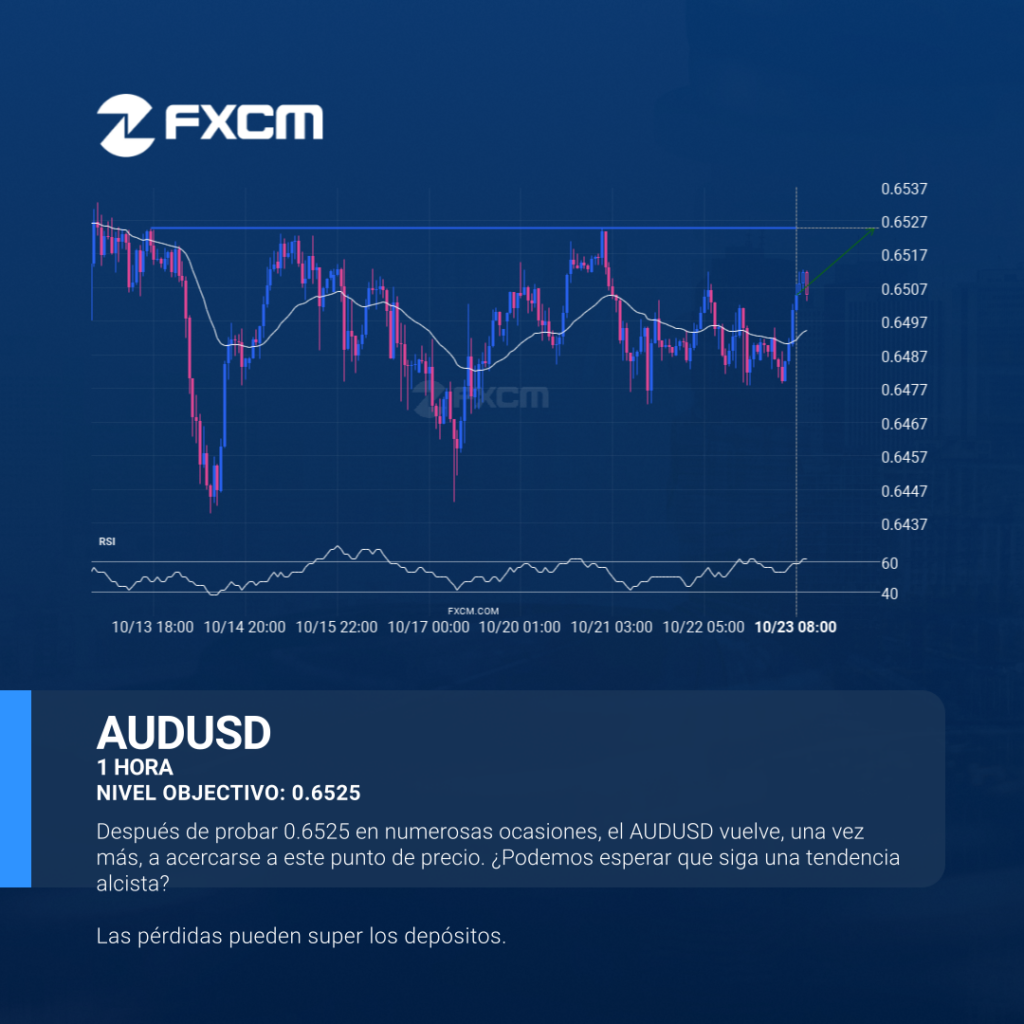
El AUDUSD avanza hacia la línea de 0.6525. Si este movimiento se mantiene, el precio del AUDUSD podría probar el nivel de 0.6525 en un plazo de 2 días. Pero no se apresure a la hora de operar, porque el par ha probado esta línea en numerosas ocasiones durante el pasado, por lo que este […]
HKG33 – acercándose a la resistencia del Canal alcista

El HKG33 se dirige a la línea de resistencia de un Canal alcista. Si este movimiento se mantiene, el precio de HKG33 podría probar el nivel de 26784.6029 en las próximas 2 días. Ya ha probado esta línea en numerosas ocasiones, por lo que este movimiento podría durar poco y terminar recuperándose, igual que ha […]