Posible comienzo de una tendencia alcista cuando ESP35 rompa el nivel de resistencia
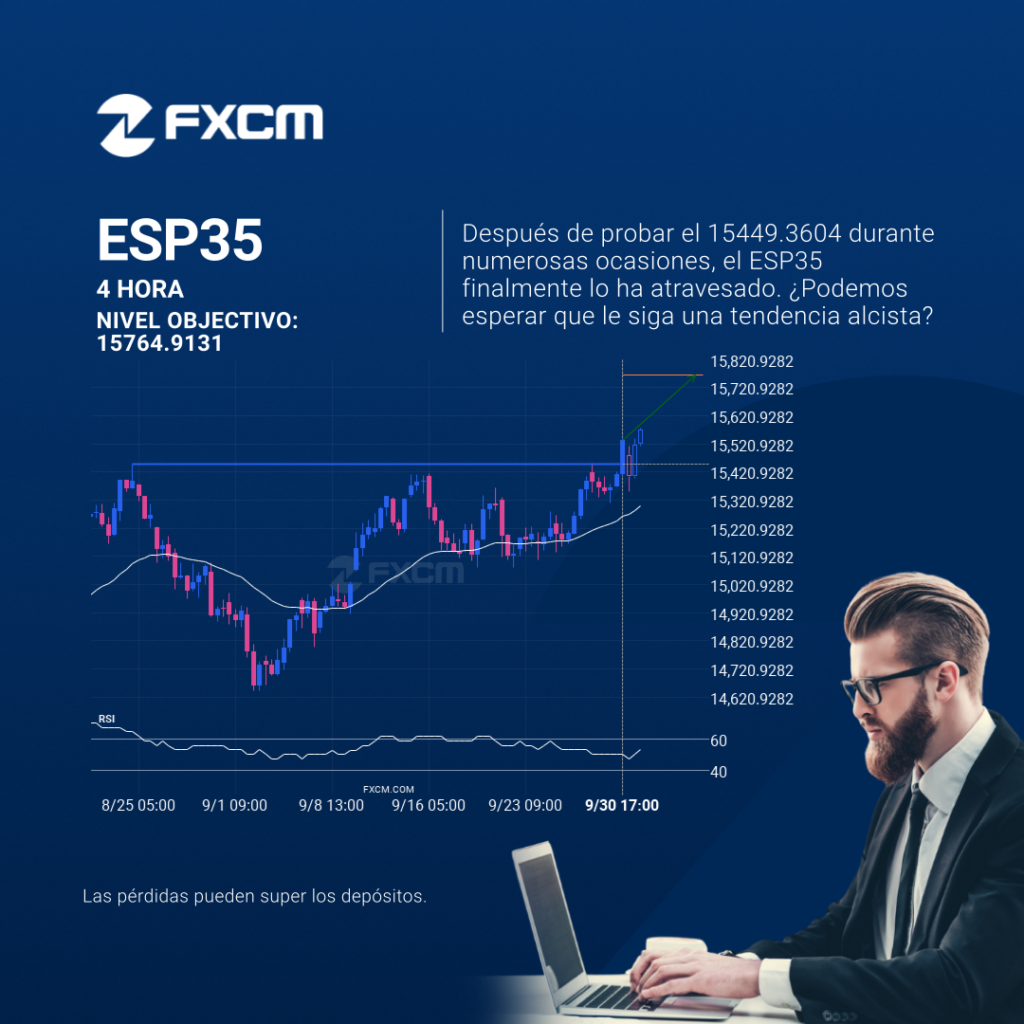
La rotura del ESP35 a través de la línea de precio en 15449.3604 es una brecha de un importante precio psicológico que se ha probado numerosas veces en el pasado. Si esta rotura persiste, el ESP35 podría probar el nivel de 15764.9131 durante las siguientes 3 días. Habría que ser prudentes antes de ejecutar una […]
Possible start of a bullish trend as ESP35 breaks resistance
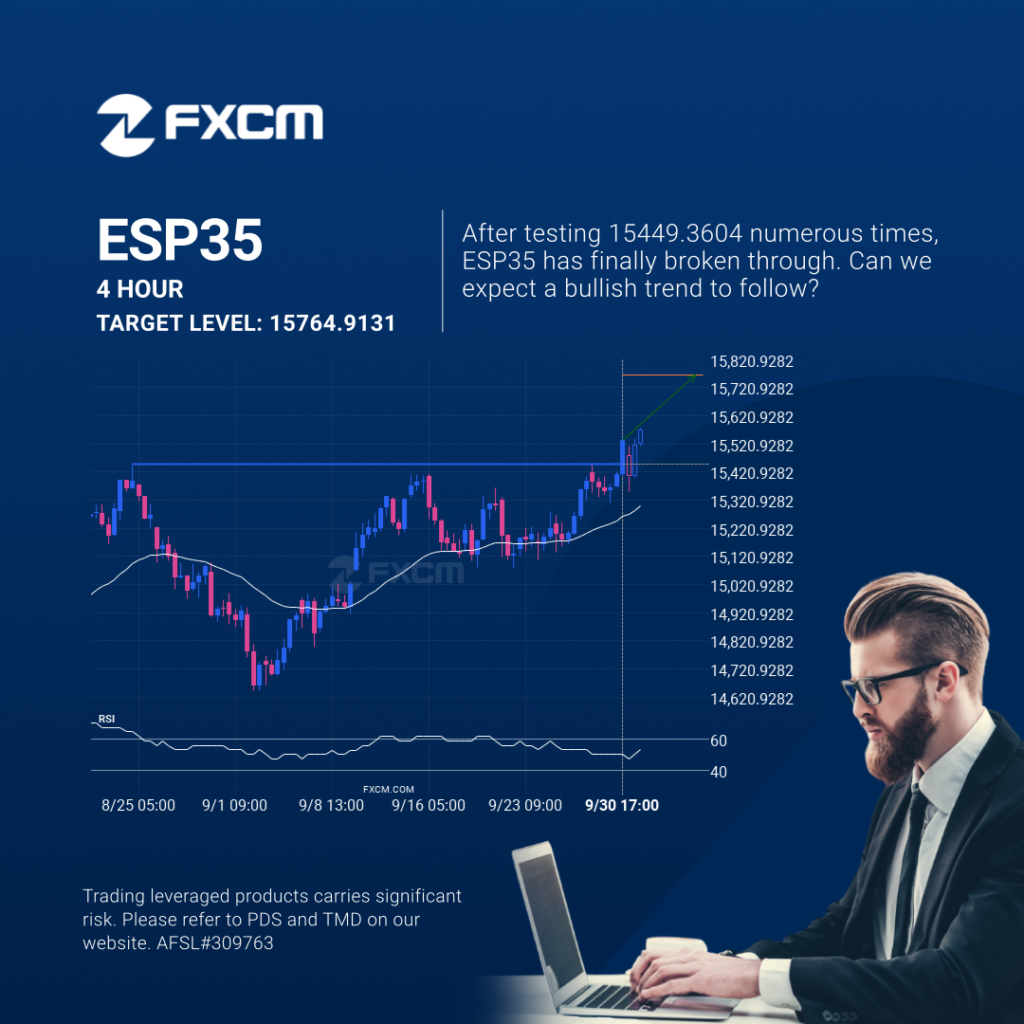
The breakout of ESP35 through the 15449.3604 price line is a breach of an important psychological price that is has tested numerous in the past. If this breakout persists, ESP35 could test 15764.9131 within the next 3 days. One should always be cautious before placing a trade, wait for confirmation of the breakout. Past performance […]
Possible start of a bullish trend as ESP35 breaks resistance
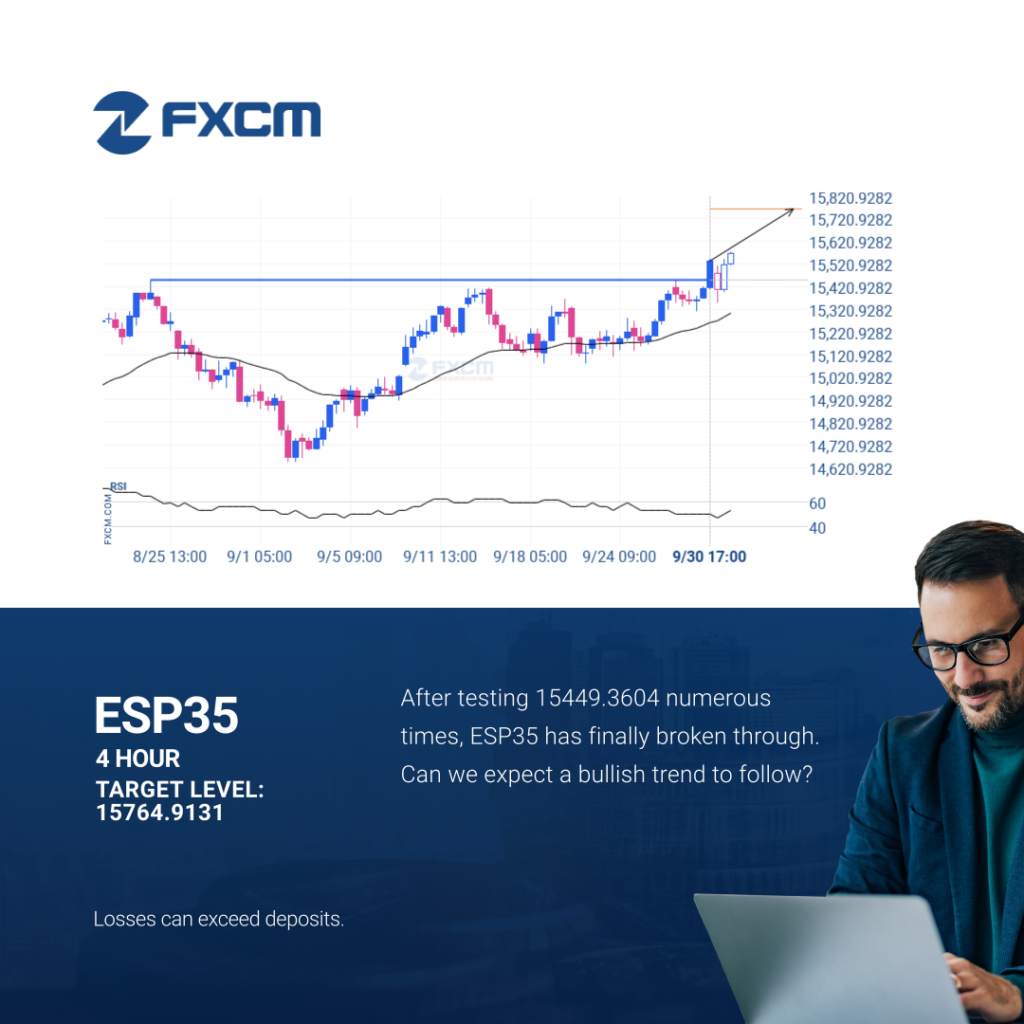
The breakout of ESP35 through the 15449.3604 price line is a breach of an important psychological price that is has tested numerous in the past. If this breakout persists, ESP35 could test 15764.9131 within the next 3 days. One should always be cautious before placing a trade, wait for confirmation of the breakout. Past performance […]
Posible ruptura del nivel de resistencia en el XAGUSD
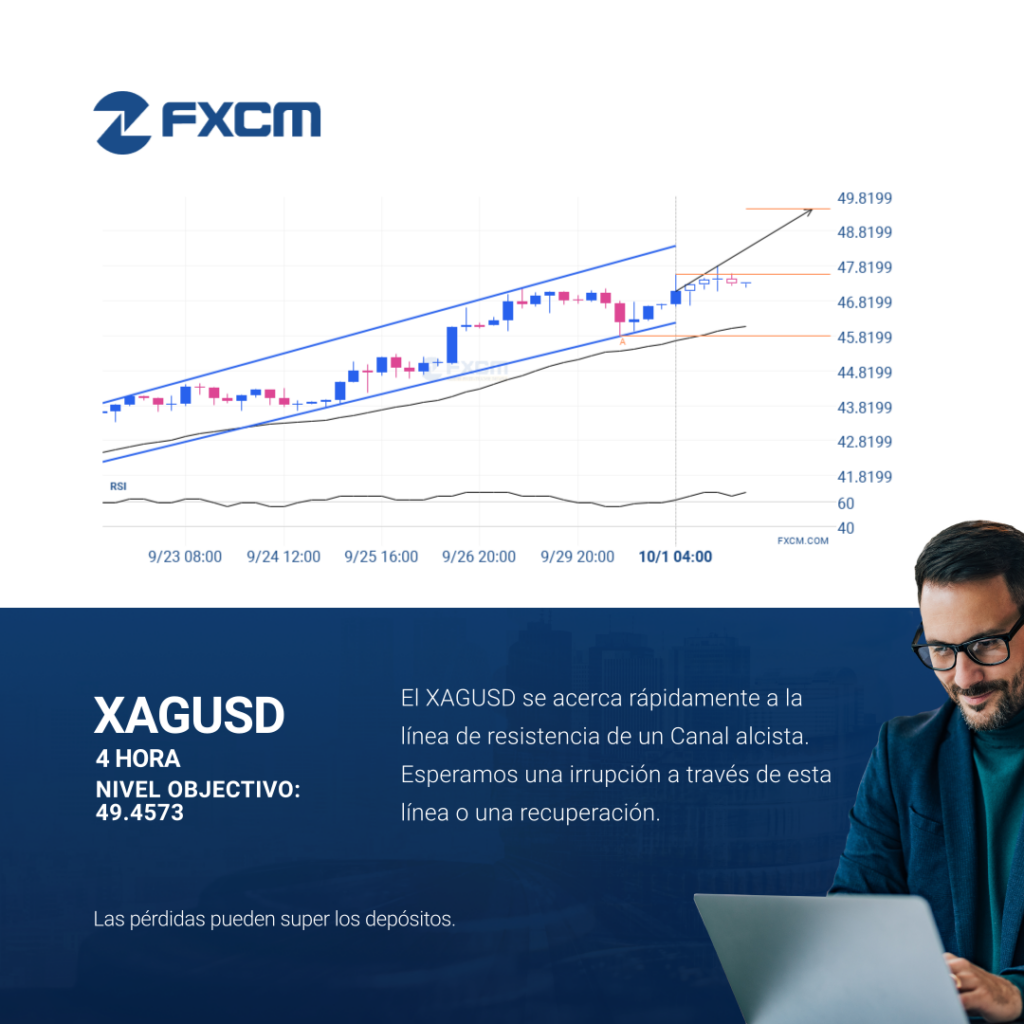
El patrón de Canal alcista emergente en su ola final se identificó en el gráfico de 4 Hora de XAGUSD. Después de un fuerte movimiento alcista, encontramos que XAGUSD se dirige hacia la línea del triángulo superior con una posible resistencia en 49.4573. Si resulta que el nivel de resistencia aguanta, el patrón de Canal […]
Possible breach of resistance level by XAGUSD
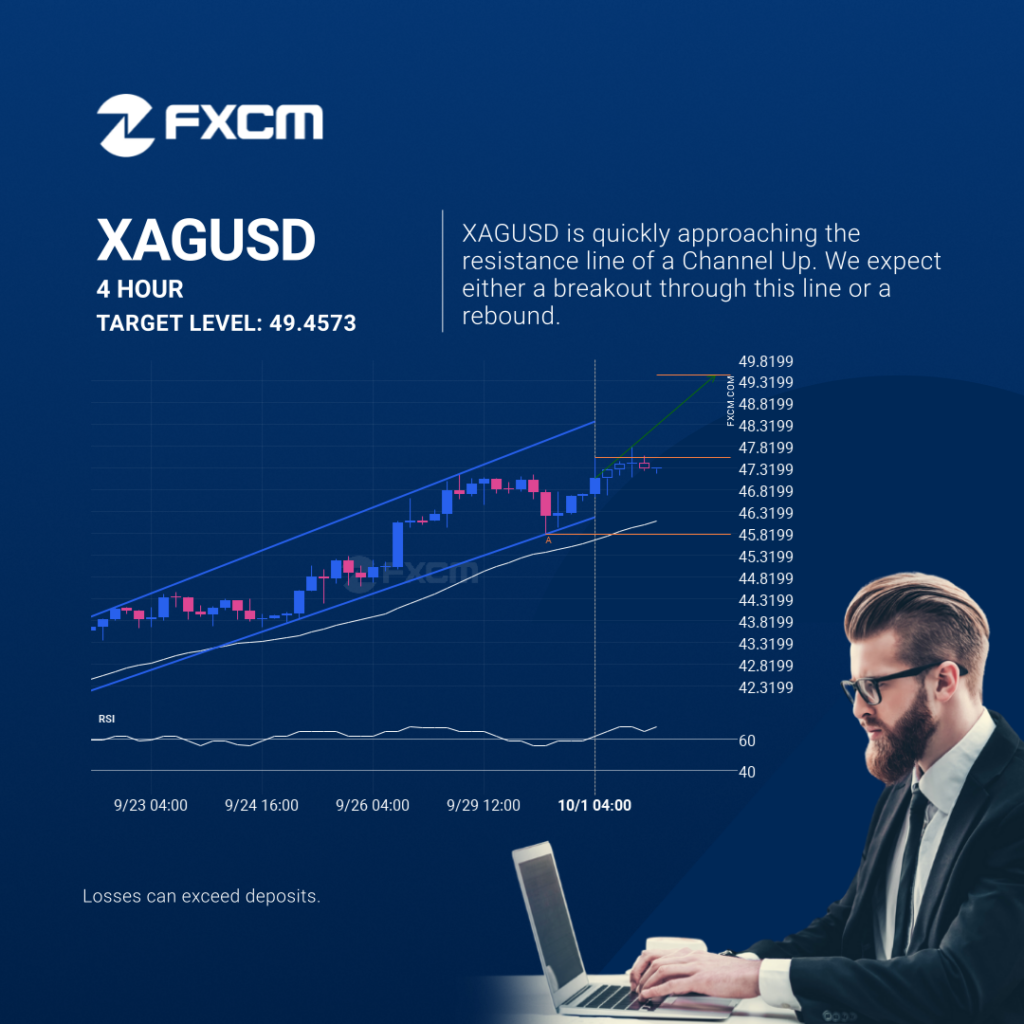
XAGUSD is trapped in a Channel Up formation, implying that a breakout is Imminent. This is a great trade-setup for both trend and swing traders. It is now approaching a support line that has been tested in the past. Divergence opportunists may be very optimistic about a possible breakout and this may be the start […]
BTCUSD experimentó un movimiento excepcionalmente grande.
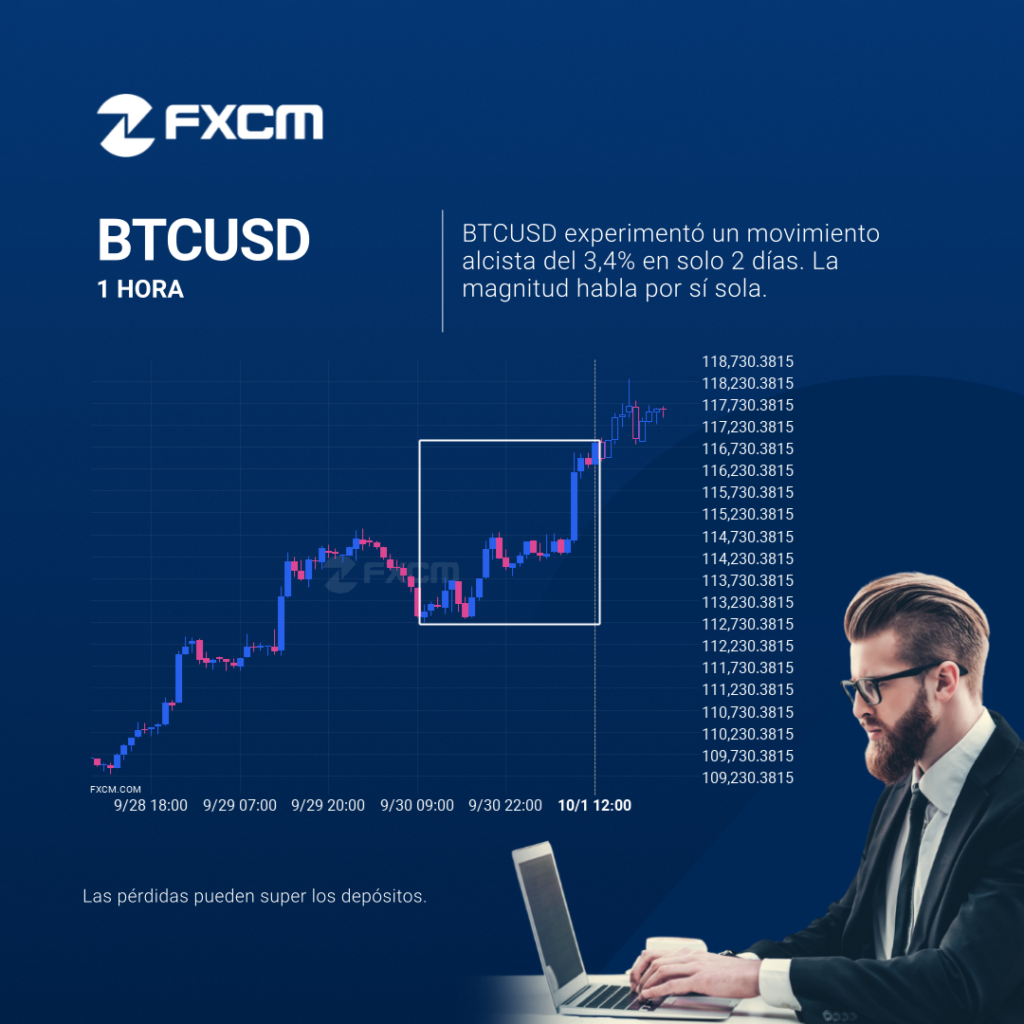
BTCUSD alcanzó los 116813.1 tras un movimiento del 3,4% en un período de 2 días. El rendimiento pasado no es indicativo de resultados futuros. Las pérdidas pueden exceder los fondos depositados.
EURJPY – Extreme movement, a rare opportunity
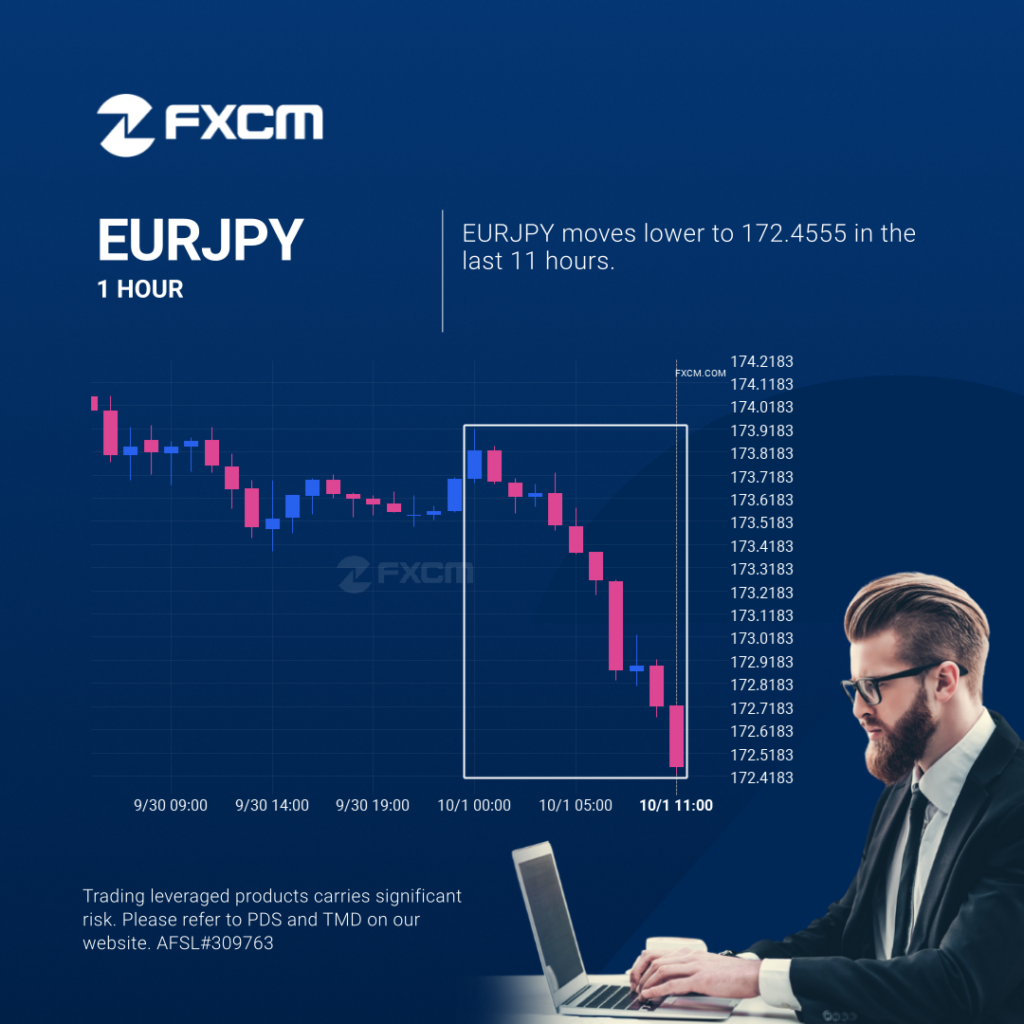
A movement of 0.79% over 11 hours on EURJPY doesn’t go unnoticed. You may start considering where it’s heading next, a continuation of the current downward trend, or a reversal in the previous direction. Past performance is not an indicator of future results. Trading leveraged products carries significant risk. Please refer to PDS and TMD […]
EURJPY – Movimiento extremo, una oportunidad poco común.

Un movimiento del 0,79% durante 11 horas en EURJPY no pasa desapercibido. Podrías empezar a considerar hacia dónde se dirige ahora: si continuará la tendencia bajista o si se revertirá el movimiento previo. El rendimiento pasado no es indicativo de resultados futuros. Las pérdidas pueden exceder los fondos depositados.
EURJPY – Extreme movement, a rare opportunity
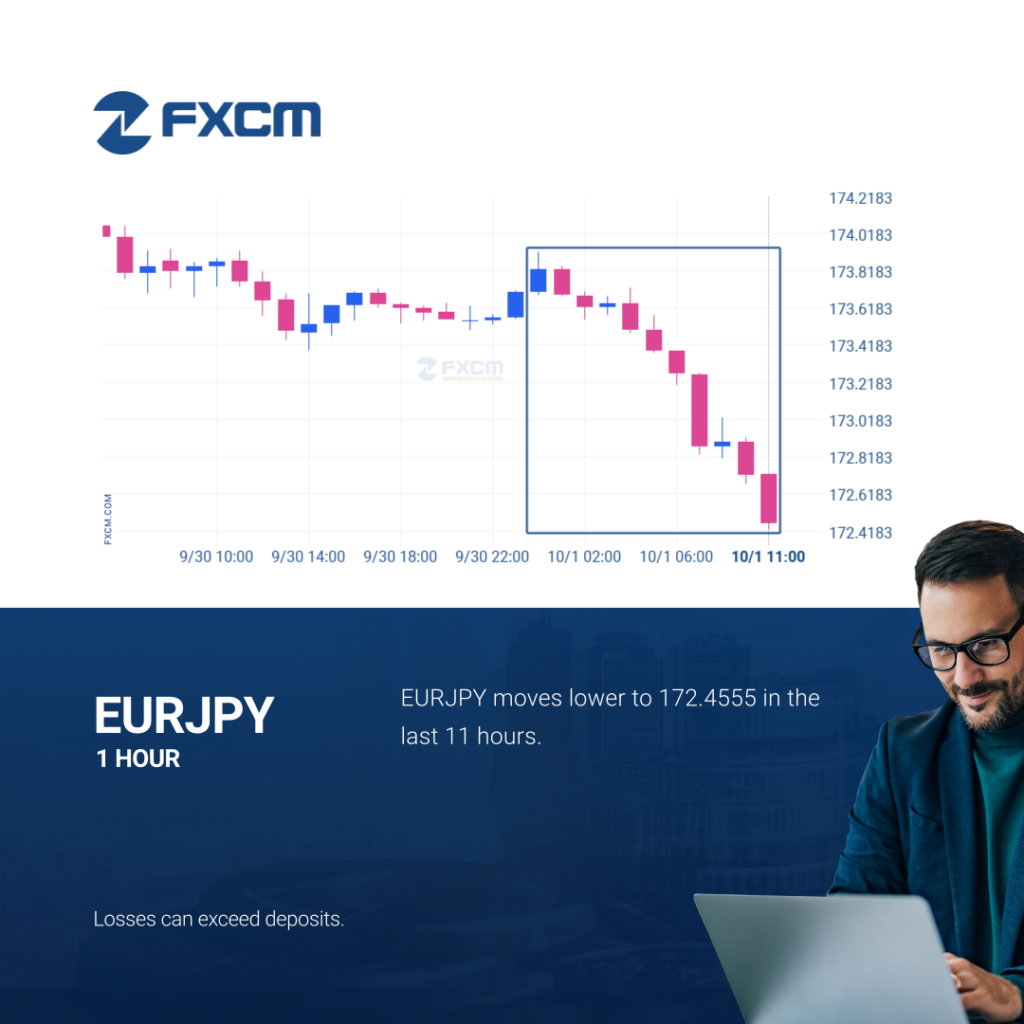
A movement of 0.79% over 11 hours on EURJPY doesn’t go unnoticed. You may start considering where it’s heading next, a continuation of the current downward trend, or a reversal in the previous direction. Past performance is not an indicator of future results. Losses can exceed deposits.
EURCHF running upward.
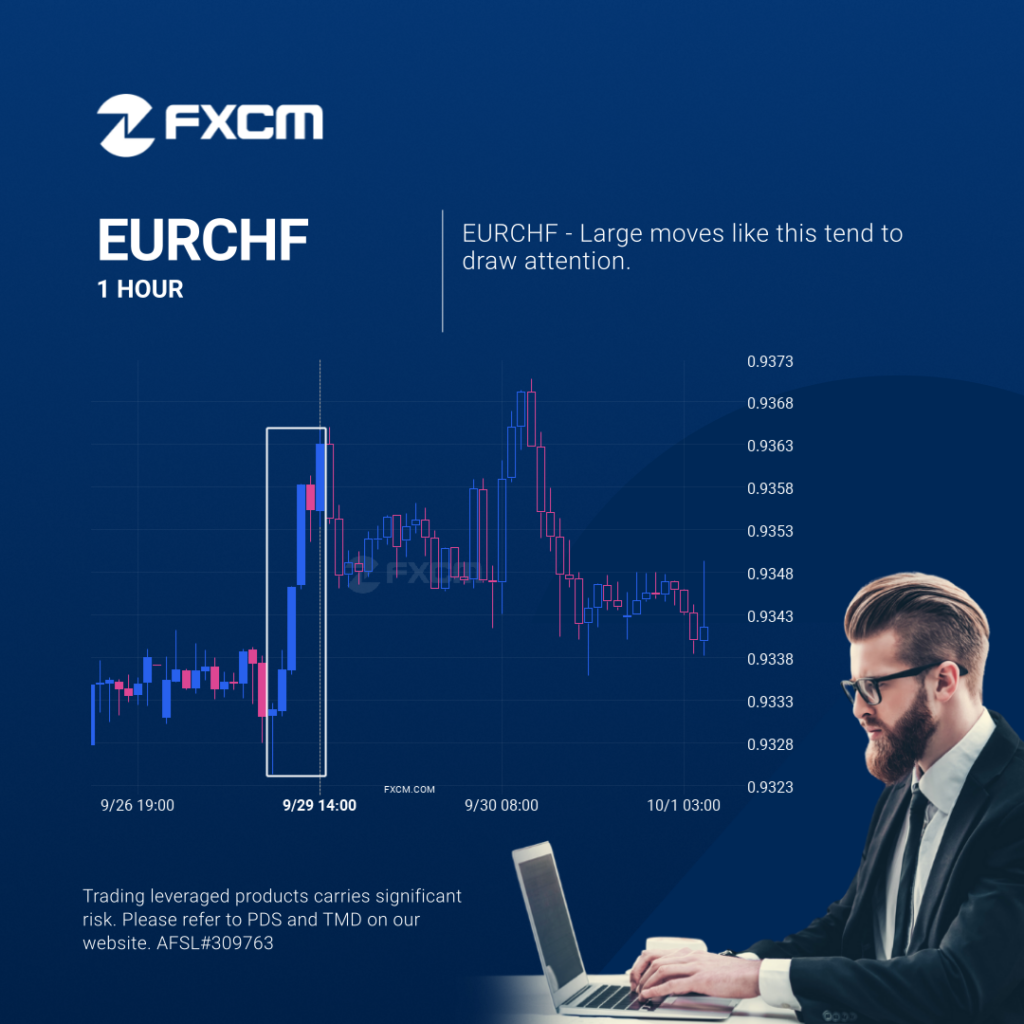
A movement of 0.33% over 6 hours on EURCHF doesn’t go unnoticed. You may start considering where it’s heading next, a continuation of the current upward trend, or a reversal in the previous direction. Past performance is not an indicator of future results. Trading leveraged products carries significant risk. Please refer to PDS and TMD […]