Movimiento extremo en EURJPY.
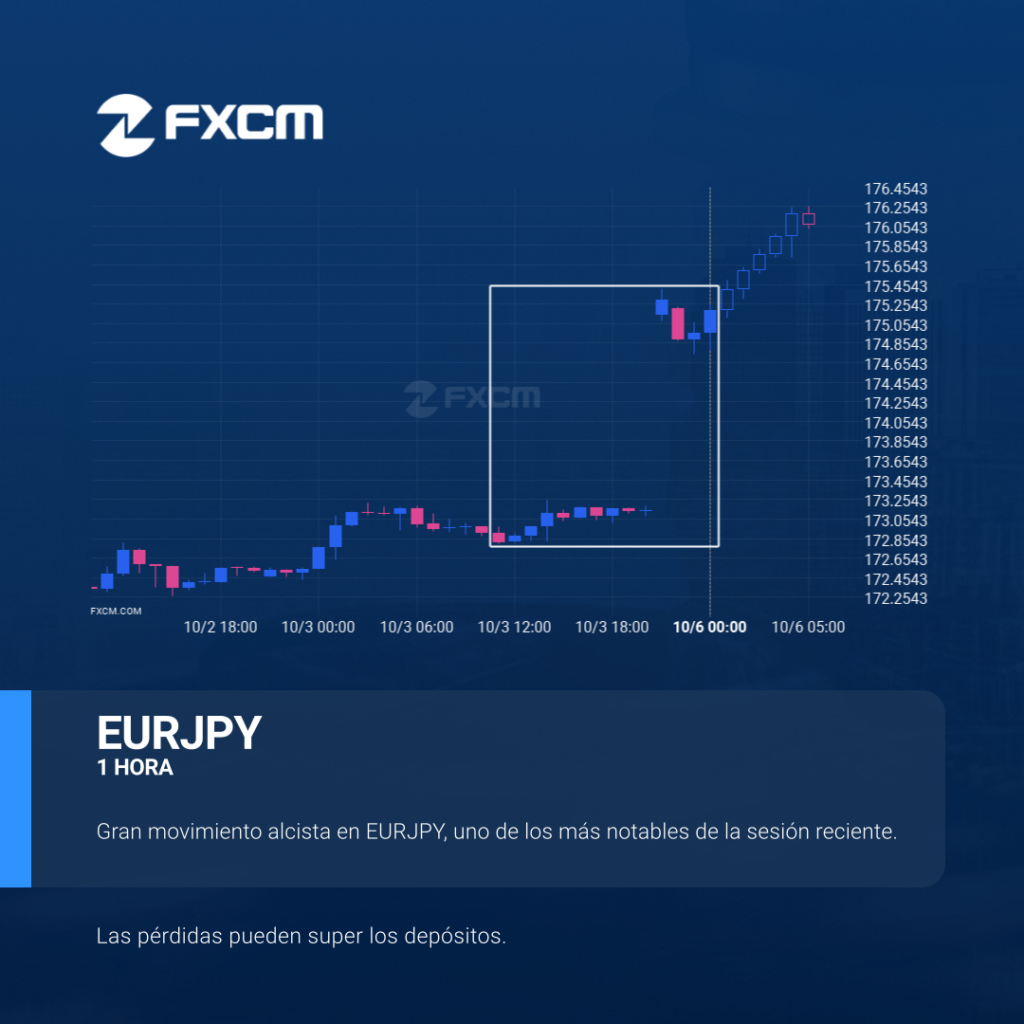
Se produjo un movimiento inesperado de gran magnitud en el gráfico 1 Hora de EURJPY, comenzando en 172.816 y alcanzando 175.1925. Destaca claramente en la actividad reciente. El rendimiento pasado no es indicativo de resultados futuros. Las pérdidas pueden exceder los fondos depositados.
Channel Up breakout on ESP35
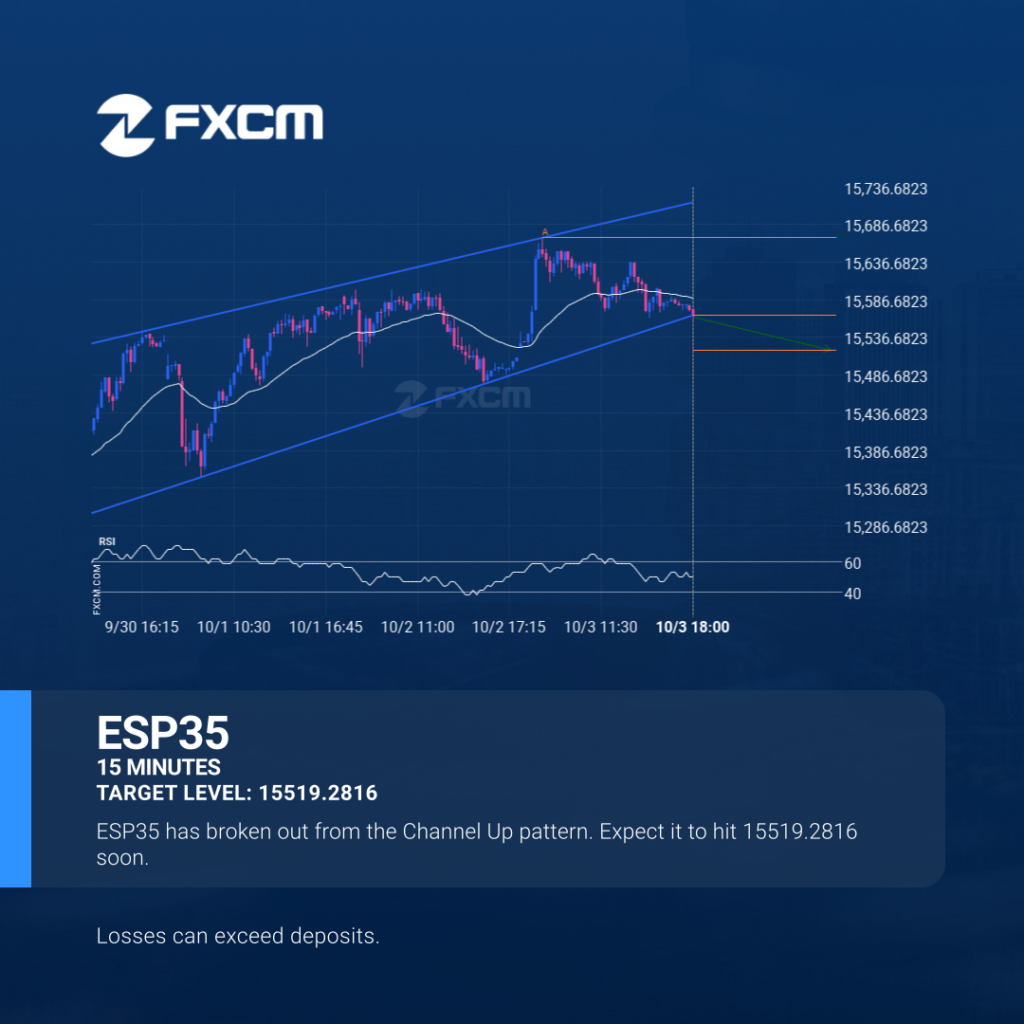
This trade setup on ESP35 is formed by a period of consolidation; a period in which the price primarily moves sideways before choosing a new direction for the longer term. Because of the bearish breakout through support, it seems to suggest that we could see the next price move to 15519.2816. Past performance is not […]
Channel Up breakout on ESP35
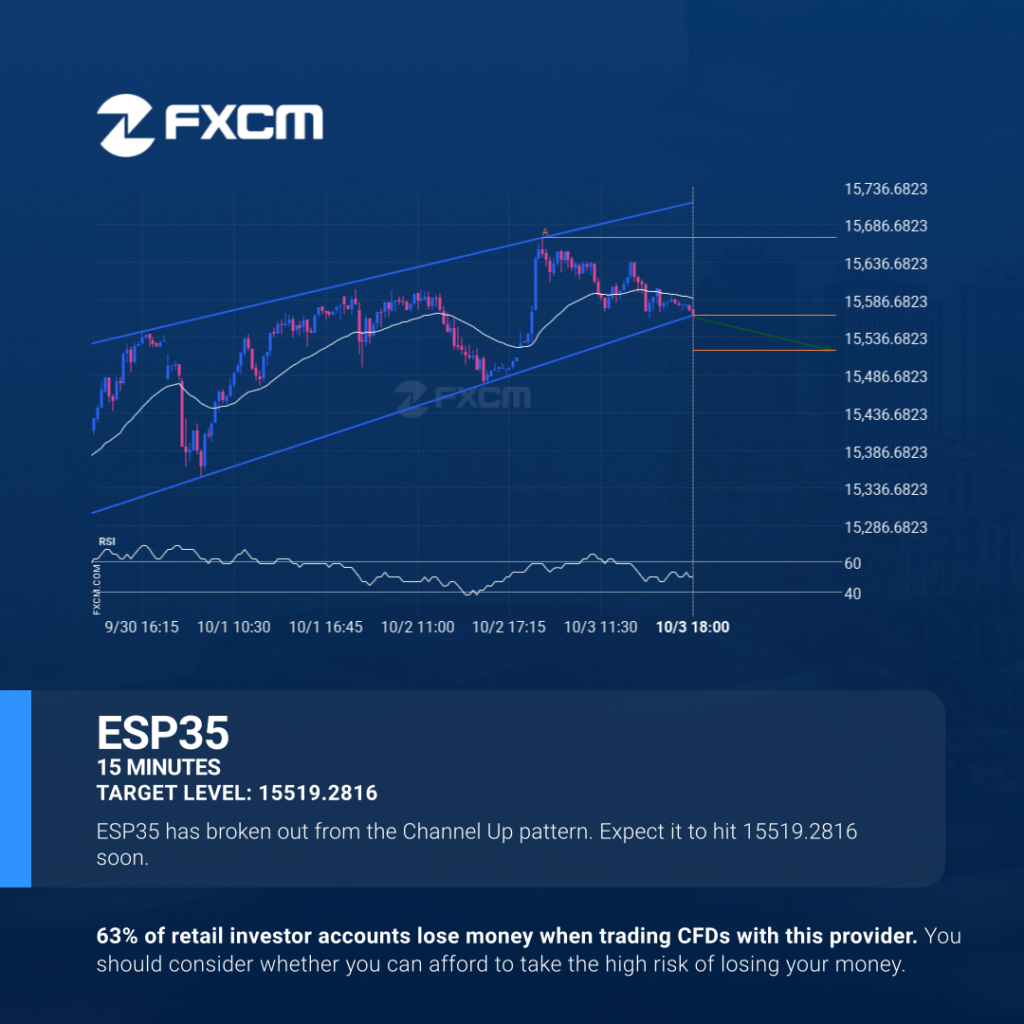
This trade setup on ESP35 is formed by a period of consolidation; a period in which the price primarily moves sideways before choosing a new direction for the longer term. Because of the bearish breakout through support, it seems to suggest that we could see the next price move to 15519.2816. Past performance is not […]
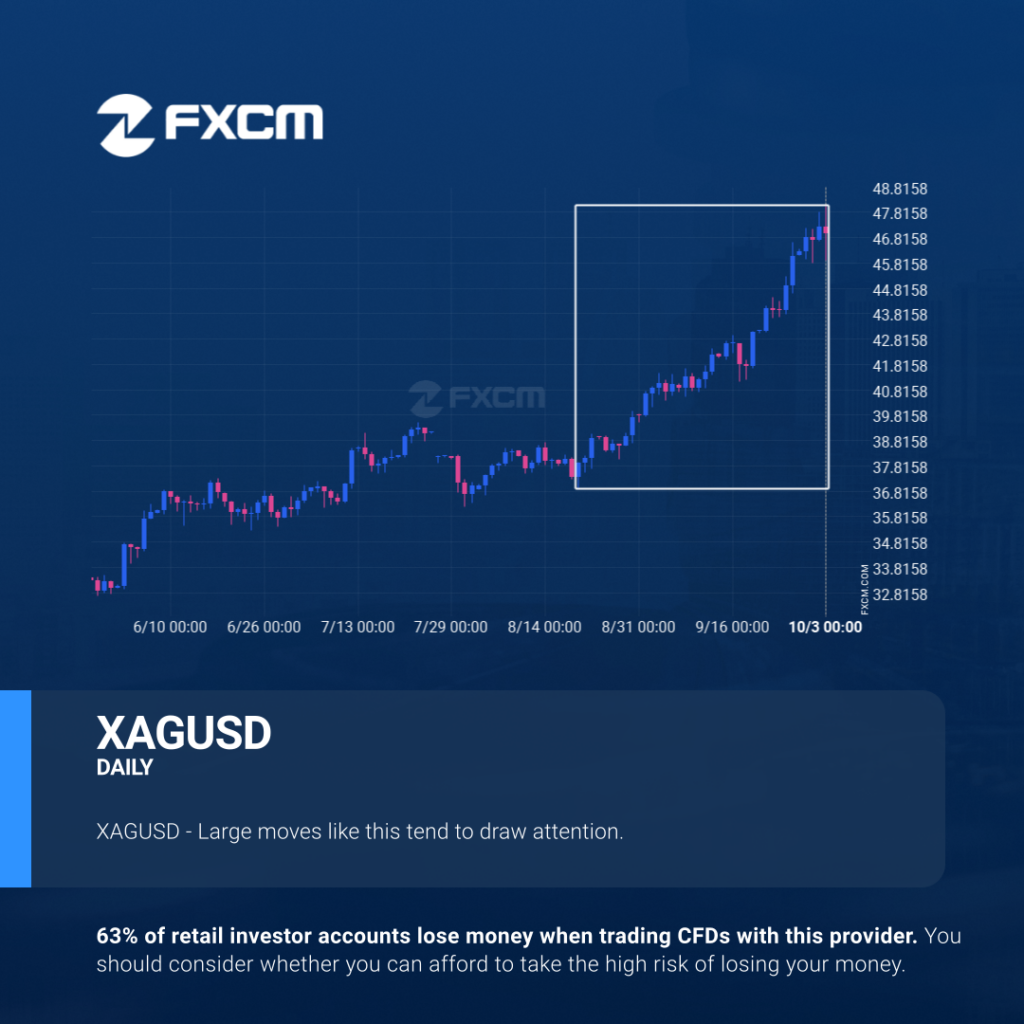
XAGUSD showing momentum.
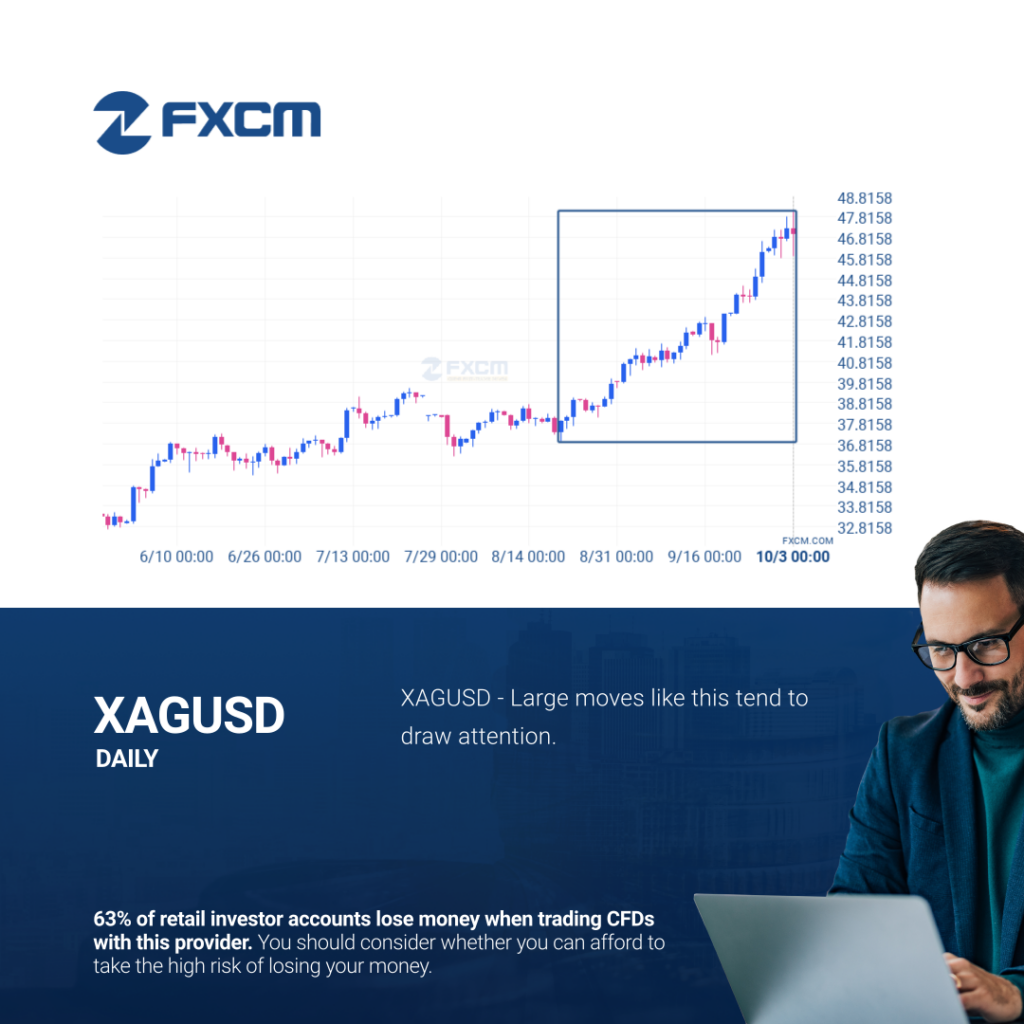
XAGUSD recorded a considerable move in the last 44 days — one of its biggest in recent sessions. Past performance is not an indicator of future results. Trading leveraged products carries significant risk. Please refer to PDS and TMD on our website. AFSL#309763
XAGUSD showing momentum.
XAGUSD recorded a considerable move in the last 44 days — one of its biggest in recent sessions. Past performance is not an indicator of future results. Trading leveraged products carries significant risk. Please refer to PDS and TMD on our website. AFSL#309763
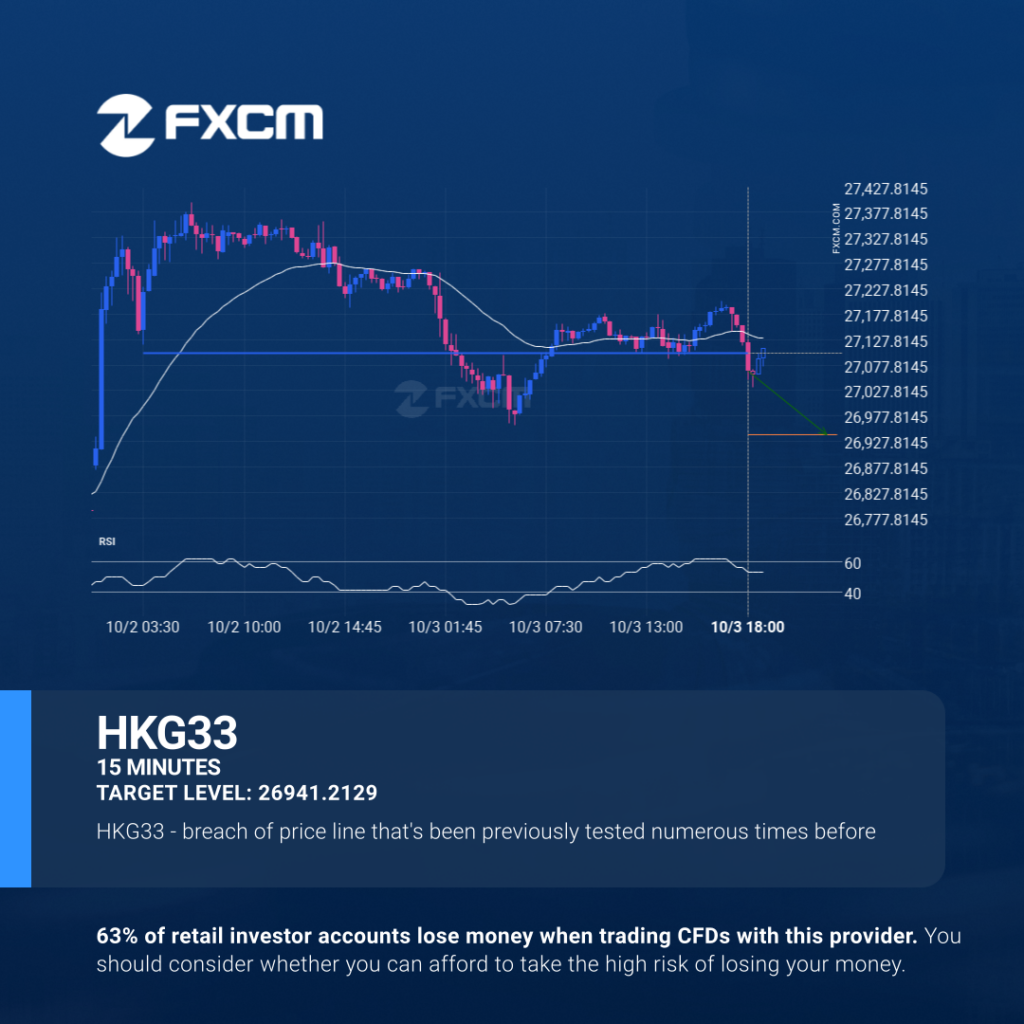
El HKG33 atravesó la importante línea de precio de 27101.3691

Se ha atravesado un fuerte nivel de soporte en 27101.3691 en el gráfico de 15 Minutos de HKG33. La teoría del análisis técnico pronostica un movimiento a 26941.2129 en el próximo período de 7 Horas. El rendimiento pasado no es indicativo de resultados futuros. Las pérdidas pueden exceder los fondos depositados.
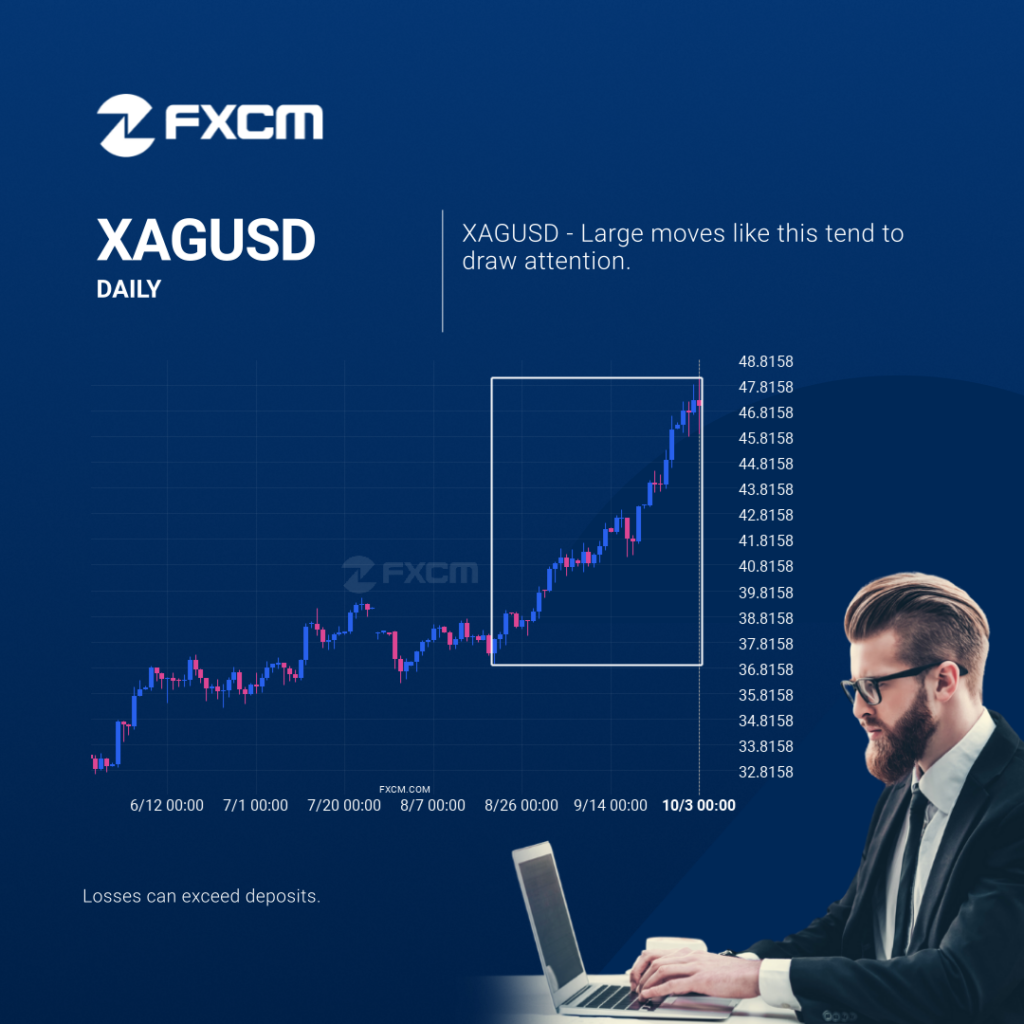
XAGUSD muestra impulso.

XAGUSD registró un movimiento considerable en los últimos 44 días, uno de los más grandes de las sesiones recientes. El rendimiento pasado no es indicativo de resultados futuros. Las pérdidas pueden exceder los fondos depositados.
XAGUSD showing momentum.
XAGUSD recorded a considerable move in the last 44 days — one of its biggest in recent sessions. Past performance is not an indicator of future results. Losses can exceed deposits.
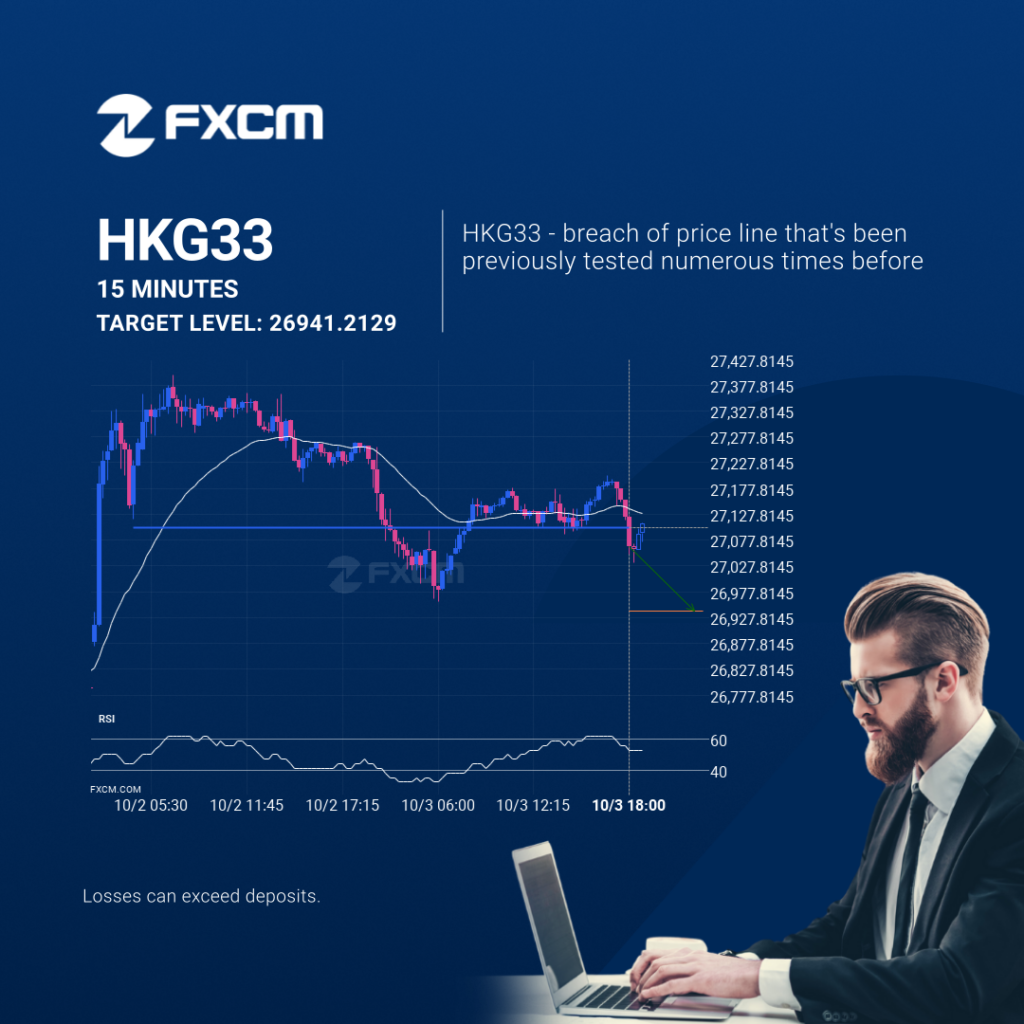
HKG33 broke through important 27101.3691 price line
A strong support level has been breached at 27101.3691 on the 15 Minutes HKG33 chart. Technical Analysis theory forecasts a movement to 26941.2129 in the next 7 hours. Past performance is not an indicator of future results. Trading leveraged products carries significant risk. Please refer to PDS and TMD on our website. AFSL#309763
HKG33 broke through important 27101.3691 price line
A strong support level has been breached at 27101.3691 on the 15 Minutes HKG33 chart. Technical Analysis theory forecasts a movement to 26941.2129 in the next 7 hours. Past performance is not an indicator of future results. Losses can exceed deposits.