GBPUSD experienced an exceptionally large movement
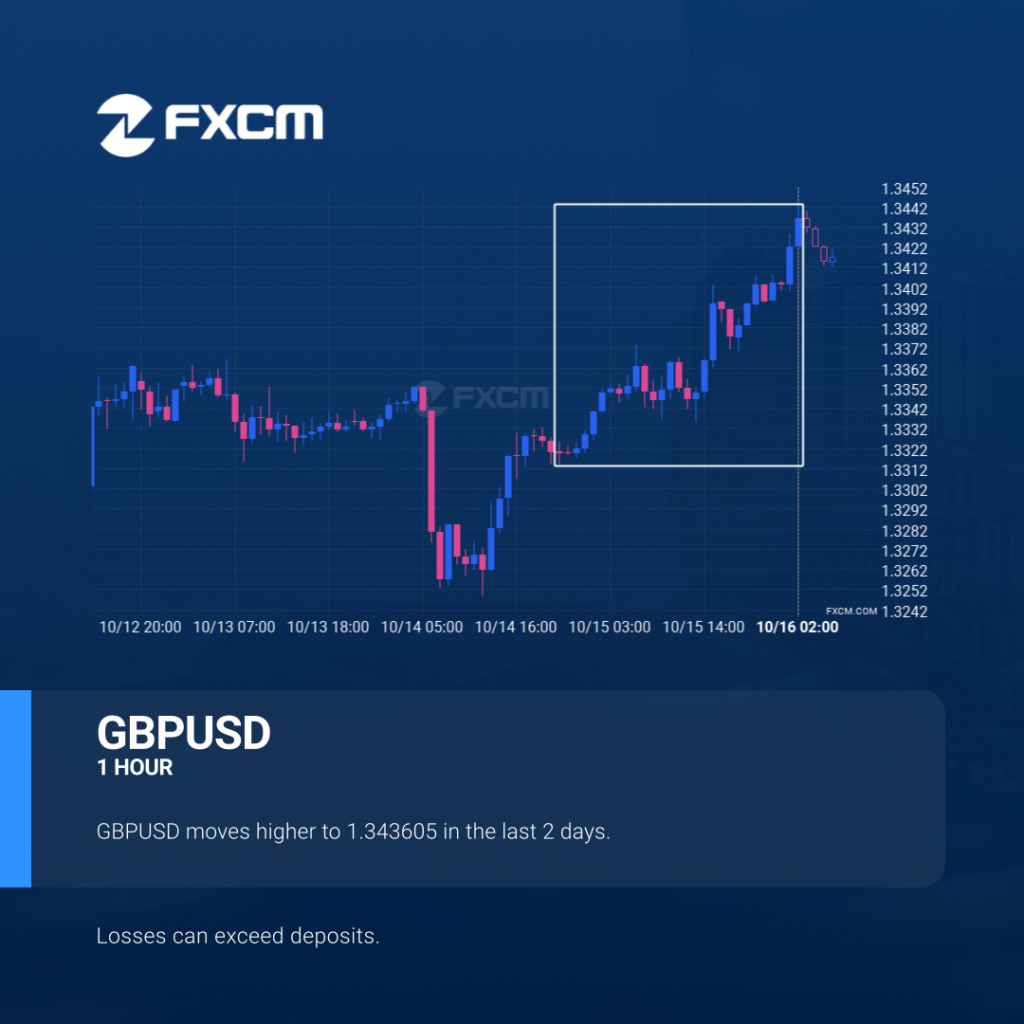
GBPUSD just posted a 0.88% move over the past 2 days – a move that won’t go unnoticed by any trading style. Past performance is not an indicator of future results. Losses can exceed deposits.
GBPUSD experienced an exceptionally large movement

GBPUSD just posted a 0.88% move over the past 2 days – a move that won’t go unnoticed by any trading style. Past performance is not an indicator of future results. Trading leveraged products carries significant risk. Please refer to PDS and TMD on our website. AFSL#309763
HKG33 short term bearish trade setup to 25648.5801

HKG33 is en route to a very important line that will be a definite deciding factor of what is to come! We may see this trajectory continue to touch and break through 25648.5801, unless it runs out of momentum and pulls back to current levels. Past performance is not an indicator of future results. Trading […]
GBPUSD experimentó un movimiento excepcionalmente grande.

GBPUSD acaba de registrar un movimiento del 0,88% en los últimos 2 días: un movimiento que no pasa desapercibido para ningún tipo de estrategia. El rendimiento pasado no es indicativo de resultados futuros. Las pérdidas pueden exceder los fondos depositados.
HKG33 short term bearish trade setup to 25648.5801

HKG33 is en route to a very important line that will be a definite deciding factor of what is to come! We may see this trajectory continue to touch and break through 25648.5801, unless it runs out of momentum and pulls back to current levels. Past performance is not an indicator of future results. Losses […]
HKG33: plan para operación bajista a corto plazo hasta 25648.5801

¡HKG33 está en camino a una línea muy importante que definitivamente será un factor decisivo de lo que está por venir! Es posible que veamos que esta trayectoria continúa tocando el nivel en 25648.5801 y lo acabe rompiendo, a menos que se quede sin impulso y vuelva a los niveles actuales. El rendimiento pasado no […]
A potential bullish movement on AUDUSD

AUDUSD is moving towards a line of 0.6527 which it has tested numerous times in the past. We have seen it retrace from this position in the past, so at this stage it isn’t clear whether it will breach this price or rebound as it did before. If AUDUSD continues in its current trajectory, we […]
Un posible movimiento alcista en AUDUSD

El AUDUSD avanza hacia la línea de 0.6527, que ya ha probado en numerosas ocasiones durante el pasado. Hemos observado un retroceso desde esta posición en el pasado, por lo que en esta fase no está claro si atravesará este precio o se recuperará como ya hizo antes. Si el AUDUSD continúa con esta trayectoria, […]
EURJPY approaching important bullish key level

EURJPY is heading towards 176.4530 and could reach this point within the next 2 days. It has tested this line numerous times in the past, and this time could be no different, ending in a rebound instead of a breakout. If the breakout doesn’t happen, we could see a retracement back down to current levels. […]
EURJPY acercándose a un importante nivel alcista clave

El EURJPY avanza hacia 176.4530 y podría alcanzar este punto en un plazo de 2 días. Ha probado esta línea previamente en numerosas ocasiones y esta vez no tiene porqué ser diferente, terminando con una recuperación en lugar de en una rotura. Si la rotura no ocurre, podríamos observar un retroceso de nuevo a los […]