EURCHF upward for 10 hours.

EURCHF rose sharply for 10 hours, marking an unusually large move, exceeding 98% of past price shifts for this instrument. Past performance is not an indicator of future results. Trading leveraged products carries significant risk. Please refer to PDS and TMD on our website. AFSL#309763
EURCHF upward for 10 hours.

EURCHF rose sharply for 10 hours, marking an unusually large move, exceeding 98% of past price shifts for this instrument. Past performance is not an indicator of future results. Losses can exceed deposits.
EURCHF se mueve al alza durante 10 Horas.

EURCHF subió bruscamente durante 10 Horas, marcando un movimiento inusualmente grande que supera el 98% de los cambios anteriores en este instrumento. El rendimiento pasado no es indicativo de resultados futuros. Las pérdidas pueden exceder los fondos depositados.
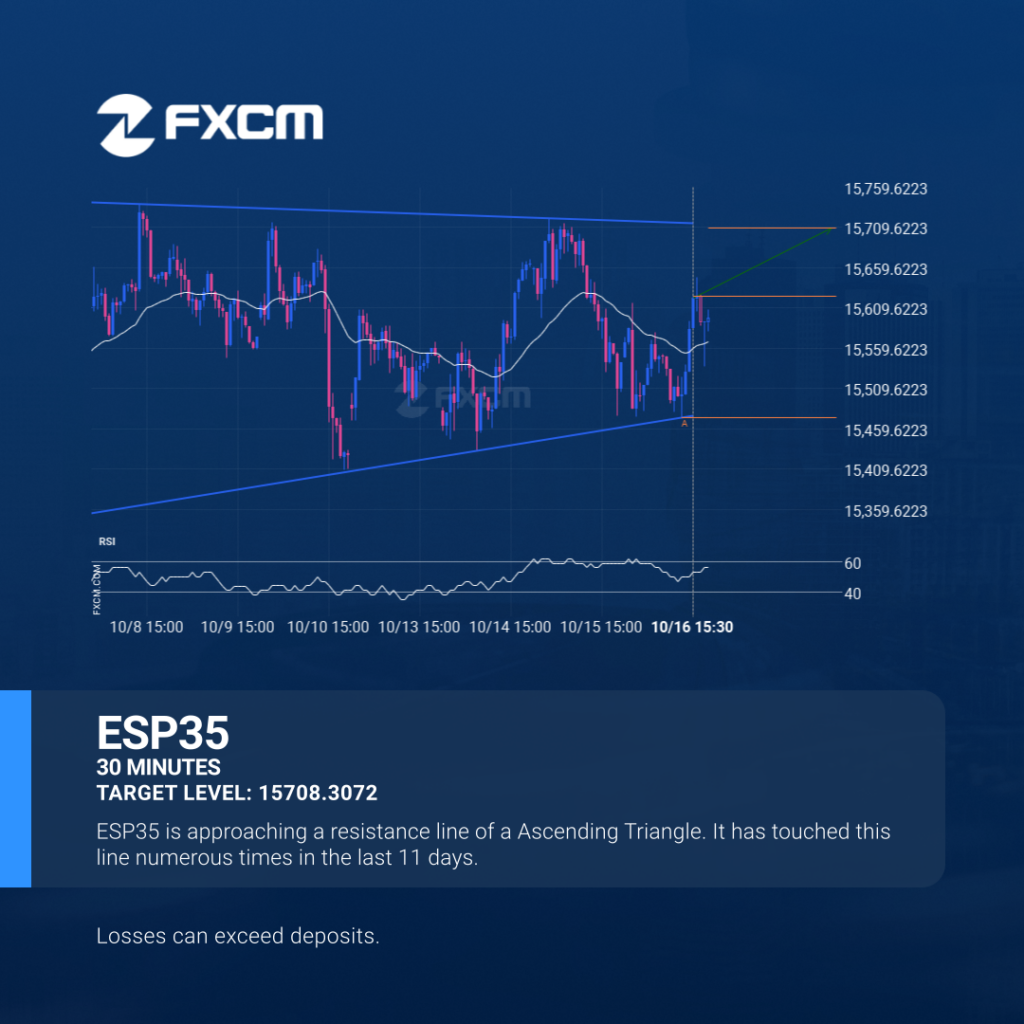
ESP35 – Continuation Chart Pattern – Ascending Triangle

ESP35 is approaching the resistance line of a Ascending Triangle. It has touched this line numerous times in the last 11 days. If it tests this line again, it should do so in the next 22 hours. Past performance is not an indicator of future results. Trading leveraged products carries significant risk. Please refer to […]
BTCUSD va en dirección descendente.

BTCUSD se ha movido a la baja un 4,43% desde 115858.66 hasta 110729.18 en los últimos 16 horas. El rendimiento pasado no es indicativo de resultados futuros. Las pérdidas pueden exceder los fondos depositados.
ESP35 – Continuation Patrón de gráfico – Triángulo ascendente

El ESP35 se está acercando a la línea de resistencia de un Triángulo ascendente. Ha llegado a esta línea en numerosas ocasiones durante los últimos 11 días. Si vuelve a probarla de nuevo, debería hacerlo en las próximas 22 horas. El rendimiento pasado no es indicativo de resultados futuros. Las pérdidas pueden exceder los fondos […]
ESP35 – Continuation Chart Pattern – Ascending Triangle
ESP35 is approaching the resistance line of a Ascending Triangle. It has touched this line numerous times in the last 11 days. If it tests this line again, it should do so in the next 22 hours. Past performance is not an indicator of future results. Losses can exceed deposits.
A potential bullish movement on EURUSD
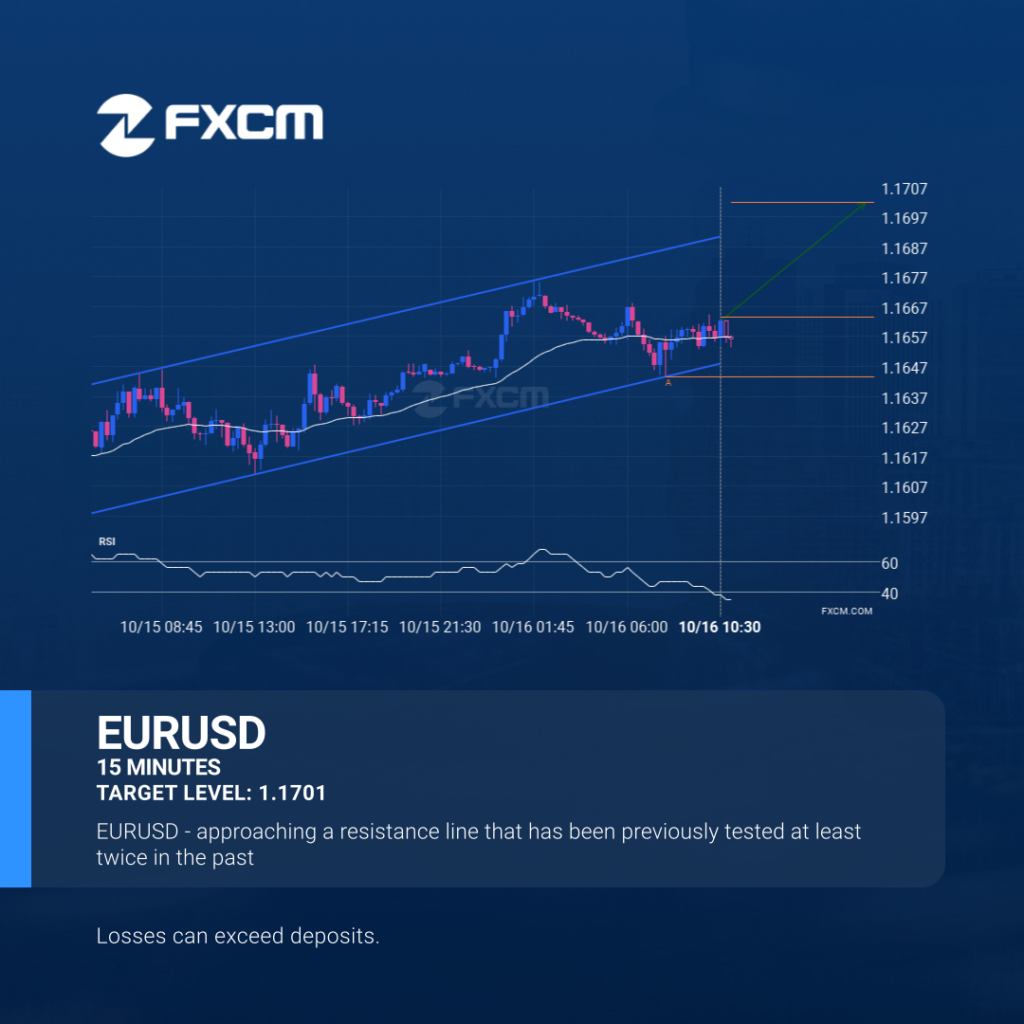
EURUSD is heading towards the resistance line of a Channel Up. If this movement continues, the price of EURUSD could test 1.1701 within the next 8 hours. It has tested this line numerous times in the past, so this movement could be short-lived and end up rebounding just like it did in the past. Past […]
A potential bullish movement on EURUSD
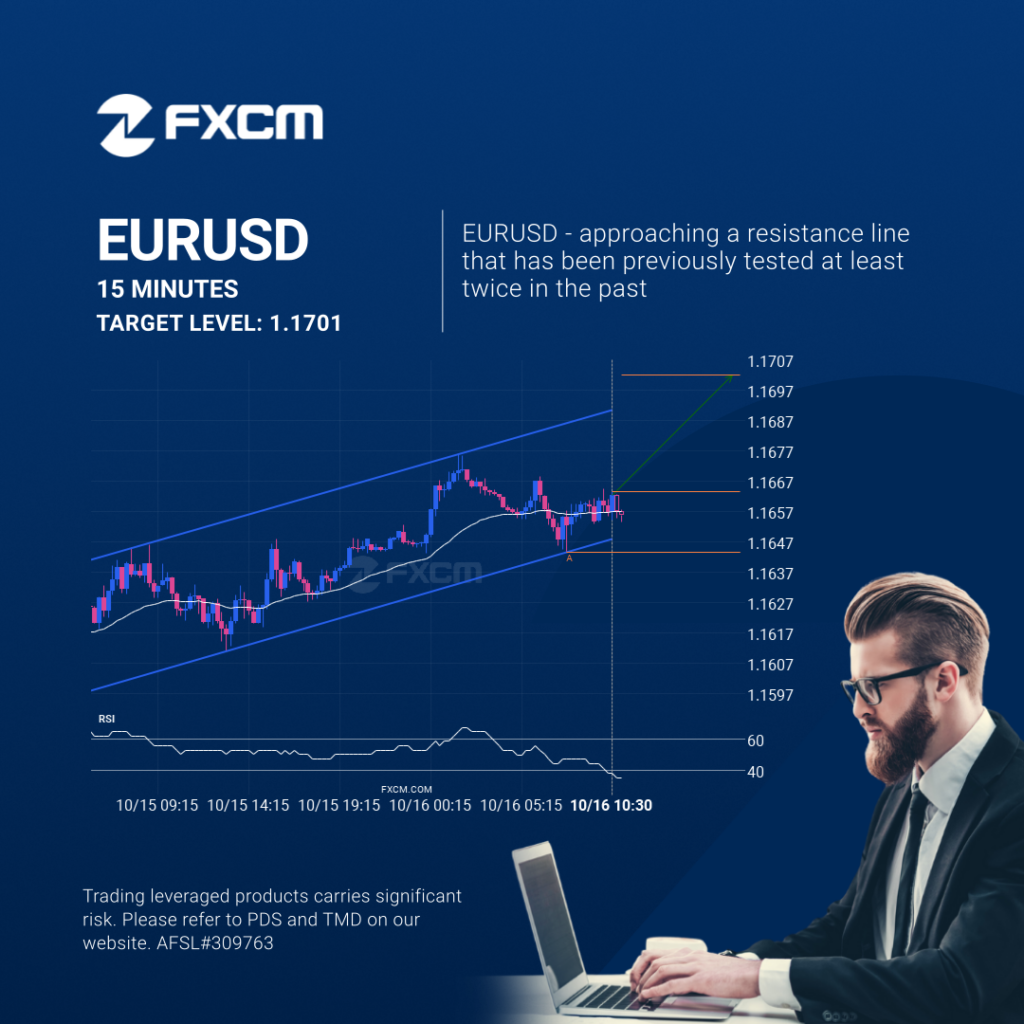
EURUSD is heading towards the resistance line of a Channel Up. If this movement continues, the price of EURUSD could test 1.1701 within the next 8 hours. It has tested this line numerous times in the past, so this movement could be short-lived and end up rebounding just like it did in the past. Past […]
Un posible movimiento alcista en EURUSD
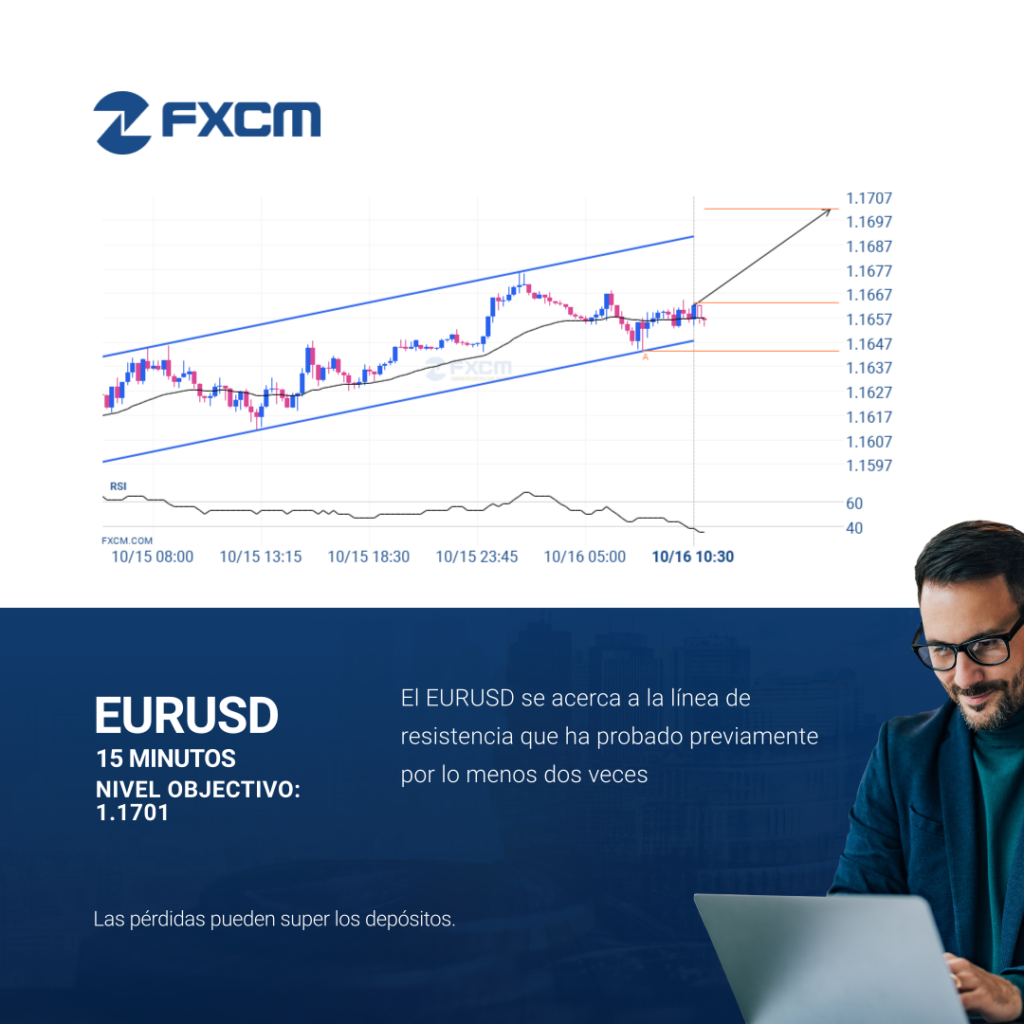
El EURUSD se dirige a la línea de resistencia de un Canal alcista. Si este movimiento se mantiene, el precio de EURUSD podría probar el nivel de 1.1701 en las próximas 8 horas. Ya ha probado esta línea en numerosas ocasiones, por lo que este movimiento podría durar poco y terminar recuperándose, igual que ha […]