A final push possible on HKG33

HKG33 is moving towards a key resistance level at 24581.1992. This is a previously tested level for HKG33. This could be a good trading opportunity, either at the spot price, or after breaching this level. Past performance is not an indicator of future results. Trading leveraged products carries significant risk. Please refer to PDS and […]
Inminente recuperación o irrupción del BTCUSD
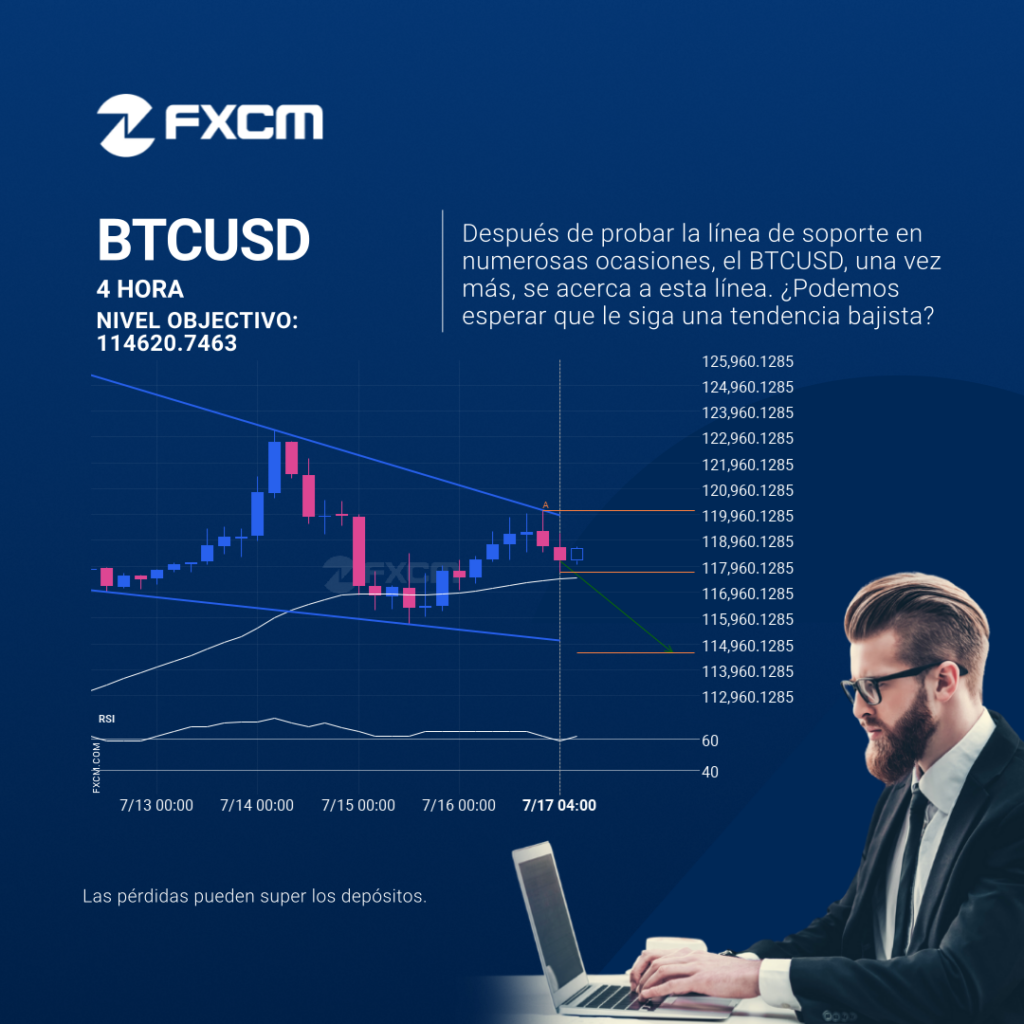
El BTCUSD avanza hacia una línea de soporte. Como le hemos visto retroceder desde esta línea anteriormente, podríamos presenciar, o bien, una ruptura a través de esta línea o una recuperación a los niveles actuales. Ha llegado a esta línea en numerosas ocasiones en los últimos 6 días y puede probarla de nuevo en las […]
Un posible impulso final en el HKG33
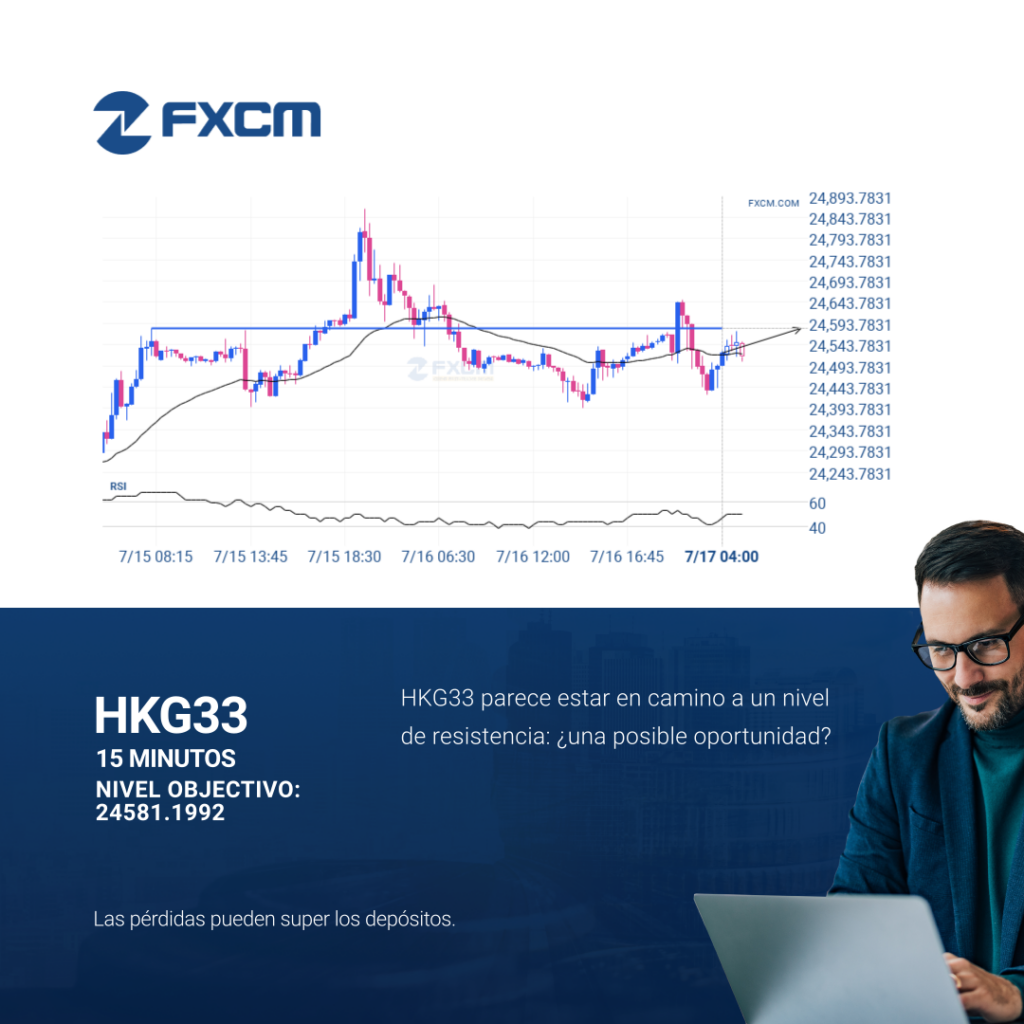
HKG33 se está moviendo hacia un nivel clave de resistencia en 24581.1992. Este es un nivel que HKG33 ya testeó previamente. Esta podría ser una buena oportunidad para operar, ya sea al precio actual o después de superar este nivel. El rendimiento pasado no es indicativo de resultados futuros. Las pérdidas pueden exceder los fondos […]
Will XAUUSD have enough momentum to break resistance?
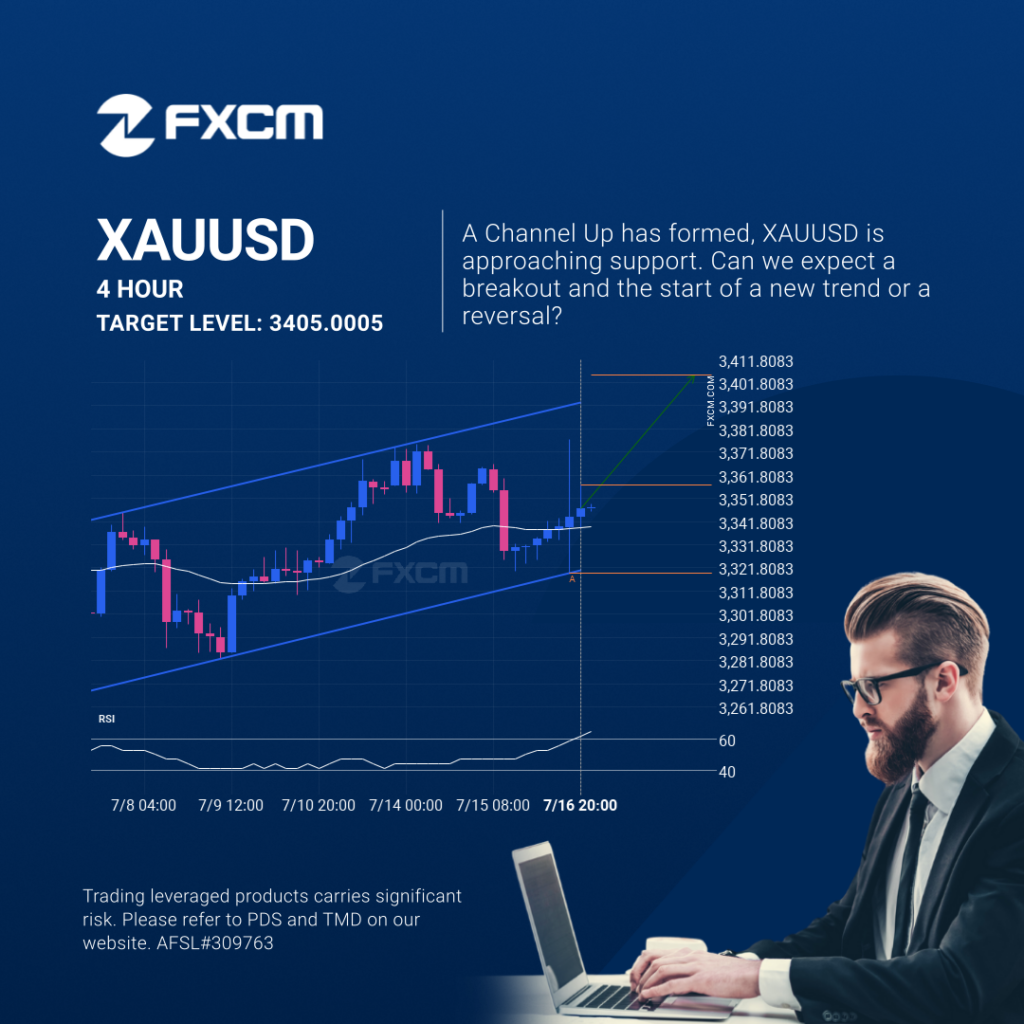
Emerging Channel Up pattern in its final wave was identified on the XAUUSD 4 hour chart. After a strong bullish run, we find XAUUSD heading towards the upper triangle line with a possible resistance at 3405.0005. If the resistance shows to hold, the Channel Up pattern suggests a rebound back towards current levels. Past performance […]
¿Tendrá el XAUUSD suficiente impulso como para irrumpir la resistencia?
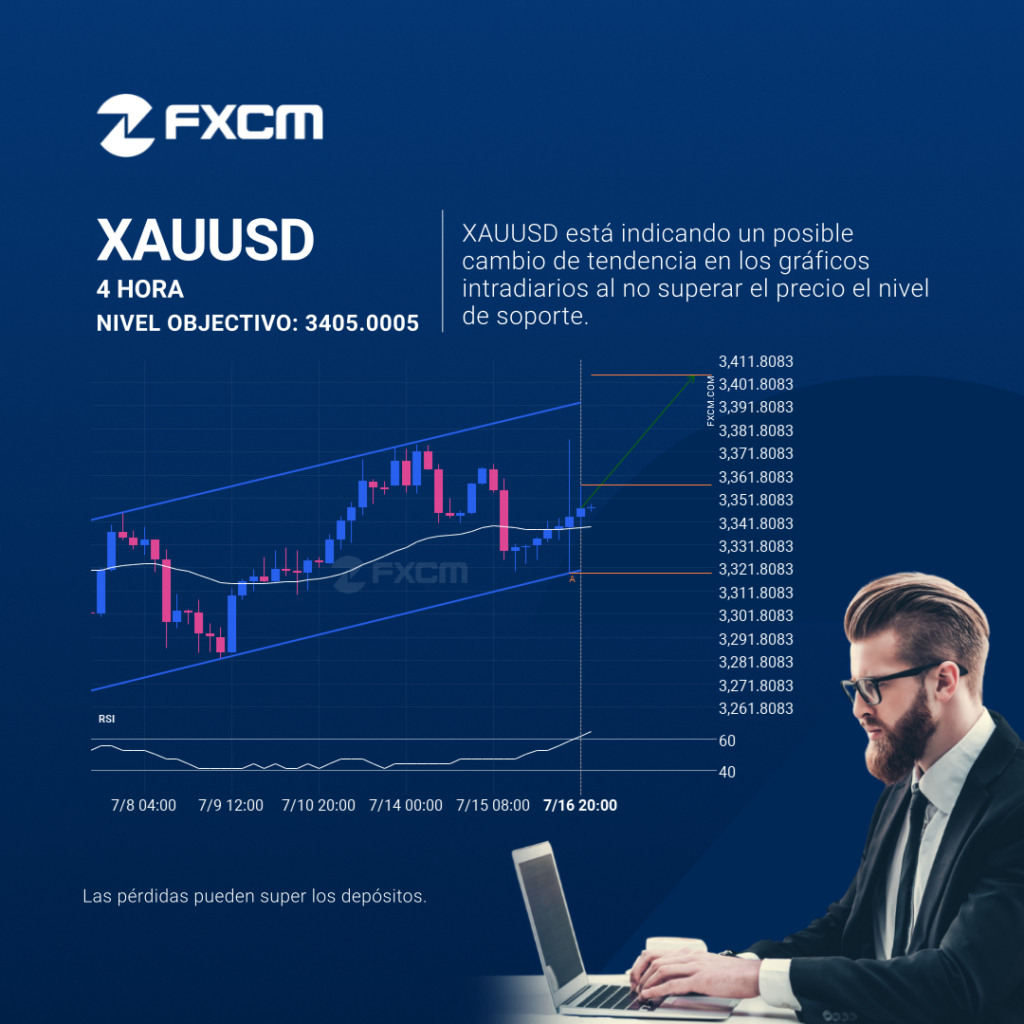
Se detectó un patrón de Canal alcista emergente en XAUUSD en el gráfico de 4 Hora. Hay un posible movimiento hacia 3405.0005 en las próximas velas. Una vez que alcance el nivel de soporte, puede continuar su movimiento alcista o retroceder a los niveles de precios actuales. El rendimiento pasado no es indicativo de resultados […]
Will XAUUSD have enough momentum to break resistance?

Emerging Channel Up pattern in its final wave was identified on the XAUUSD 4 hour chart. After a strong bullish run, we find XAUUSD heading towards the upper triangle line with a possible resistance at 3405.0005. If the resistance shows to hold, the Channel Up pattern suggests a rebound back towards current levels. Past performance […]
O bien, una inminente recuperación o una ruptura del ESP35
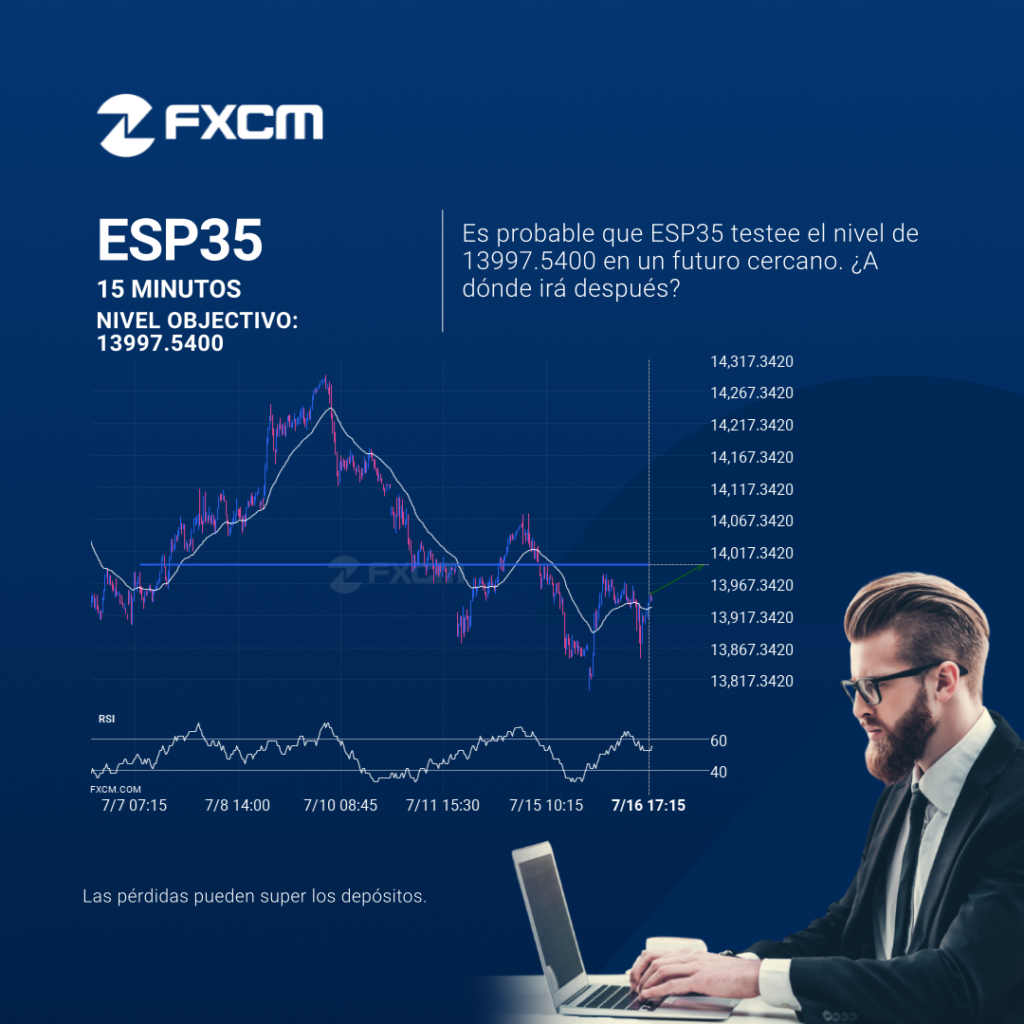
El ESP35 avanza hacia la línea de resistencia de un Resistencia. Como lo hemos observado retrocediendo desde este nivel en el pasado, podríamos observar, o bien una ruptura a través de esta línea o una recuperación de nuevo a los niveles actuales. Ya ha llegado a dicha línea en numerosas ocasiones durante los últimos 10 […]
Either a rebound or a breakout imminent on ESP35
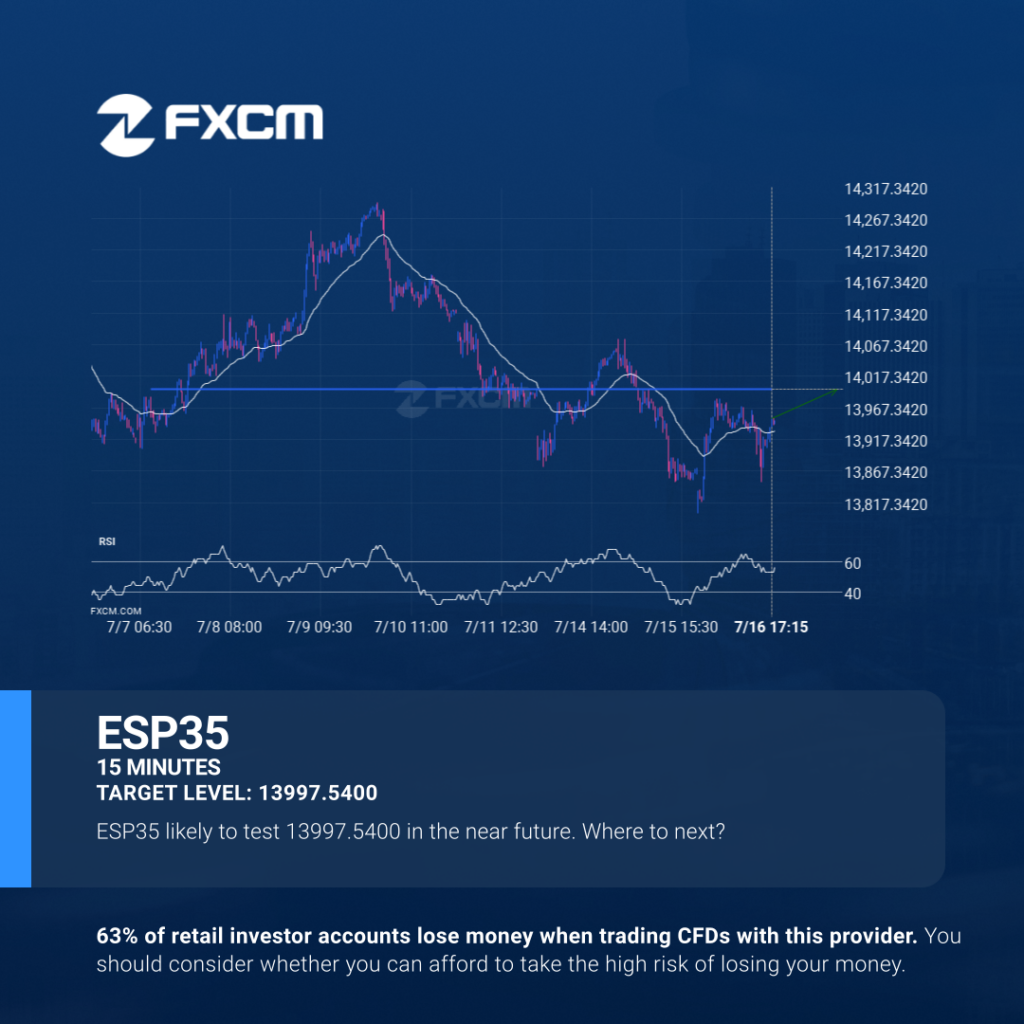
ESP35 is moving towards a resistance line. Because we have seen it retrace from this level in the past, we could see either a break through this line, or a rebound back to current levels. It has touched this line numerous times in the last 10 days and may test it again within the next […]
Either a rebound or a breakout imminent on ESP35
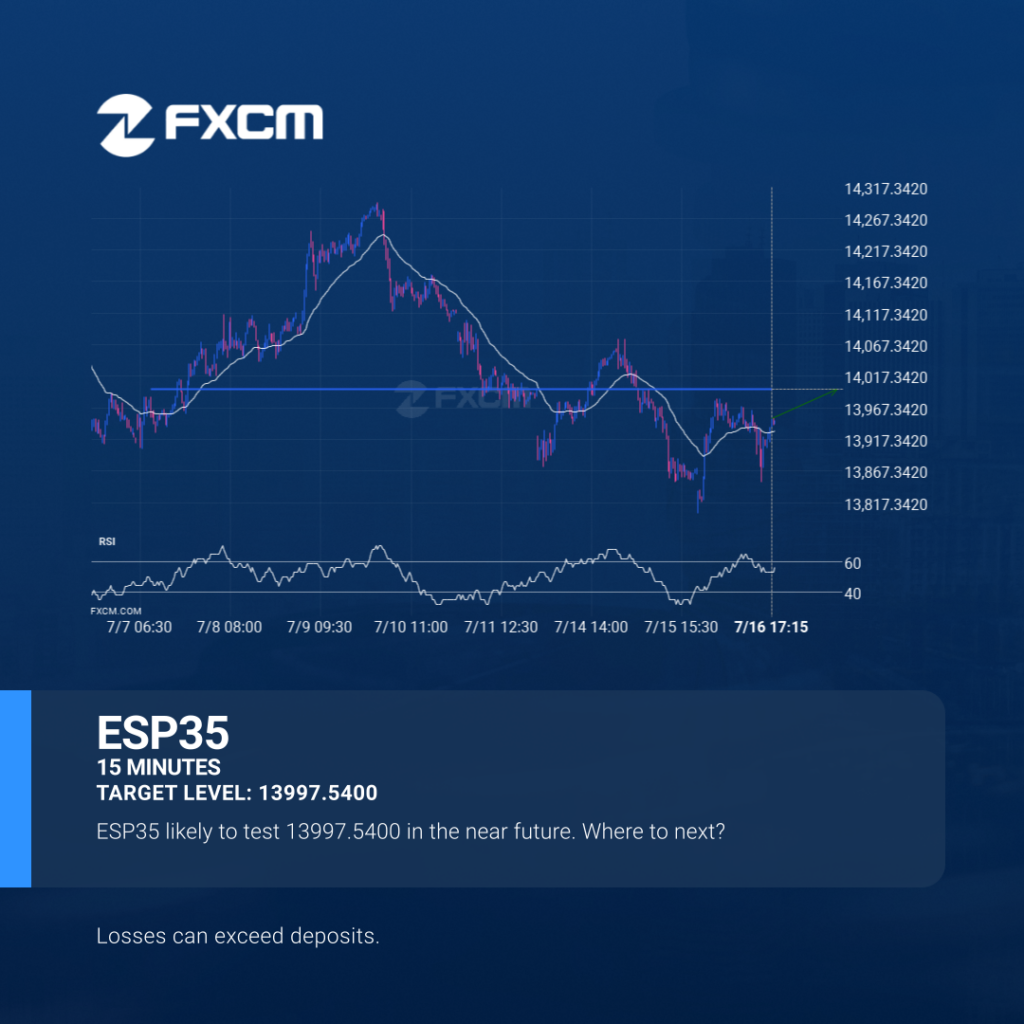
ESP35 is moving towards a resistance line. Because we have seen it retrace from this level in the past, we could see either a break through this line, or a rebound back to current levels. It has touched this line numerous times in the last 10 days and may test it again within the next […]
EURJPY approaching important level of 172.2270
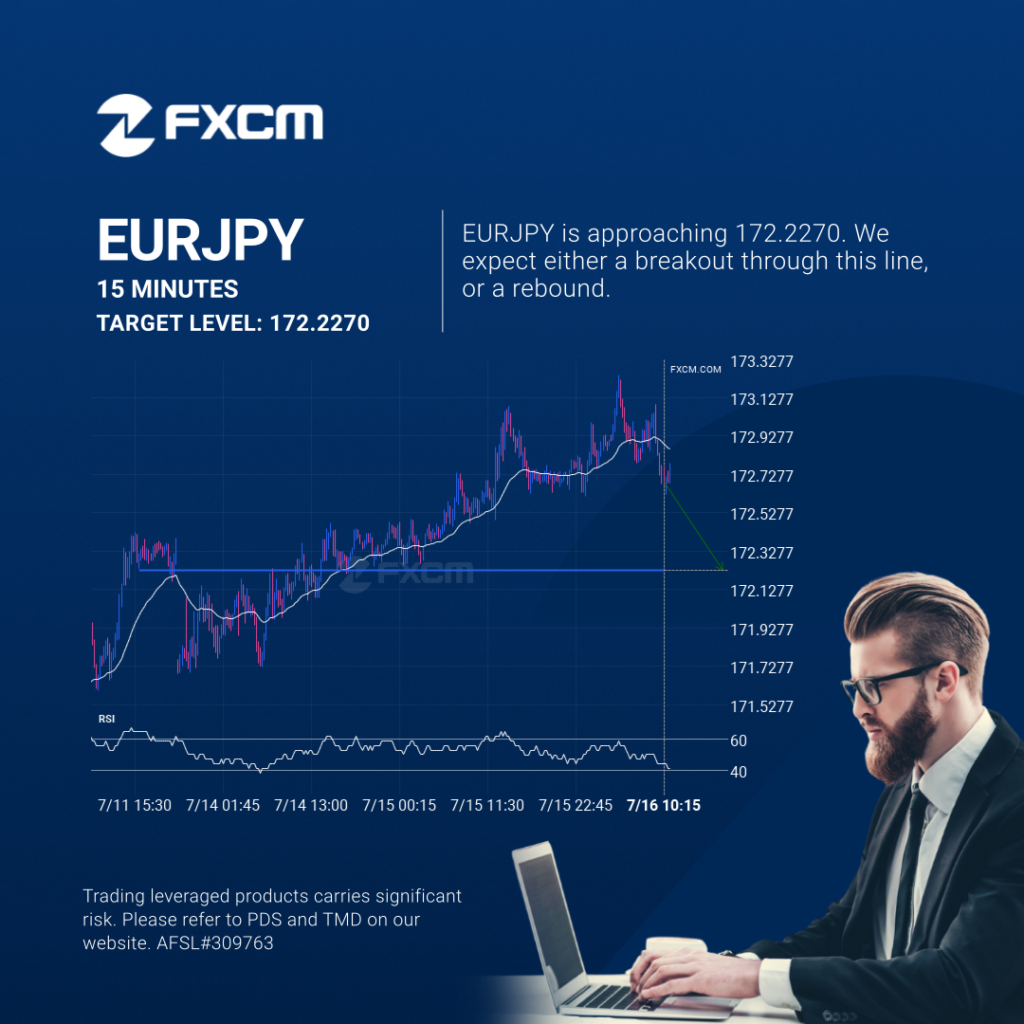
EURJPY is about to retest a key horizontal support level near 172.2270. It has tested this level 4 times in the recent past and could simply bounce off like it did last time. However, after this many tries, maybe it’s ready to start a new trend. Past performance is not an indicator of future results. […]