Inminente recuperación o irrupción del EURGBP
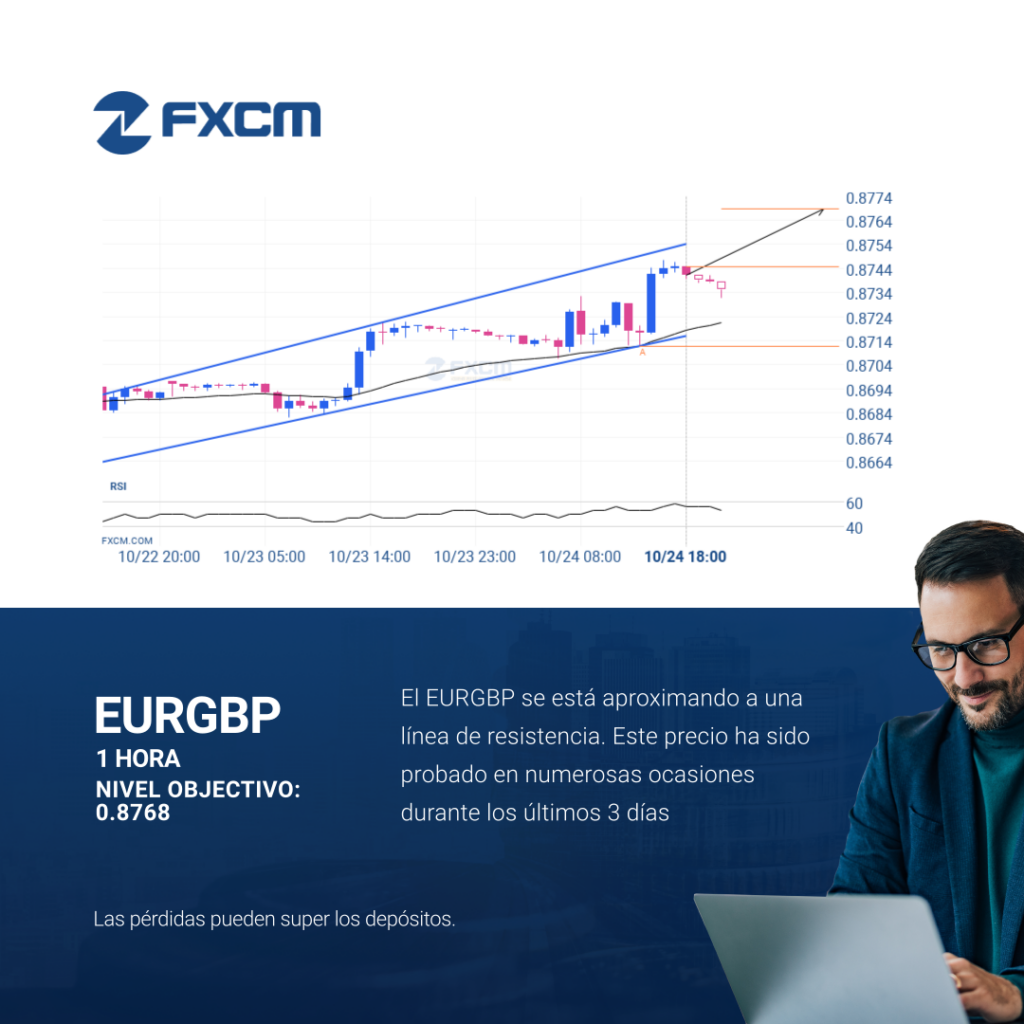
Se detectó un patrón de Canal alcista emergente en EURGBP en el gráfico de 1 Hora. Hay un posible movimiento hacia 0.8768 en las próximas velas. Una vez que alcance el nivel de soporte, puede continuar su movimiento alcista o retroceder a los niveles de precios actuales. El rendimiento pasado no es indicativo de resultados […]
Either a rebound or a breakout imminent on EURGBP

Emerging Channel Up pattern in its final wave was identified on the EURGBP 1 hour chart. After a strong bullish run, we find EURGBP heading towards the upper triangle line with a possible resistance at 0.8768. If the resistance shows to hold, the Channel Up pattern suggests a rebound back towards current levels. Past performance […]
Possible breach of resistance level by ESP35
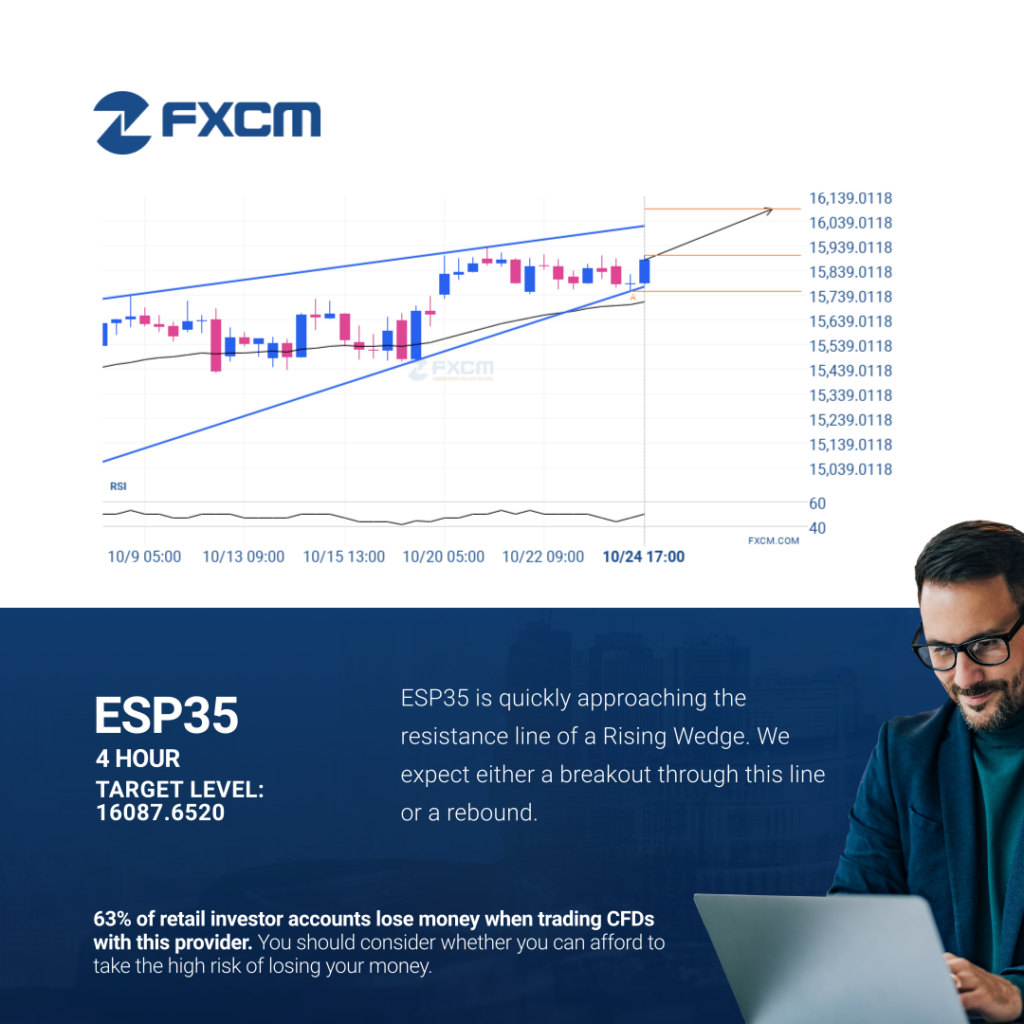
Emerging Rising Wedge detected on ESP35 – the pattern is an emerging one and has not yet broken through support, but the price is expected to move up over the next few hours. The price at the time the pattern was found was 15900.73 and it is expected to move to 16087.6520. Past performance is […]
Posible ruptura del nivel de resistencia en el ESP35
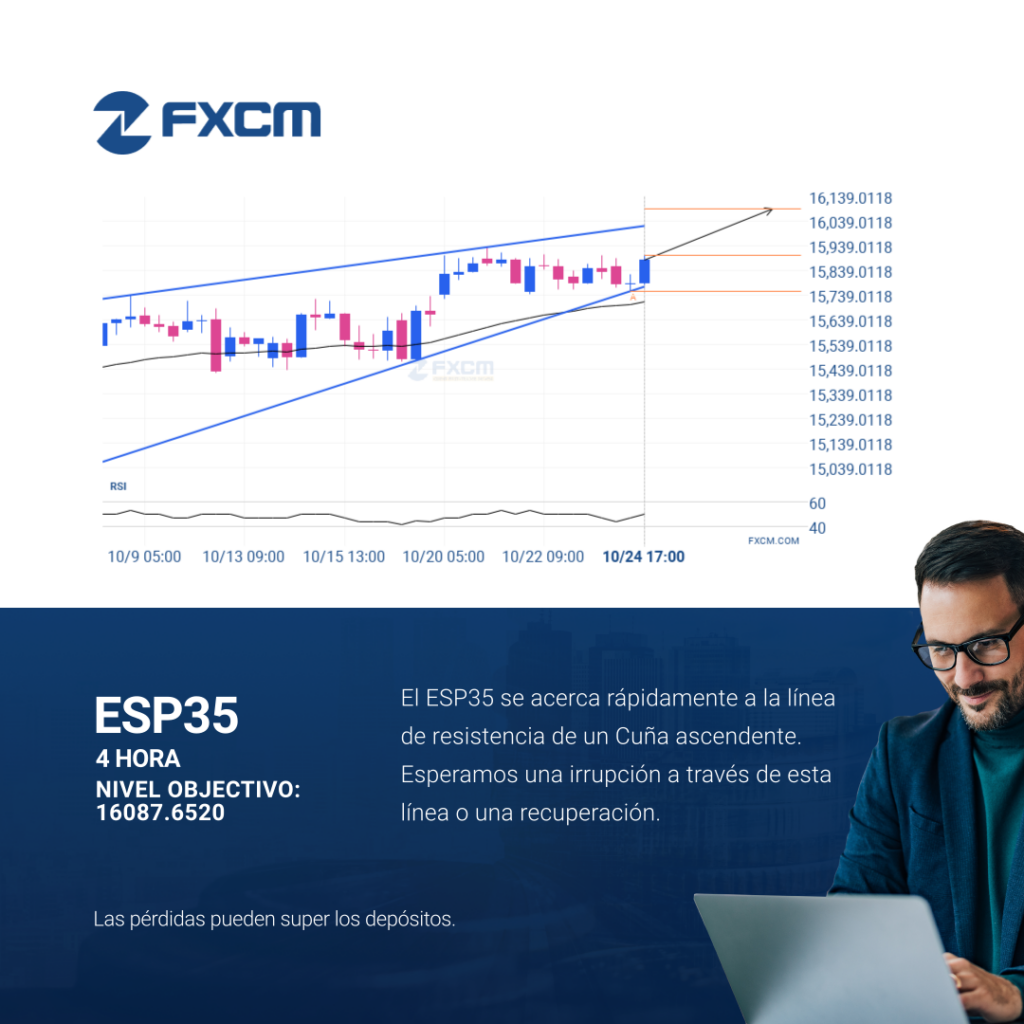
ESP35 se identificó alrededor de 15900.73 después de haber rebotado recientemente en un nivel de soporte en el intervalo temporal de 4 Hora. En última instancia, la acción del precio del activo ha formado un patrón de Cuña ascendente. Esta presión puede aumentar las posibilidades de una fuerte rotura. El movimiento proyectado potencialmente llevará el […]
Possible breach of resistance level by ESP35
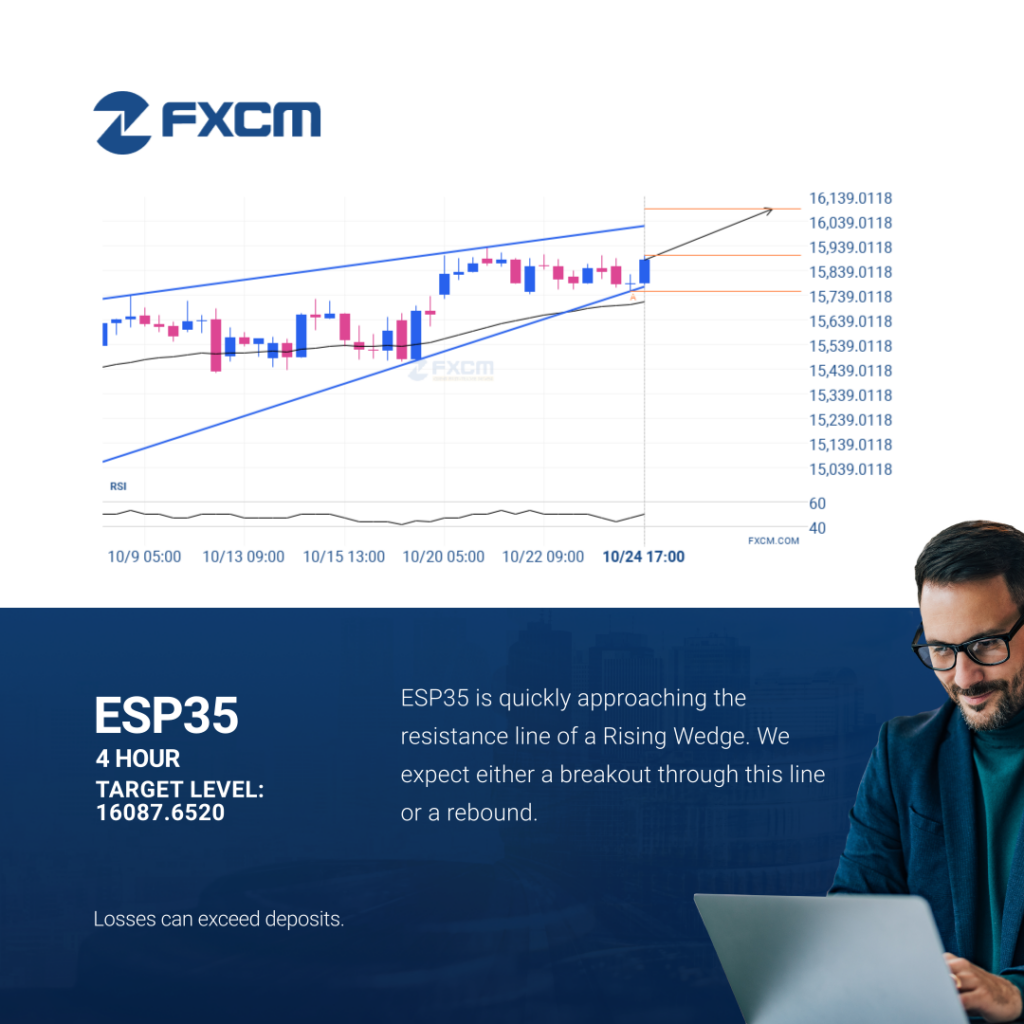
Emerging Rising Wedge detected on ESP35 – the pattern is an emerging one and has not yet broken through support, but the price is expected to move up over the next few hours. The price at the time the pattern was found was 15900.73 and it is expected to move to 16087.6520. Past performance is […]
A potential bearish movement on AUDUSD
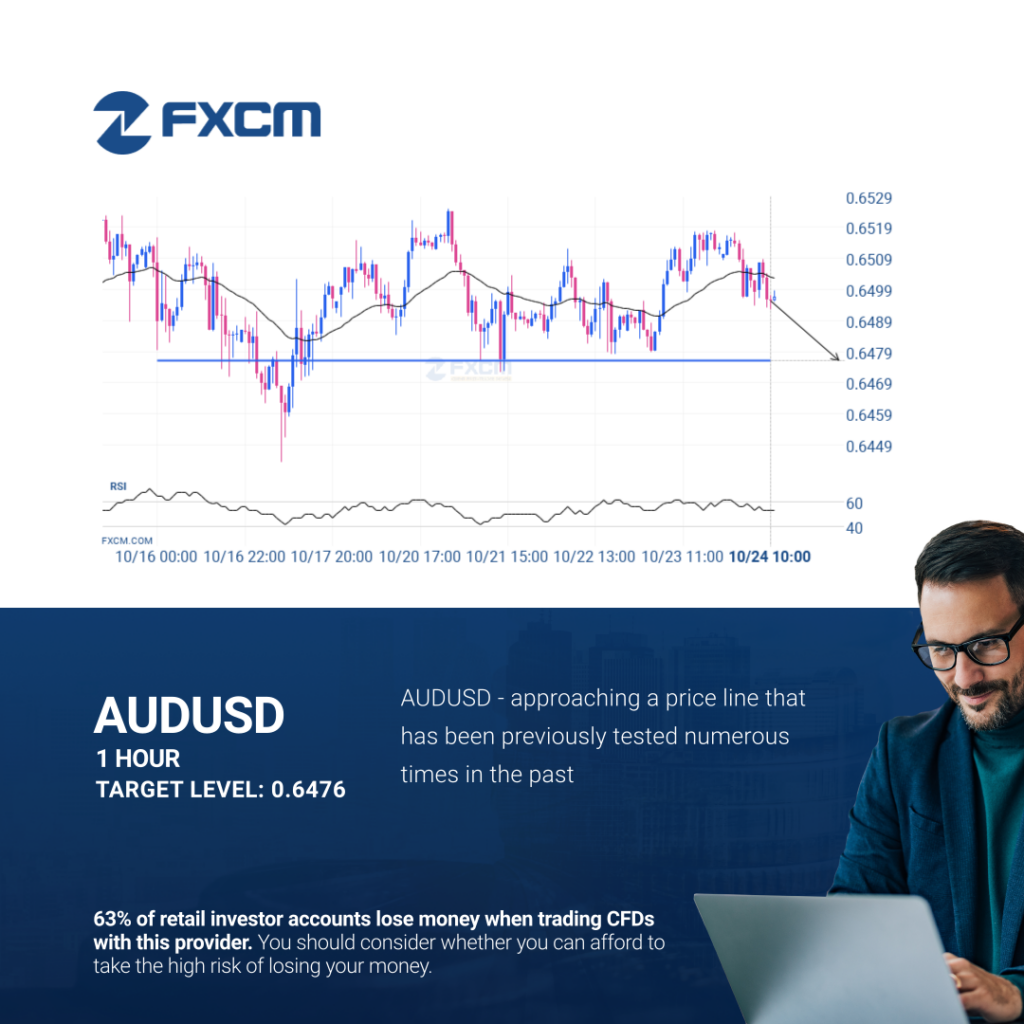
AUDUSD is approaching a support line at 0.6476. If it hits the support line, it may break through this level to continue the bearish trend, or it may turn around back to current levels. Past performance is not an indicator of future results. Trading leveraged products carries significant risk. Please refer to PDS and TMD […]
Un posible movimiento bajista en AUDUSD
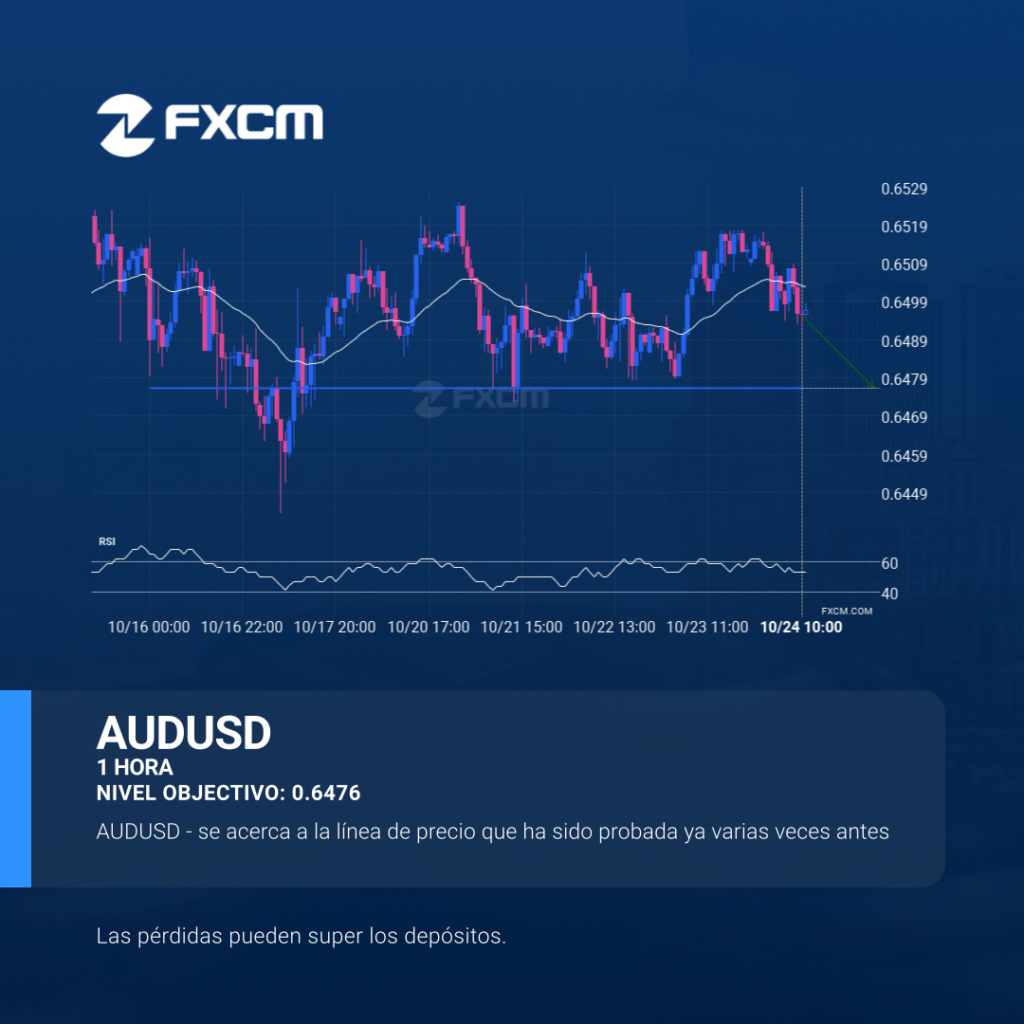
AUDUSD se está acercando a una línea de soporte en 0.6476. Si llega a la línea de soporte, puede atravesar este nivel para continuar con la tendencia bajista, o puede girarse y volver a los niveles actuales. El rendimiento pasado no es indicativo de resultados futuros. Las pérdidas pueden exceder los fondos depositados.
A potential bearish movement on AUDUSD
AUDUSD is approaching a support line at 0.6476. If it hits the support line, it may break through this level to continue the bearish trend, or it may turn around back to current levels. Past performance is not an indicator of future results. Trading leveraged products carries significant risk. Please refer to PDS and TMD […]
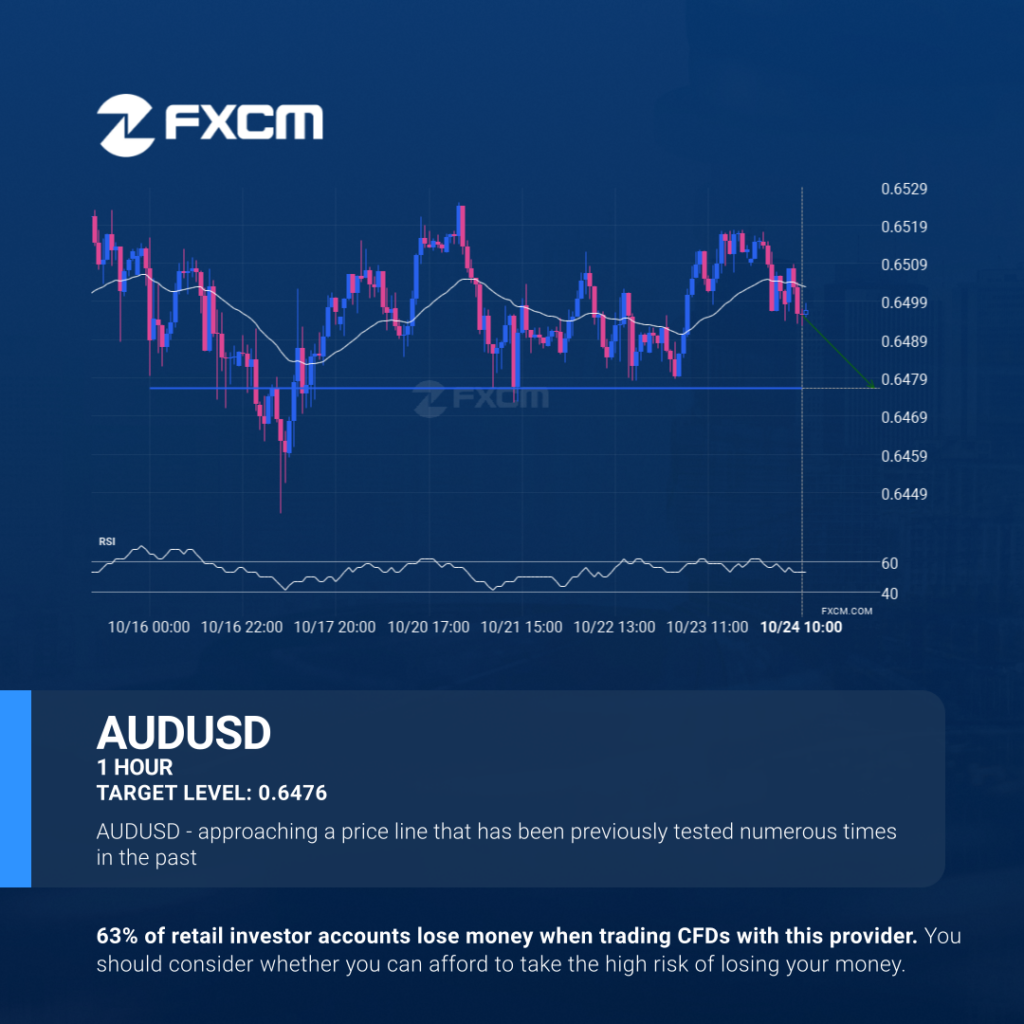
A potential bearish movement on AUDUSD

AUDUSD is approaching a support line at 0.6476. If it hits the support line, it may break through this level to continue the bearish trend, or it may turn around back to current levels. Past performance is not an indicator of future results. Losses can exceed deposits.
GBPUSD – se acerca a la línea de precio psicológico
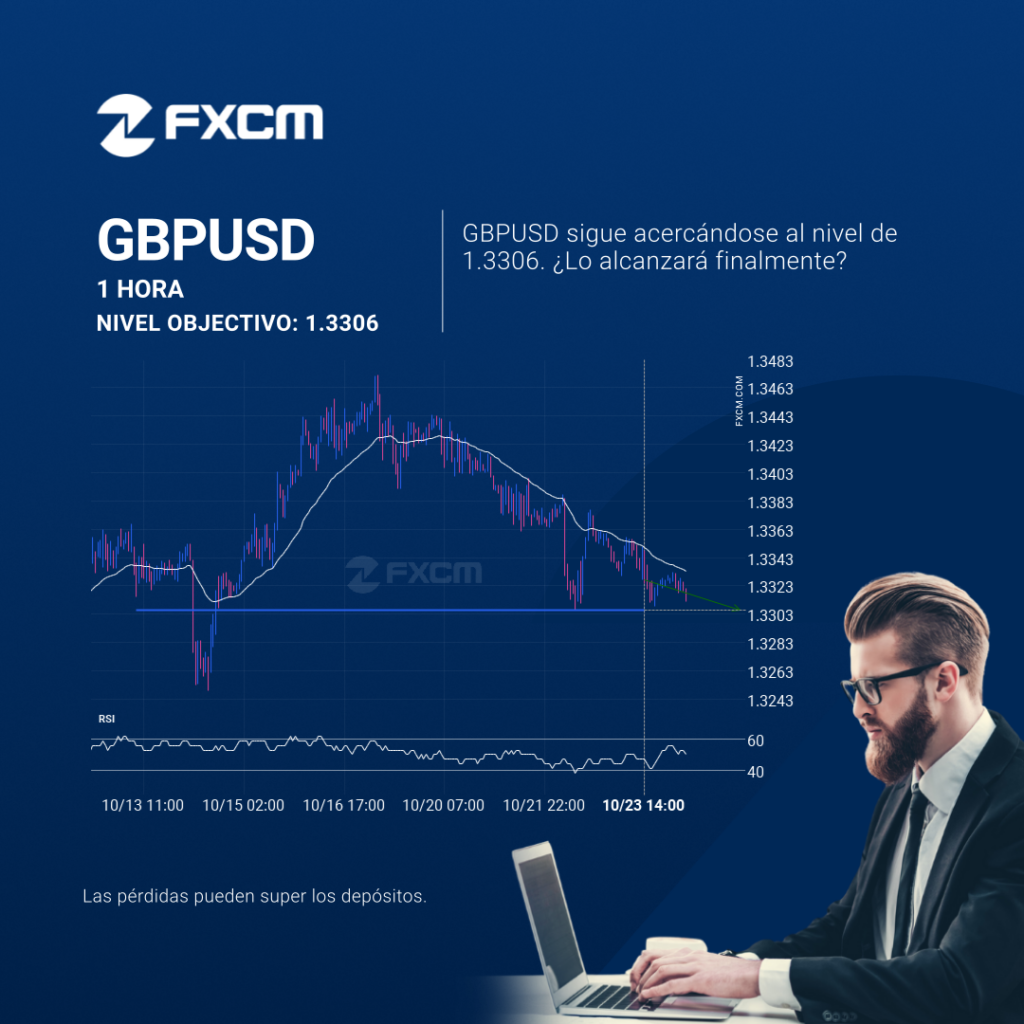
¡GBPUSD está en camino a una línea muy importante que definitivamente será un factor decisivo de lo que está por venir! Es posible que veamos que esta trayectoria continúa tocando el nivel en 1.3306 y lo acabe rompiendo, a menos que se quede sin impulso y vuelva a los niveles actuales. El rendimiento pasado no […]