Inminente irrupción de una importante línea de precio del EURJPY
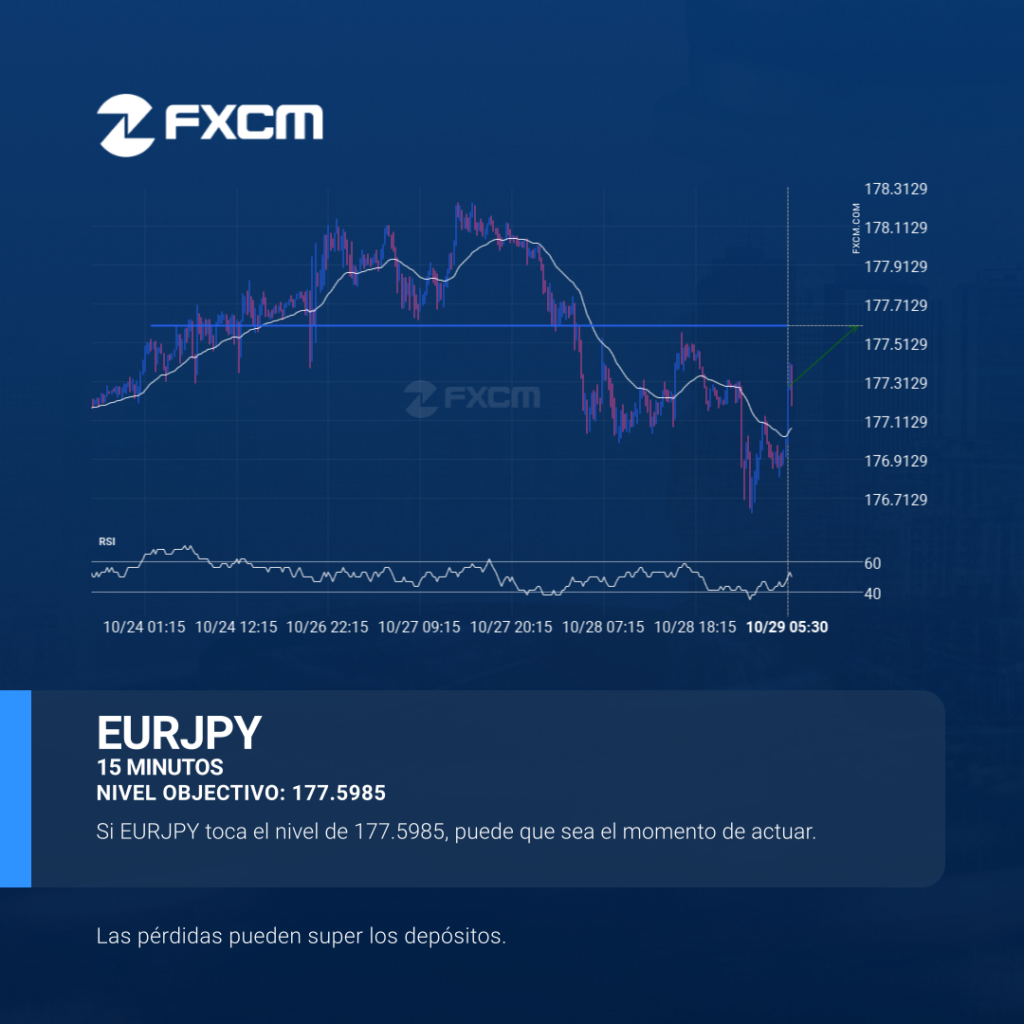
EURJPY se está acercando a una línea de resistencia en 177.5985. Si llega a la línea de resistencia, puede atravesar este nivel para continuar con la tendencia alcista, o puede girarse y volver a los niveles actuales. El rendimiento pasado no es indicativo de resultados futuros. Las pérdidas pueden exceder los fondos depositados.
ESP35 – Patrón de gráfico Continuation – Cuña ascendente
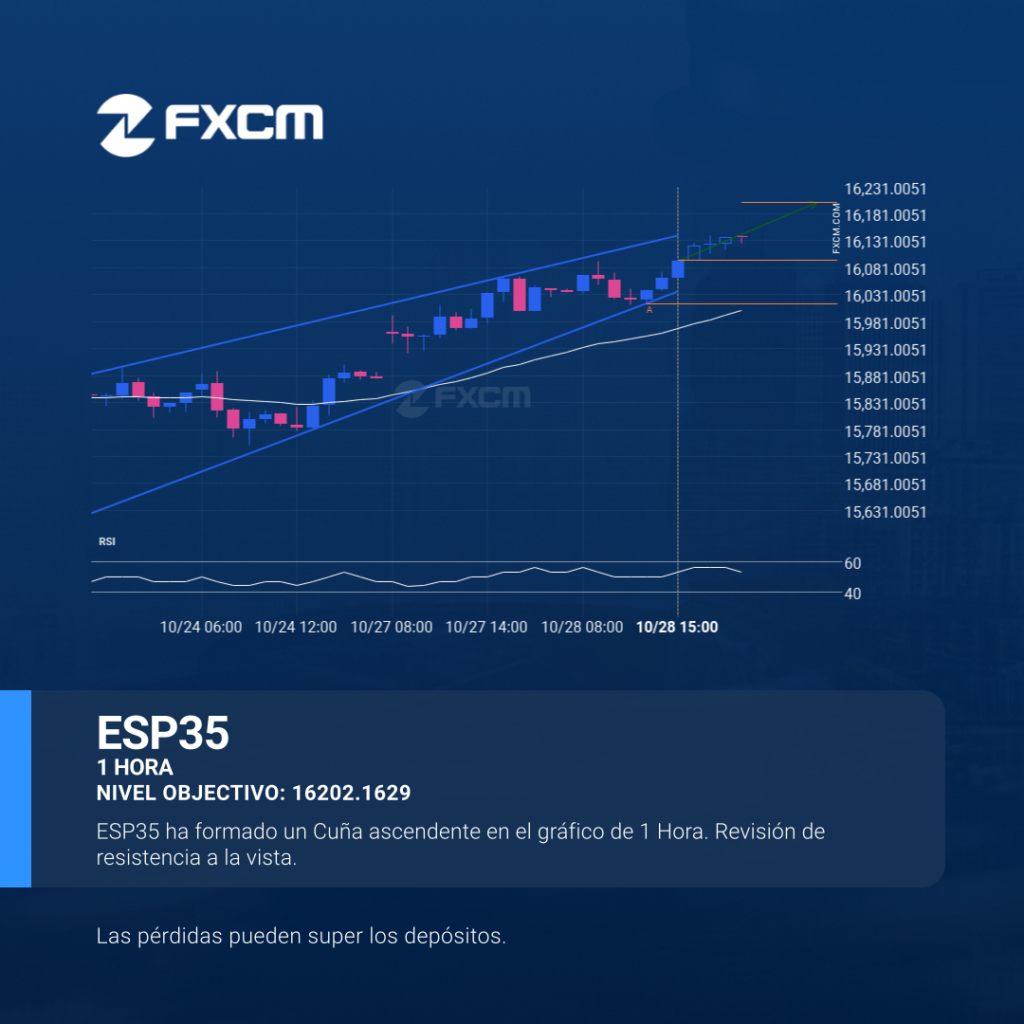
El ESP35 se dirige a la línea de resistencia de un Cuña ascendente. Si este movimiento se mantiene, el precio de ESP35 podría probar el nivel de 16202.1629 en las próximas 6 horas. Ya ha probado esta línea en numerosas ocasiones, por lo que este movimiento podría durar poco y terminar recuperándose, igual que ha […]
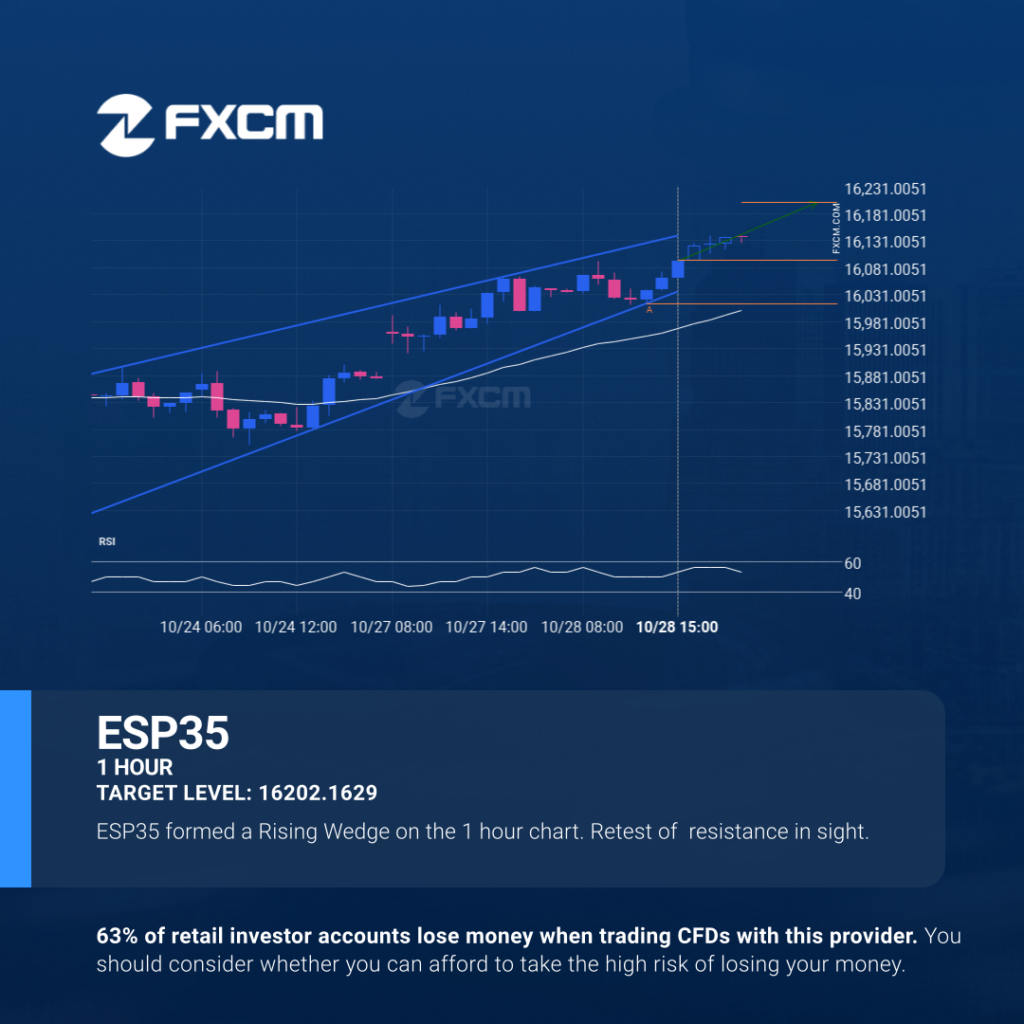
A potential bullish movement on ESP35
ESP35 is heading towards the resistance line of a Rising Wedge. If this movement continues, the price of ESP35 could test 16202.1629 within the next 6 hours. It has tested this line numerous times in the past, so this movement could be short-lived and end up rebounding just like it did in the past. Past […]
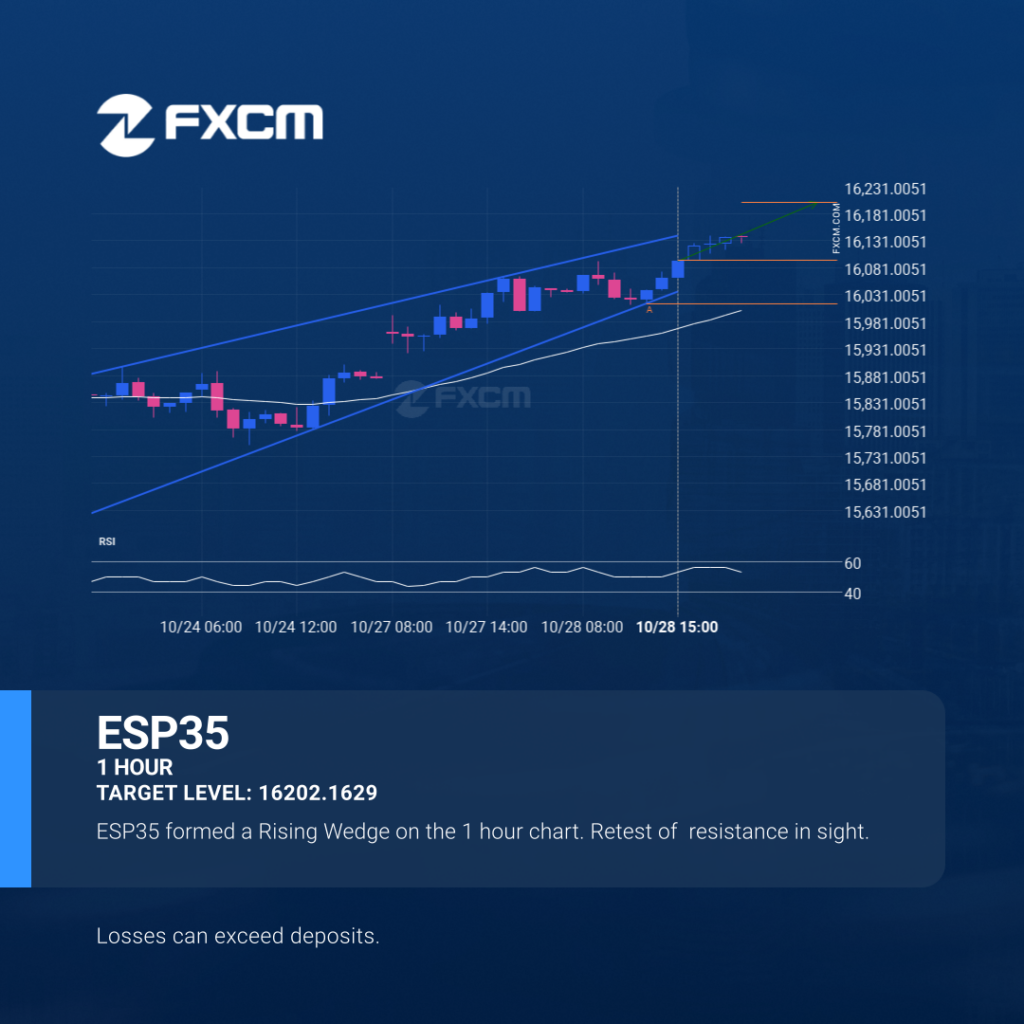
Un posible movimiento alcista en EURUSD
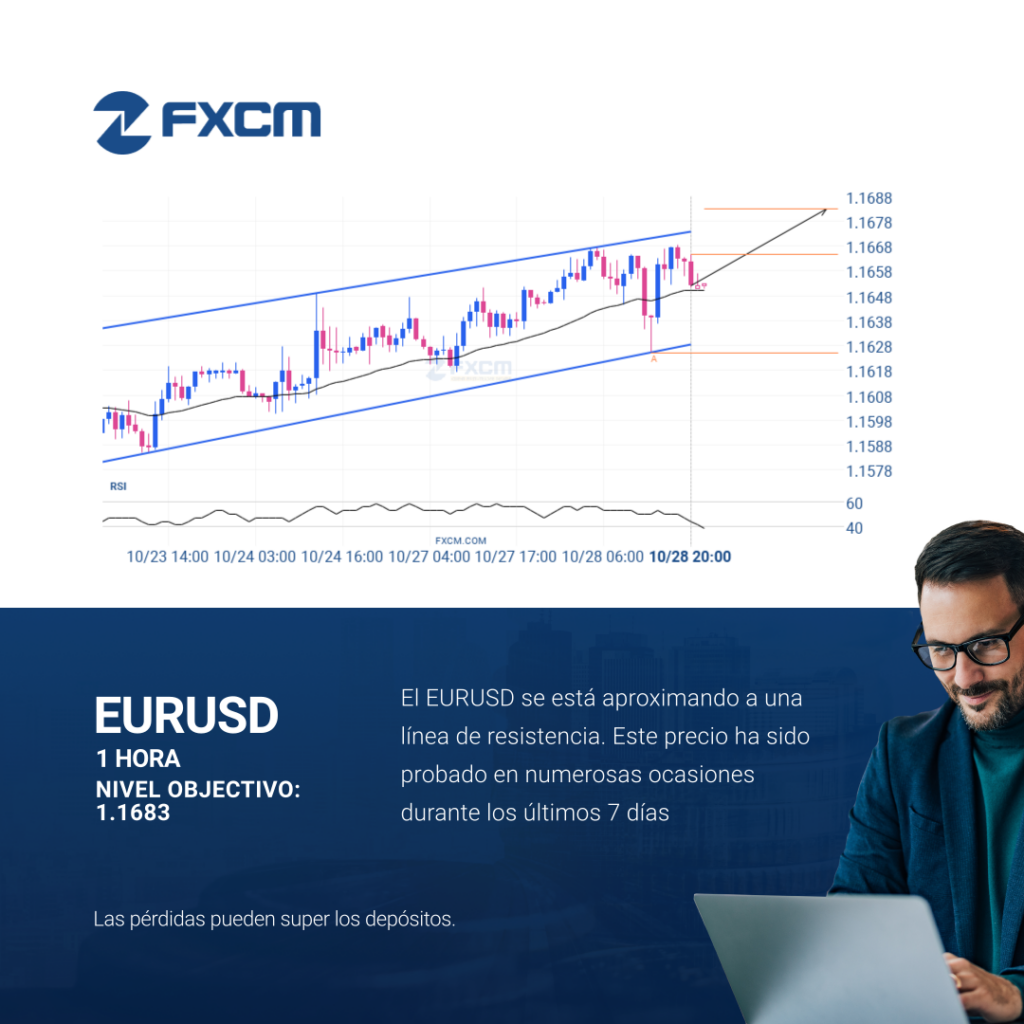
El EURUSD se dirige hacia la línea de resistencia de un Canal alcista y puede alcanzar este punto en las próximas 2 días. Ha probado esta línea ya en numerosas ocasiones en el pasado, y esta vez no tendría porqué ser diferente y terminar con una recuperación en lugar de una irrupción. Si ésta última […]
A potential bullish movement on EURUSD

EURUSD is heading towards the resistance line of a Channel Up and could reach this point within the next 2 days. It has tested this line numerous times in the past, and this time could be no different from the past, ending in a rebound instead of a breakout. If the breakout doesn’t happen, we […]
NZDUSD se acerca
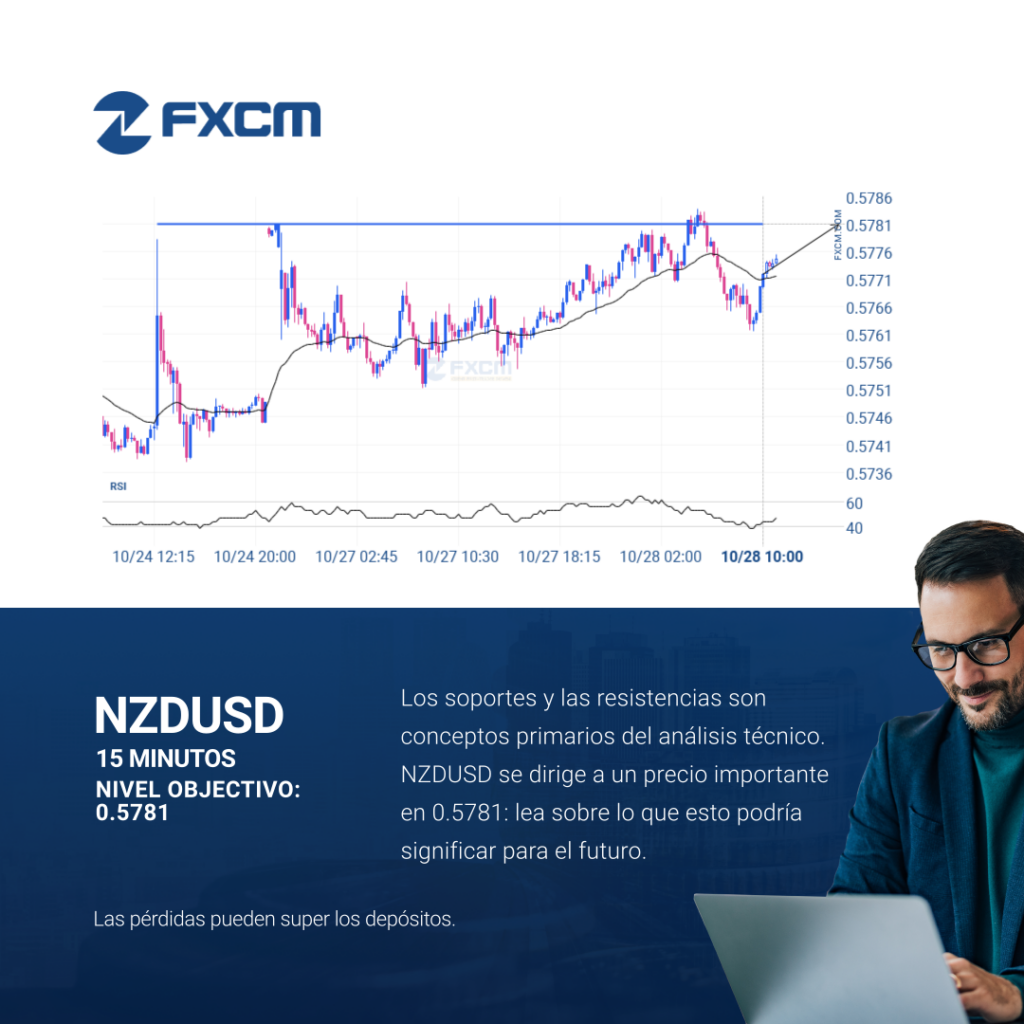
NZDUSD se está acercando a una línea de resistencia en 0.5781. Si llega a la línea de resistencia, puede atravesar este nivel para continuar con la tendencia alcista, o puede girarse y volver a los niveles actuales. El rendimiento pasado no es indicativo de resultados futuros. Las pérdidas pueden exceder los fondos depositados.
NZDUSD is on the approach

NZDUSD is approaching a resistance line at 0.5781. If it hits the resistance line, it may break through this level to continue the bullish trend, or it may turn around back to current levels. Past performance is not an indicator of future results. Losses can exceed deposits.
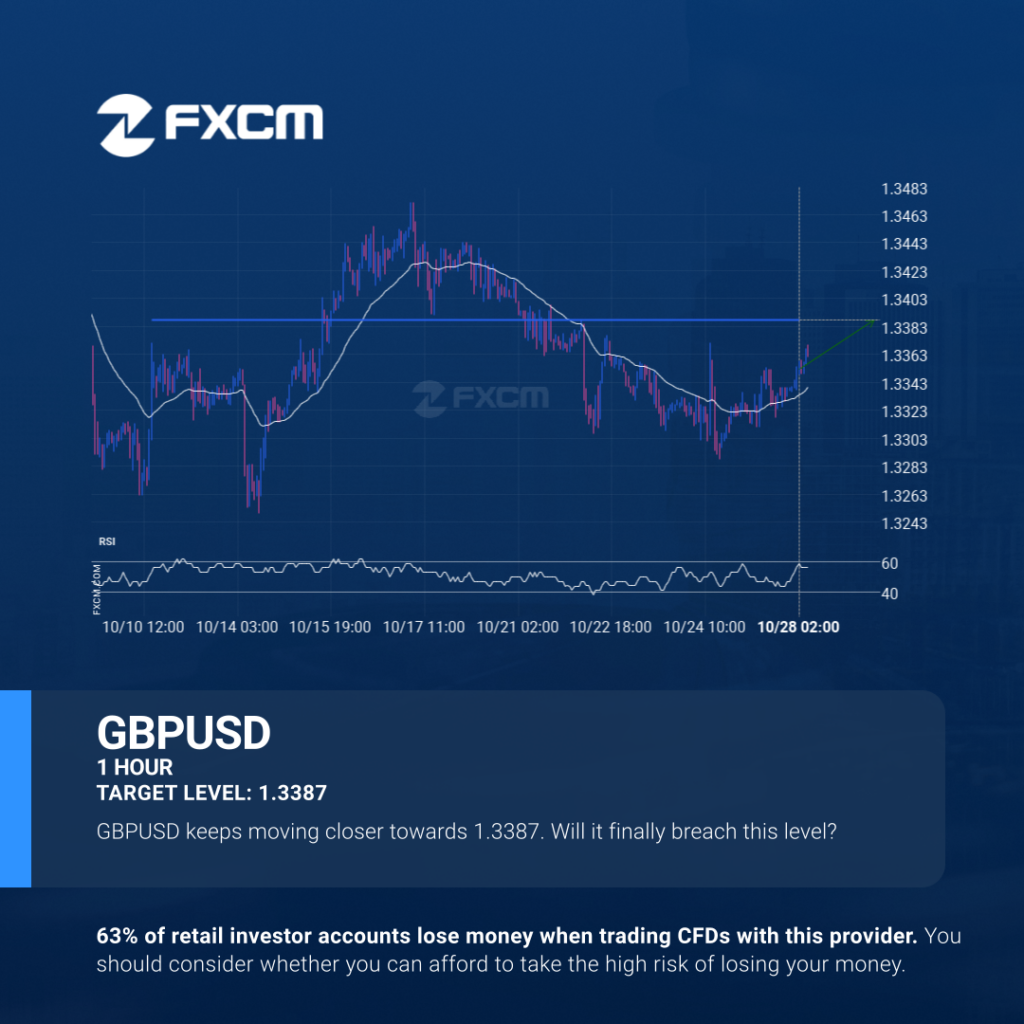
GBPUSD is on the approach

GBPUSD is approaching a resistance line at 1.3387. If it hits the resistance line, it may break through this level to continue the bullish trend, or it may turn around back to current levels. Past performance is not an indicator of future results. Trading leveraged products carries significant risk. Please refer to PDS and TMD […]
GBPUSD is on the approach
GBPUSD is approaching a resistance line at 1.3387. If it hits the resistance line, it may break through this level to continue the bullish trend, or it may turn around back to current levels. Past performance is not an indicator of future results. Trading leveraged products carries significant risk. Please refer to PDS and TMD […]