Análisis Técnico Cripto
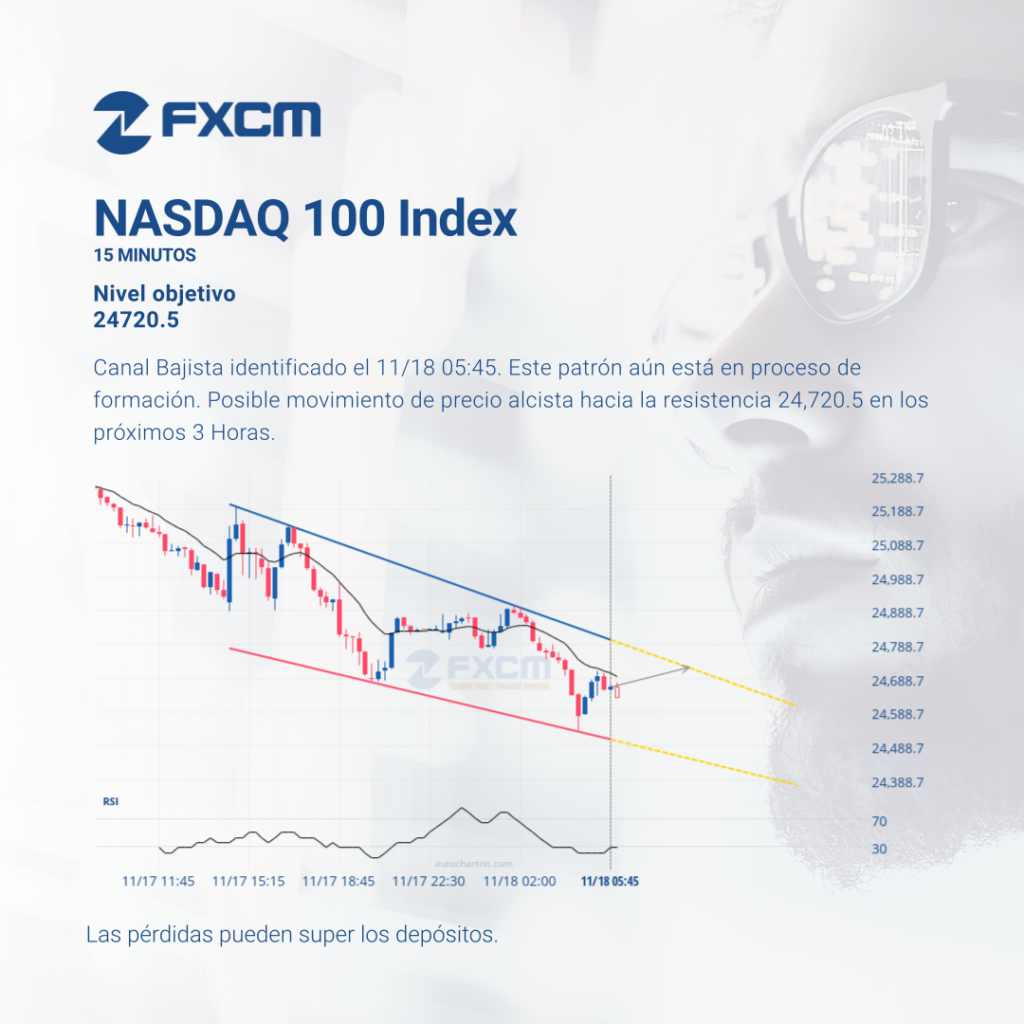
Canal Bajista identificado el 11/18 05:45. Este patrón aún está en proceso de formación. Posible movimiento de precio alcista hacia la resistencia 24,720.5 en los próximos 3 Horas. El rendimiento pasado no es indicativo de resultados futuros. Las pérdidas pueden exceder los fondos depositados.
Análisis Técnico Cripto
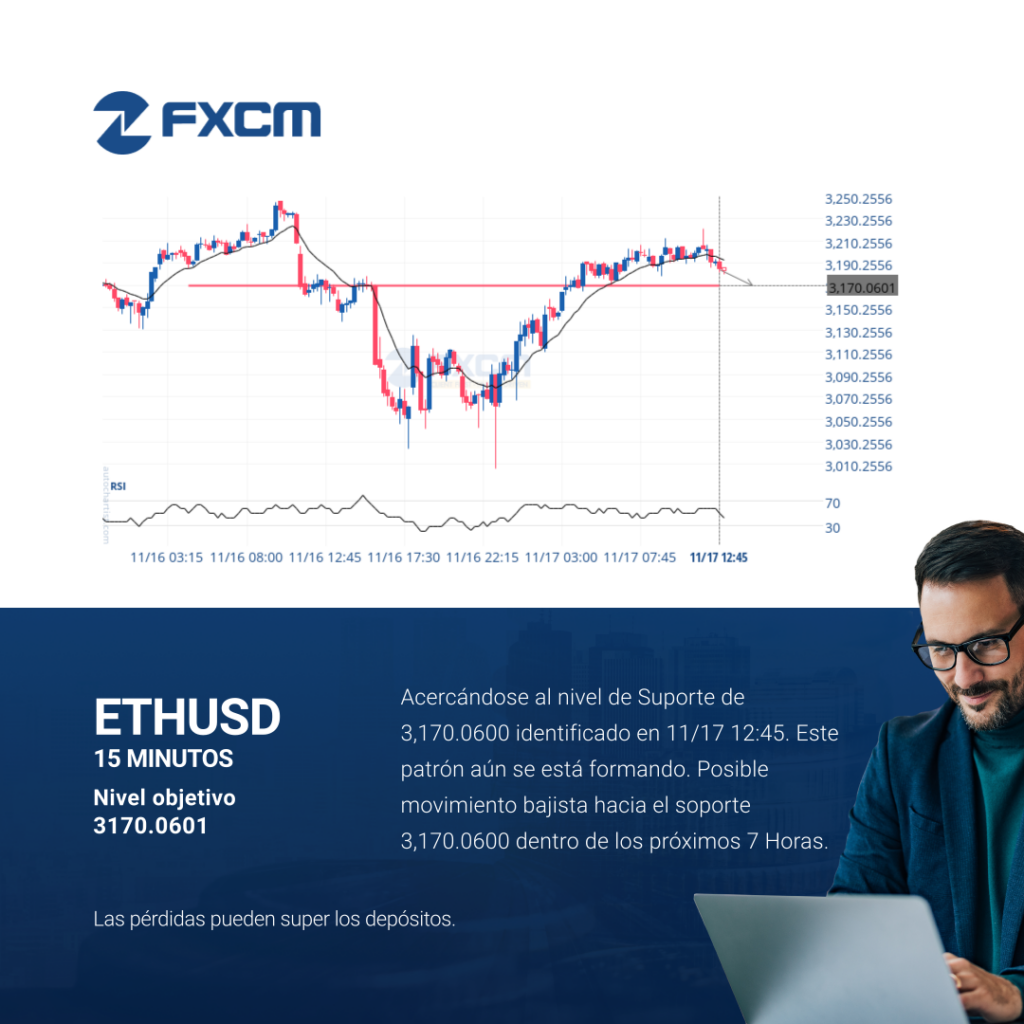
Acercándose al nivel de Suporte de 3,170.0600 identificado en 11/17 12:45. Este patrón aún se está formando. Posible movimiento bajista hacia el soporte 3,170.0600 dentro de los próximos 7 Horas. El rendimiento pasado no es indicativo de resultados futuros. Las pérdidas pueden exceder los fondos depositados.
Technical Analysis Forex
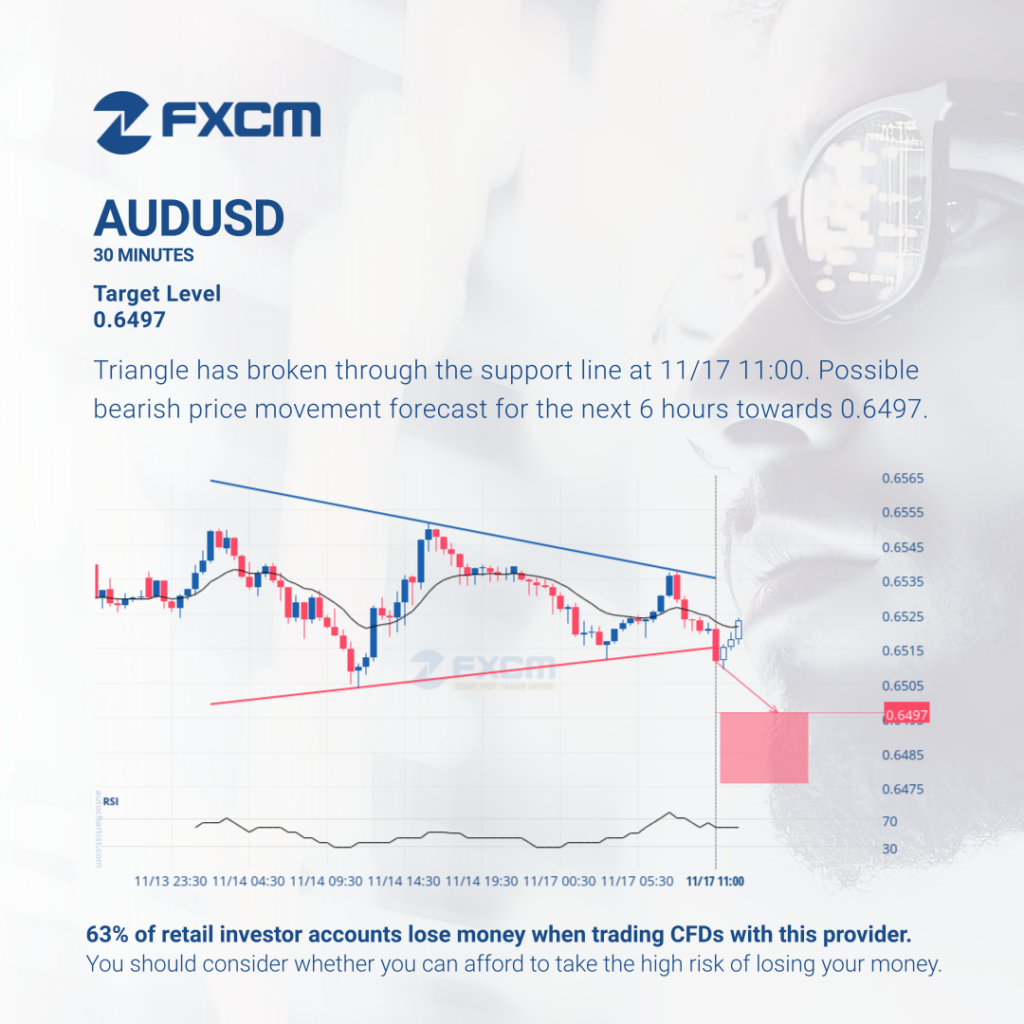
Triangle has broken through the support line at 11/17 11:00. Possible bearish price movement forecast for the next 6 hours towards 0.6497. Past performance is not an indicator of future results. Losses can exceed deposits.
Índices de Análisis Técnico
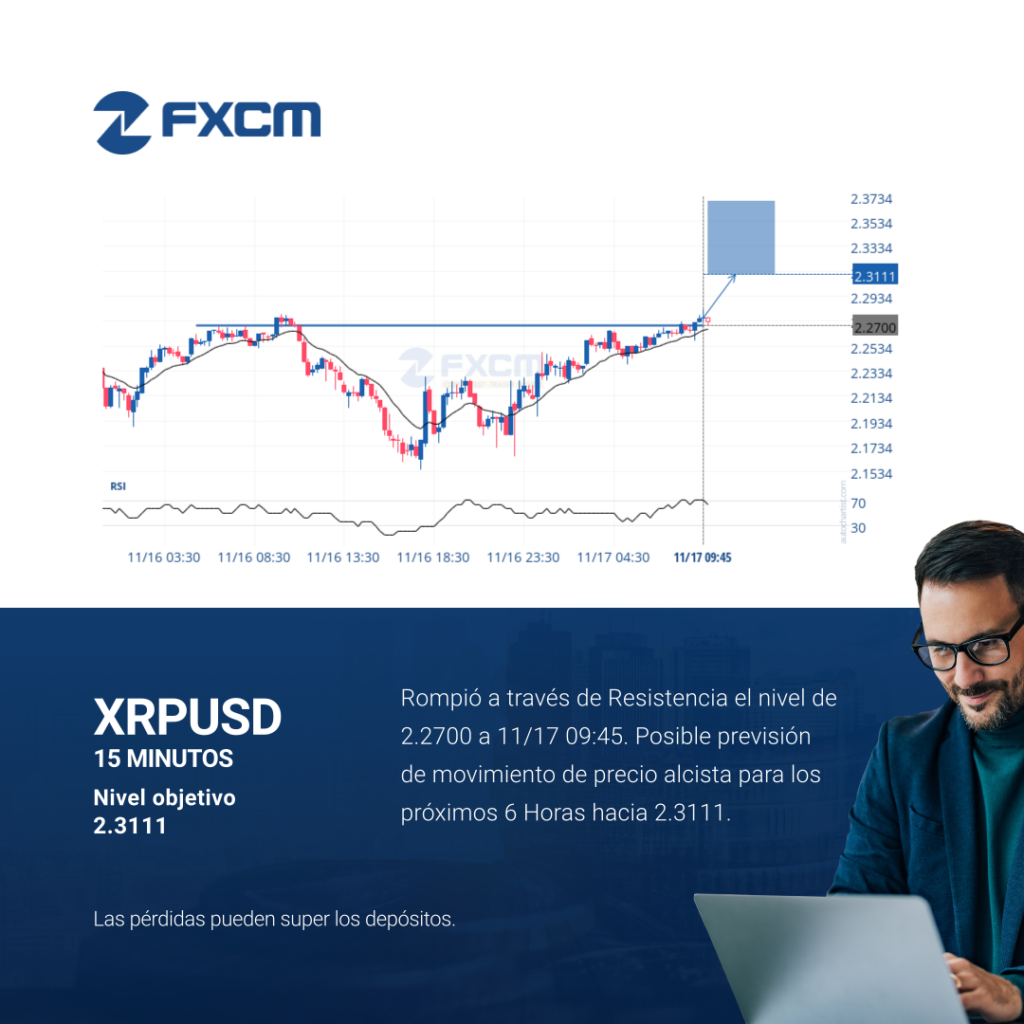
Rompió a través de Resistencia el nivel de 2.2700 a 11/17 09:45. Posible previsión de movimiento de precio alcista para los próximos 6 Horas hacia 2.3111. El rendimiento pasado no es indicativo de resultados futuros. Las pérdidas pueden exceder los fondos depositados.
Technical Analysis Indices
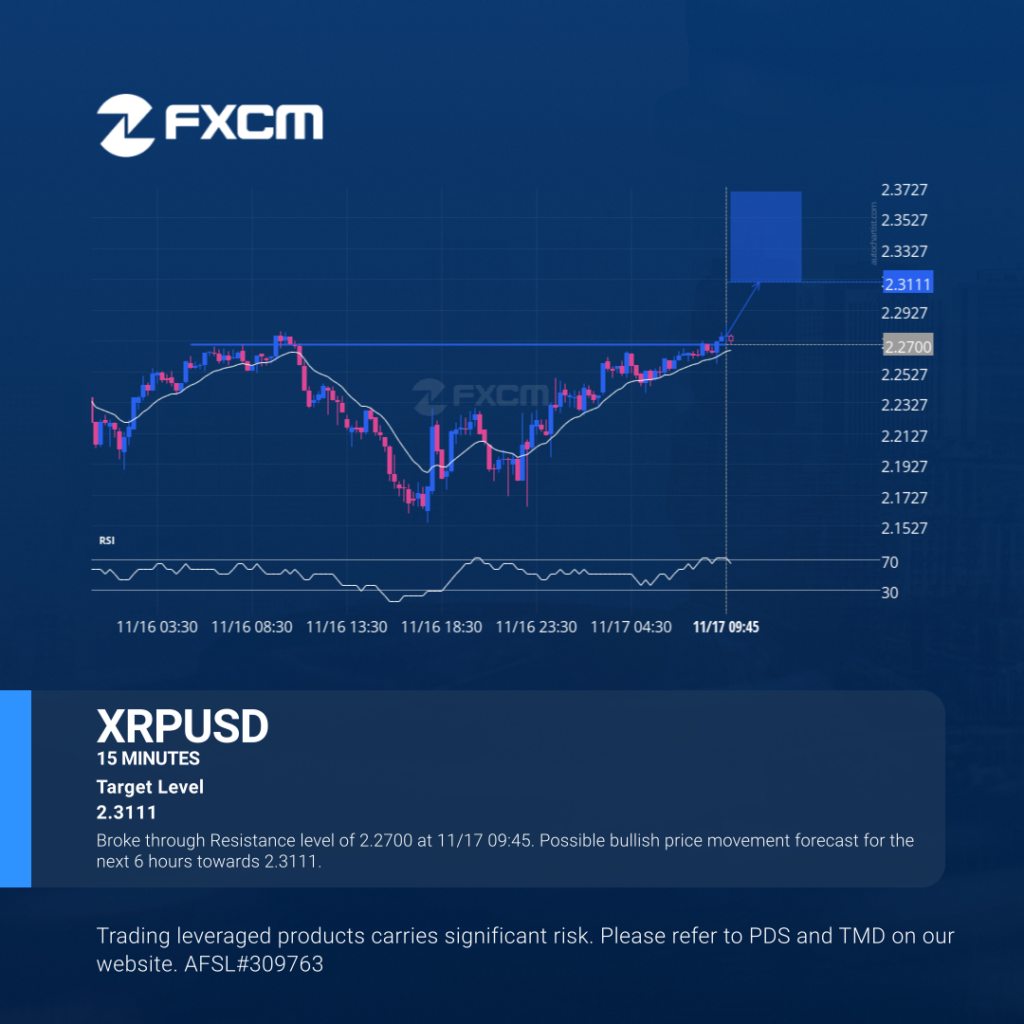
Broke through Resistance level of 2.2700 at 11/17 09:45. Possible bullish price movement forecast for the next 6 hours towards 2.3111. Past performance is not an indicator of future results. Trading leveraged products carries significant risk. Please refer to PDS and TMD on our website. AFSL#309763
Análisis Técnico Cripto
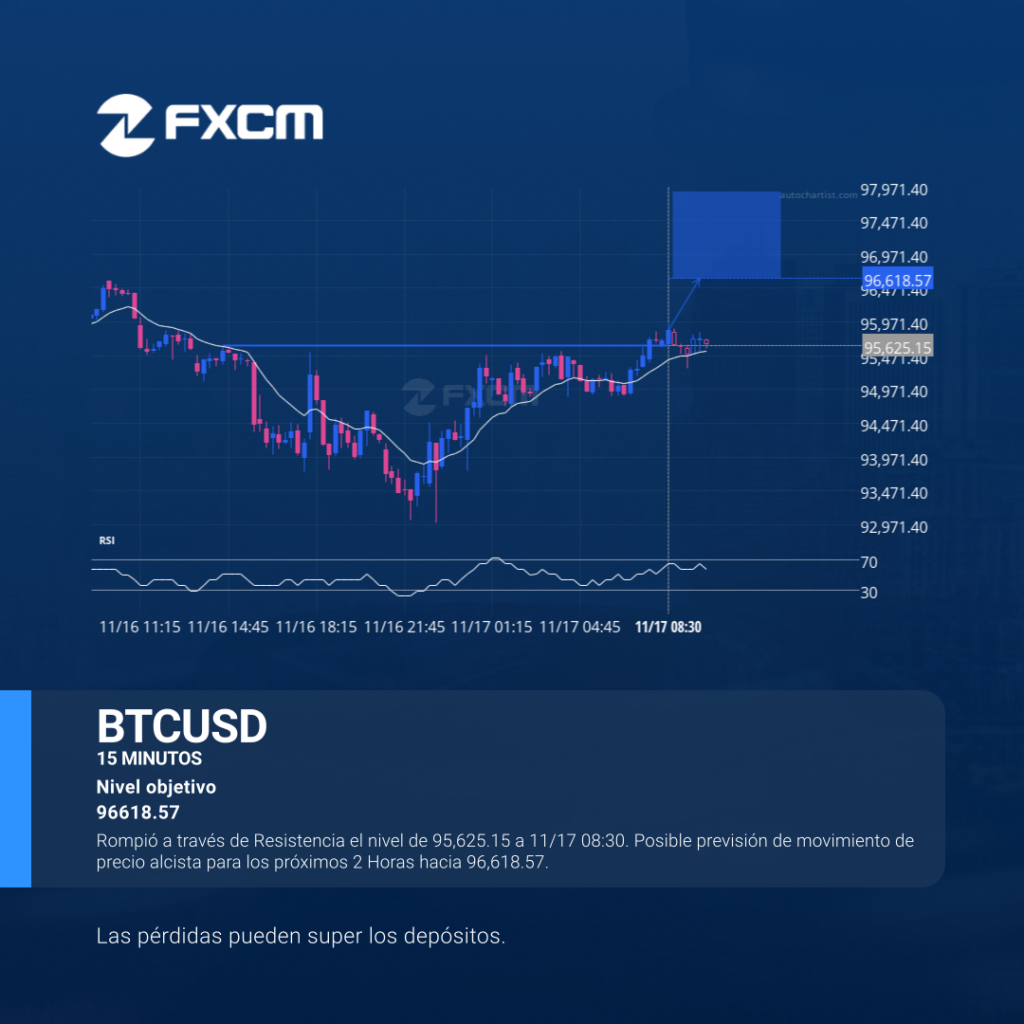
Rompió a través de Resistencia el nivel de 95,625.15 a 11/17 08:30. Posible previsión de movimiento de precio alcista para los próximos 2 Horas hacia 96,618.57. El rendimiento pasado no es indicativo de resultados futuros. Las pérdidas pueden exceder los fondos depositados.
Análisis Técnico Cripto
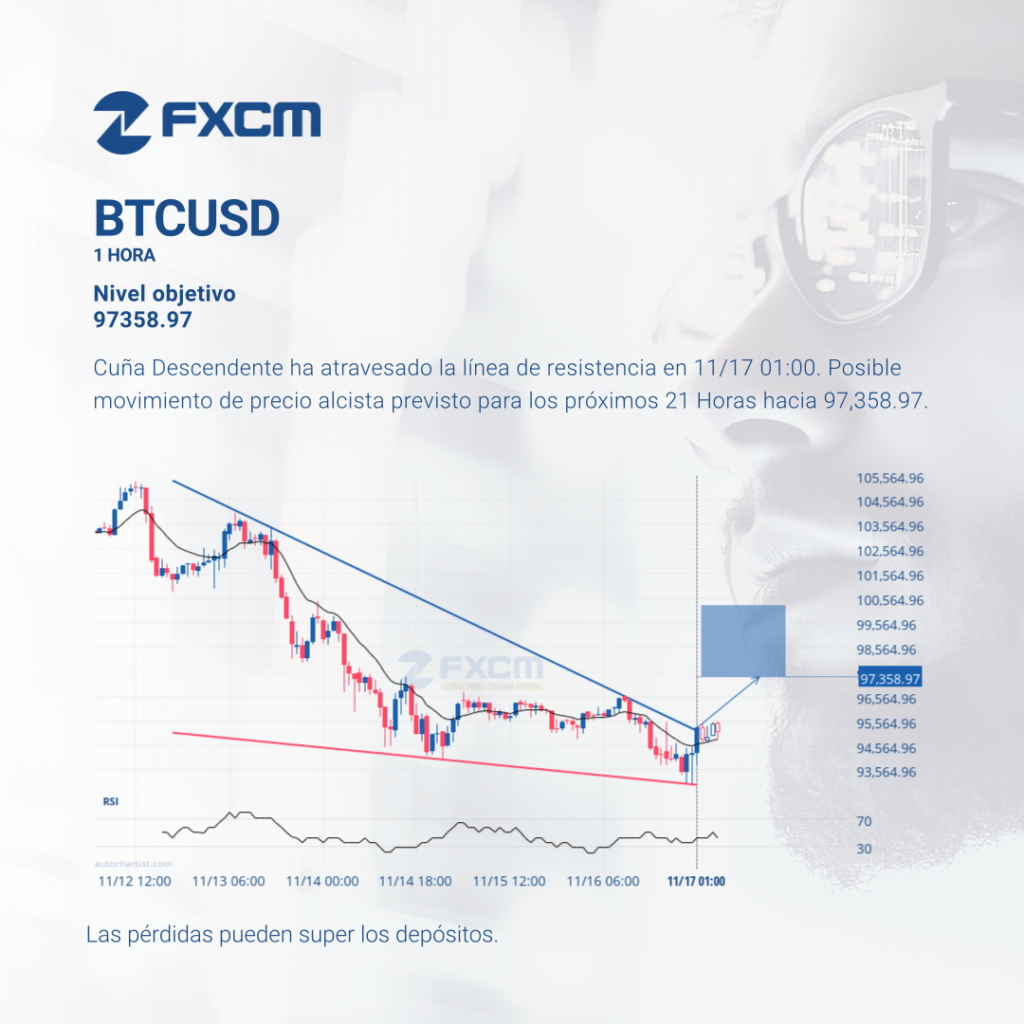
Cuña Descendente ha atravesado la línea de resistencia en 11/17 01:00. Posible movimiento de precio alcista previsto para los próximos 21 Horas hacia 97,358.97. El rendimiento pasado no es indicativo de resultados futuros. Las pérdidas pueden exceder los fondos depositados.
Technical Analysis Indices
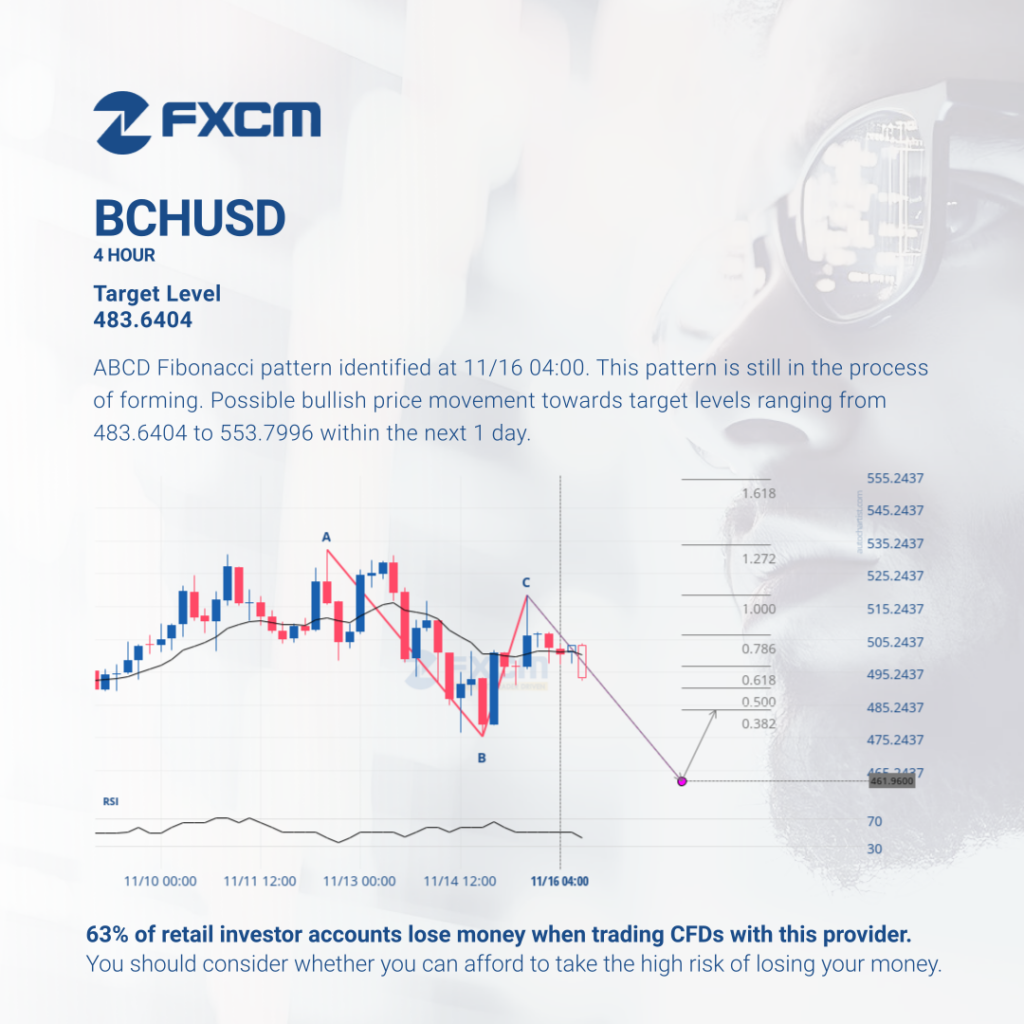
ABCD Fibonacci pattern identified at 11/16 04:00. This pattern is still in the process of forming. Possible bullish price movement towards target levels ranging from 483.6404 to 553.7996 within the next 1 day. Past performance is not an indicator of future results. Losses can exceed deposits.
Technical Analysis Indices
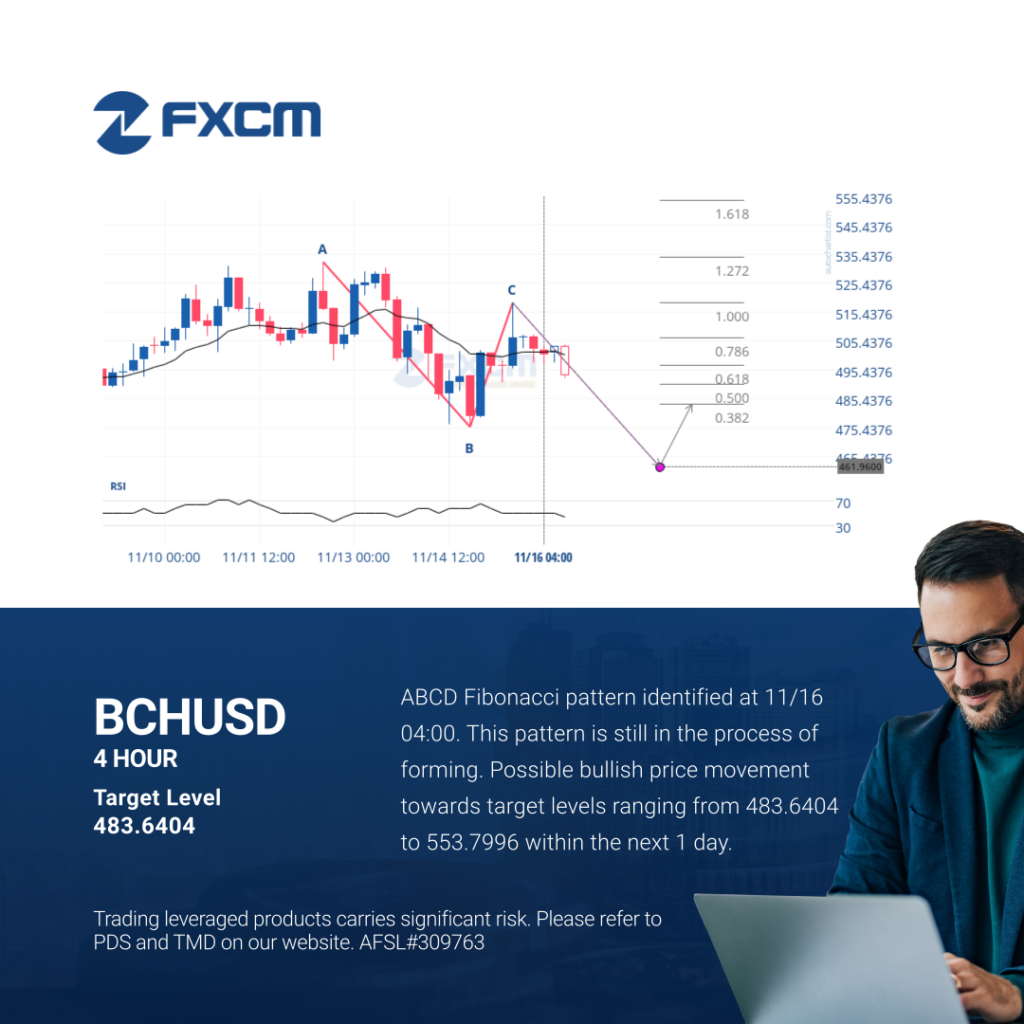
ABCD Fibonacci pattern identified at 11/16 04:00. This pattern is still in the process of forming. Possible bullish price movement towards target levels ranging from 483.6404 to 553.7996 within the next 1 day. Past performance is not an indicator of future results. Trading leveraged products carries significant risk. Please refer to PDS and TMD on […]
Análisis Técnico Cripto
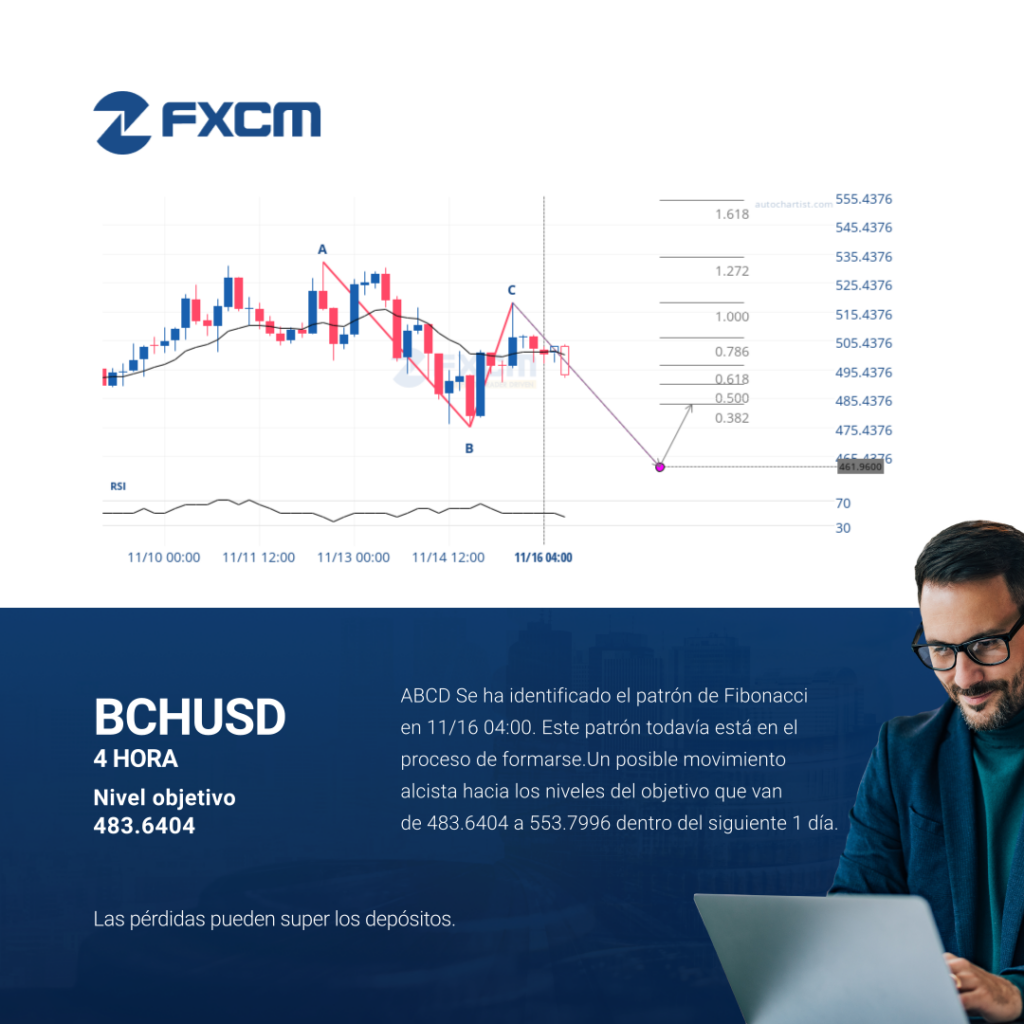
ABCD Se ha identificado el patrón de Fibonacci en 11/16 04:00. Este patrón todavía está en el proceso de formarse.Un posible movimiento alcista hacia los niveles del objetivo que van de 483.6404 a 553.7996 dentro del siguiente 1 día. El rendimiento pasado no es indicativo de resultados futuros. Las pérdidas pueden exceder los fondos depositados.