A potential bearish movement on HKG33
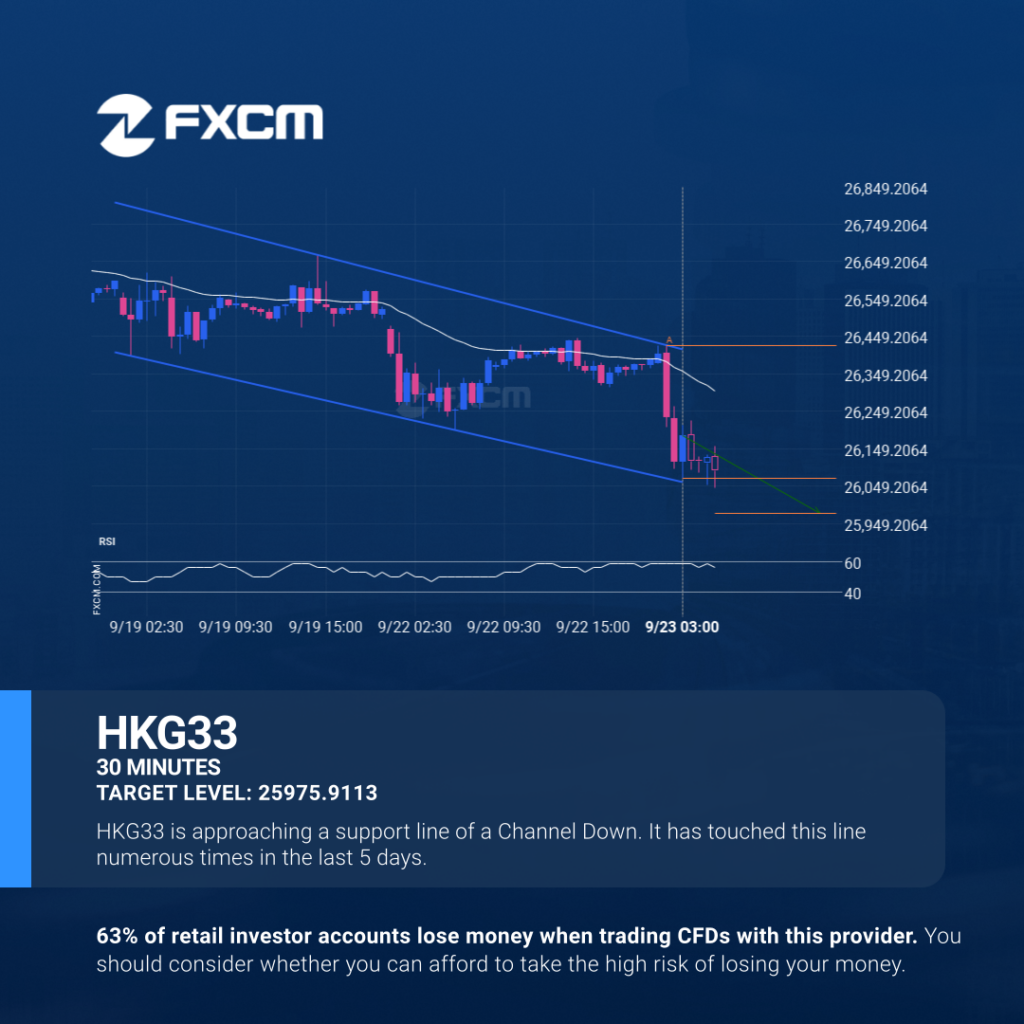
HKG33 is trapped in a Channel Down formation, implying that a breakout is Imminent. This is a great trade-setup for both trend and swing traders. It is now approaching a resistance line that has been tested in the past. Divergence opportunists may be very optimistic about a possible breakout and this may be the start […]
HKG33 – Patrón de gráfico Continuation – Canal bajista
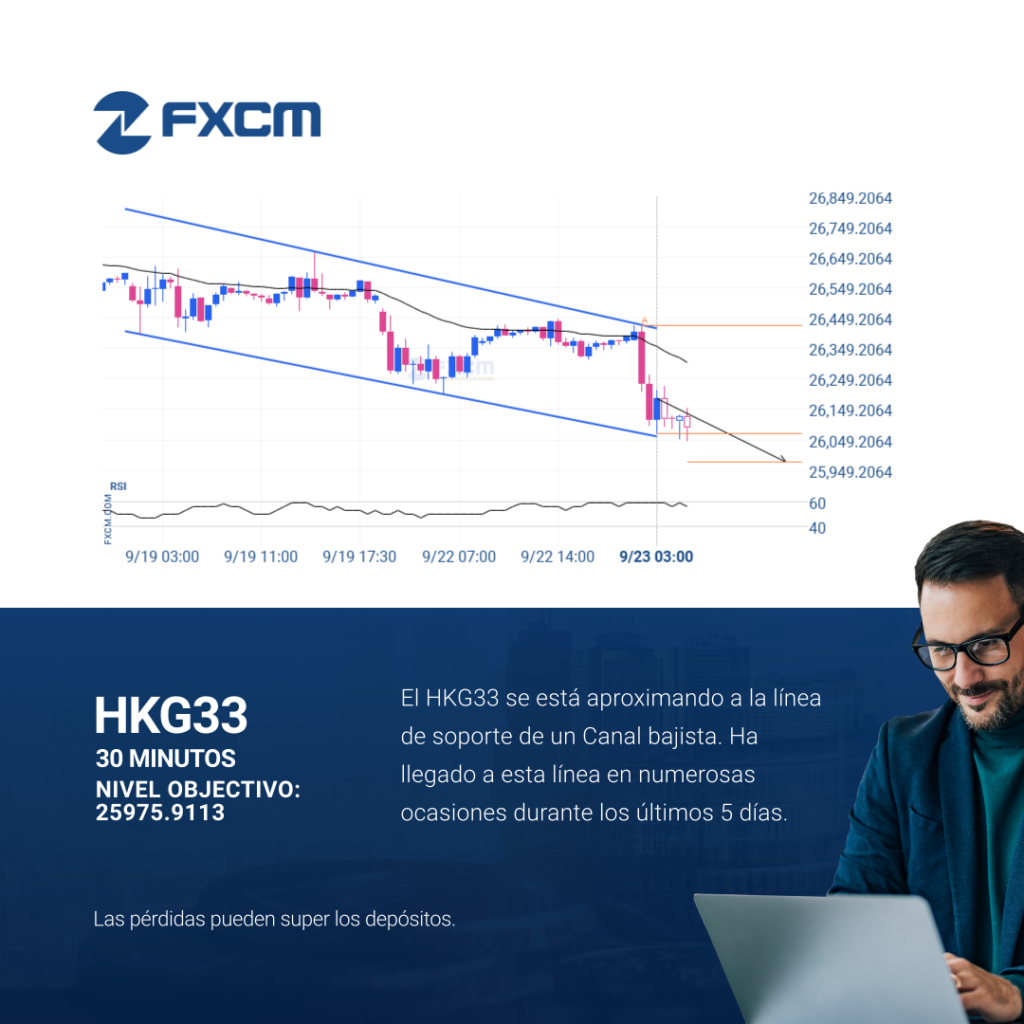
El patrón de Canal bajista emergente en su ola final se identificó en el gráfico de 30 Minutos de HKG33. Después de un fuerte movimiento bajista, encontramos que HKG33 se dirige hacia la línea del triángulo superior con una posible resistencia en 25975.9113. Si resulta que el nivel de soporte aguanta, el patrón de Canal […]
A potential bearish movement on HKG33
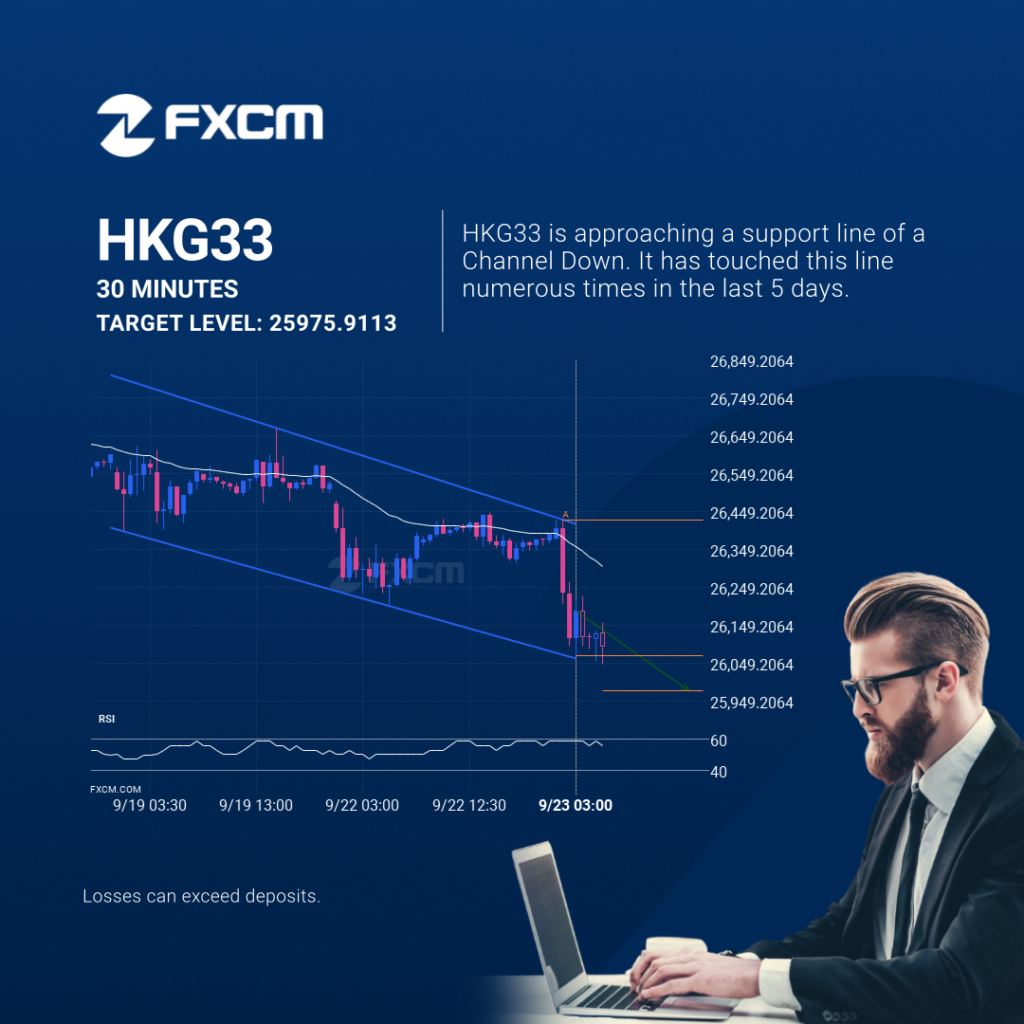
HKG33 is trapped in a Channel Down formation, implying that a breakout is Imminent. This is a great trade-setup for both trend and swing traders. It is now approaching a resistance line that has been tested in the past. Divergence opportunists may be very optimistic about a possible breakout and this may be the start […]
Previsión de trading de BTCUSD a las 2025-09-23T07:00:00.000Z hasta las 2025-09-23T07:00:00.000Z

Le recomendamos que confirme la rotura que acaba de ocurrir. ¿Cree que el movimiento a través del nivel de resistencia es significativo? ¿Tiene indicadores que confirmen que el impulso de los precios continuará? Si es así, busque objetivo en 113259.1216, pero considere reducir el tamaño de su posición a medida que el precio se acerque […]
Continuation pattern on AUDUSD

AUDUSD moved through the resistance line of a Triangle at 0.659511923076923 on the 1 hour chart. This line has been tested a number of times in the past and this breakout could mean an upcoming change from the current trend. It may continue in its current direction toward 0.6612. Past performance is not an indicator […]
Continuation pattern on AUDUSD

AUDUSD moved through the resistance line of a Triangle at 0.659511923076923 on the 1 hour chart. This line has been tested a number of times in the past and this breakout could mean an upcoming change from the current trend. It may continue in its current direction toward 0.6612. Past performance is not an indicator […]
Continuation pattern on AUDUSD

AUDUSD moved through the resistance line of a Triangle at 0.659511923076923 on the 1 hour chart. This line has been tested a number of times in the past and this breakout could mean an upcoming change from the current trend. It may continue in its current direction toward 0.6612. Past performance is not an indicator […]
Patrón Continuation en AUDUSD

AUDUSD atravesó la línea de resistencia de un patrón de Triángulo en 0.659511923076923 en el gráfico de 1 Hora. Esta línea se ha testeado varias veces en el pasado y esta rotura podría significar un próximo cambio de la tendencia actual. Puede continuar en su dirección actual hacia 0.6612. El rendimiento pasado no es indicativo […]
A potential bearish movement on EURGBP
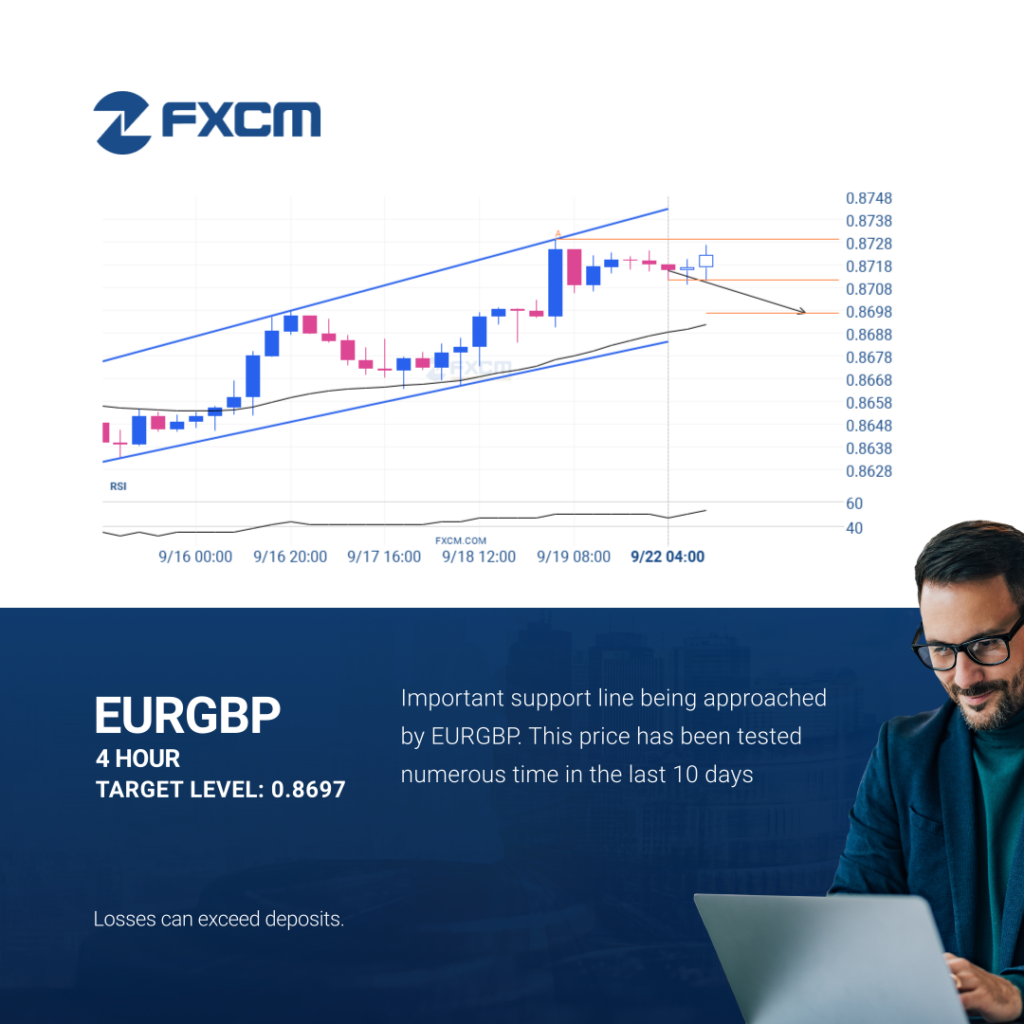
EURGBP is moving towards a support line. Because we have seen it retrace from this line before, we could see either a break through this line, or a rebound back to current levels. It has touched this line numerous times in the last 10 days and may test it again within the next 2 days. […]
Breach of important price line imminent by ESP35
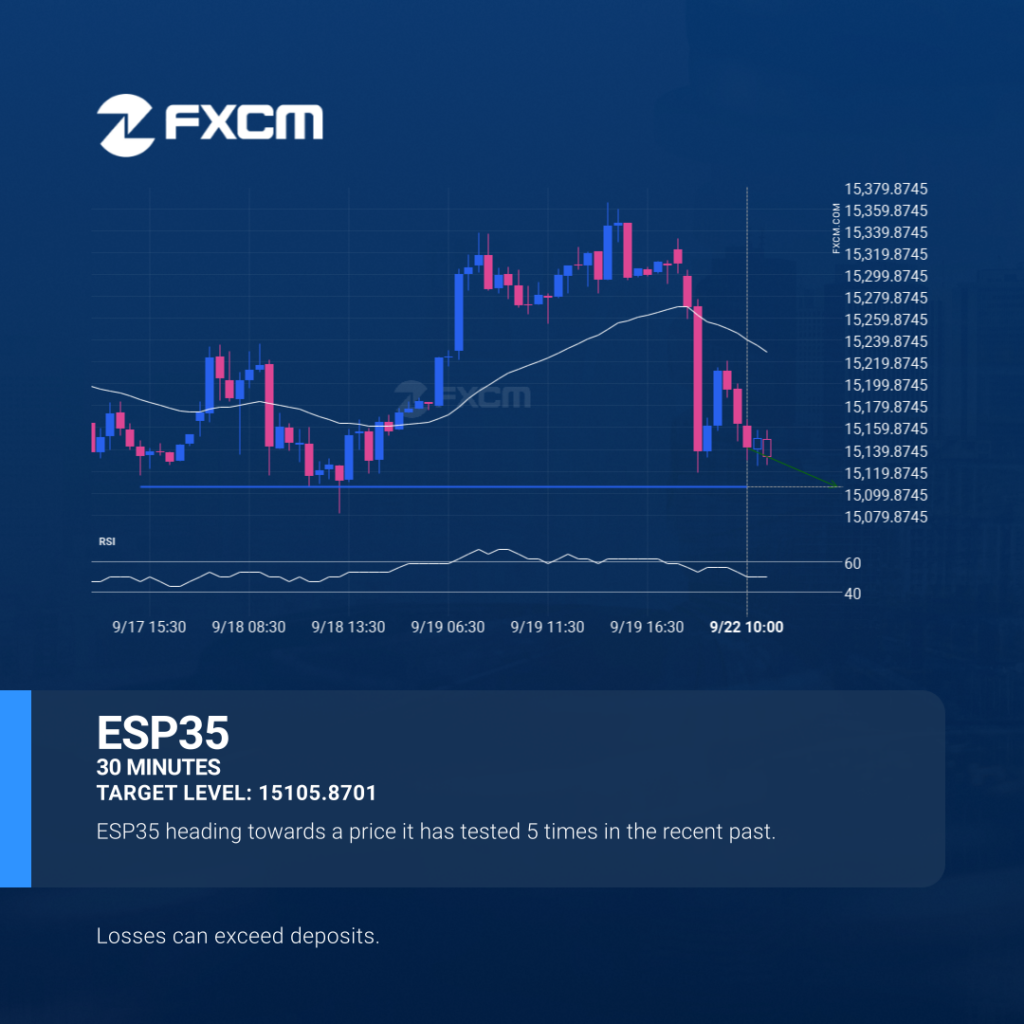
ESP35 is moving towards a support line. Because we have seen it retrace from this level in the past, we could see either a break through this line, or a rebound back to current levels. It has touched this line numerous times in the last 5 days and may test it again within the next […]