El BTCUSD se aproxima a el soporte de un Cuña descendente

Se identificó un patrón de Cuña descendente en BTCUSD en 113298.57, lo que generó la expectativa de que podría moverse a la línea de soporte en 109722.8185. Puede atravesar esa línea y continuar la tendencia bajista o puede girarse desde esa línea. El rendimiento pasado no es indicativo de resultados futuros. Las pérdidas pueden exceder […]
ESP35 – support line broken at 2025-08-21T12:30:00.000Z
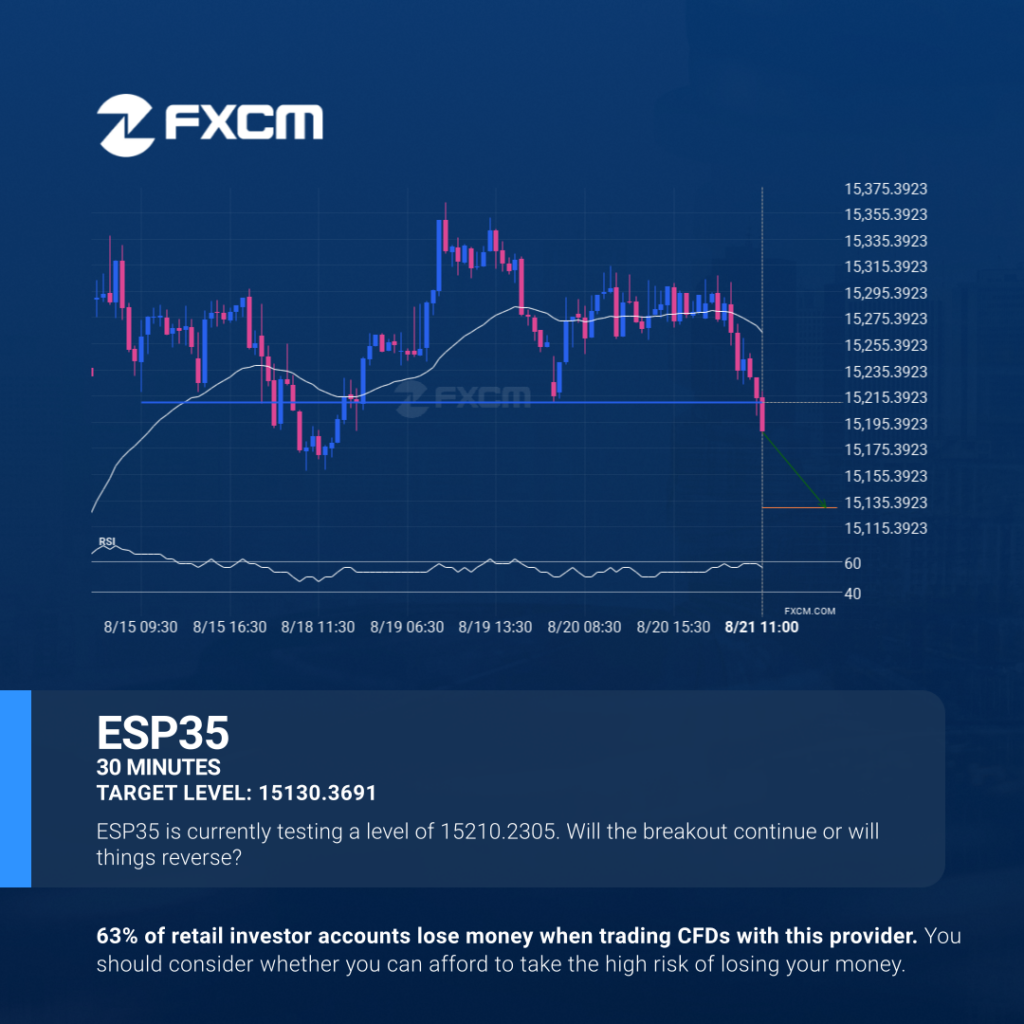
ESP35 has broken through a support line. Because we have seen it retrace from this price in the past, one should wait for confirmation of the breakout before trading. It has touched this line numerous times in the last 7 days and suggests a possible target level to be around 15130.3691 within the next 12 […]
ESP35 – support line broken at 2025-08-21T12:30:00.000Z

ESP35 has broken through a support line. Because we have seen it retrace from this price in the past, one should wait for confirmation of the breakout before trading. It has touched this line numerous times in the last 7 days and suggests a possible target level to be around 15130.3691 within the next 12 […]
ESP35: línea de soporte rota a las 2025-08-21T12:30:00.000Z

El ESP35 atravesó la línea de soporte. Como ya lo hemos visto retroceder desde esta posición en el pasado, deberíamos esperar la confirmación de la ruptura antes de operar. Ha llegado a esta línea en numerosas ocasiones en los últimos 7 días, lo cual sugiere un posible nivel objetivo alrededor de 15130.3691 dentro de las […]
¿Deberíamos esperar una irrupción o una recuperación del USDCHF?

¡USDCHF está en camino a una línea muy importante que definitivamente será un factor decisivo de lo que está por venir! Es posible que veamos que esta trayectoria continúa tocando el nivel en 0.8021 y lo acabe rompiendo, a menos que se quede sin impulso y vuelva a los niveles actuales. El rendimiento pasado no […]
Should we expect a breakout or a rebound on USDCHF?

USDCHF is en route to a very important line that will be a definite deciding factor of what is to come! We may see this trajectory continue to touch and break through 0.8021, unless it runs out of momentum and pulls back to current levels. Past performance is not an indicator of future results. Losses […]
EURUSD broke through important 1.1651 price line
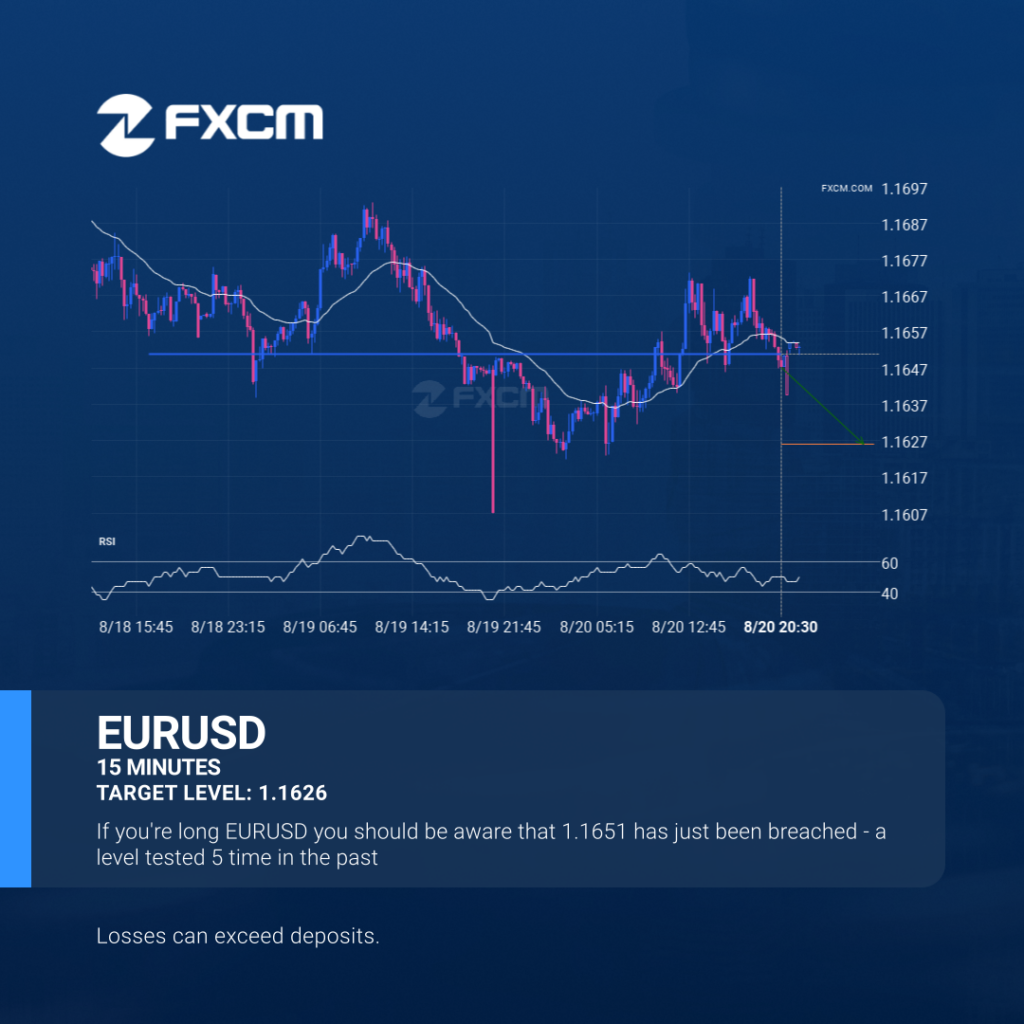
EURUSD has broken through 1.1651 which it has tested numerous times in the past. We have seen it retrace from this price in the past. If this new trend persists, EURUSD may be heading towards 1.1626 within the next 11 hours. Past performance is not an indicator of future results. Losses can exceed deposits.
El EURUSD atravesó la importante línea de precio de 1.1651

El EURUSD ha atravesado 1.1651, que ha probado ya varias veces en el pasado. Ya hemos visto un retroceso de esta posición en numerosas ocasiones. Si esta nueva tendencia persiste, EURUSD podría dirigirse al nivel 1.1626 dentro de las próximas 11 horas. El rendimiento pasado no es indicativo de resultados futuros. Las pérdidas pueden exceder […]
Either a rebound or a breakout imminent on EURGBP

EURGBP is moving towards a line of 0.8650 which it has tested numerous times in the past. We have seen it retrace from this position in the past, so at this stage it isn’t clear whether it will breach this price or rebound as it did before. If EURGBP continues in its current trajectory, we […]
Either a rebound or a breakout imminent on EURGBP

EURGBP is moving towards a line of 0.8650 which it has tested numerous times in the past. We have seen it retrace from this position in the past, so at this stage it isn’t clear whether it will breach this price or rebound as it did before. If EURGBP continues in its current trajectory, we […]