Análisis Técnico Cripto
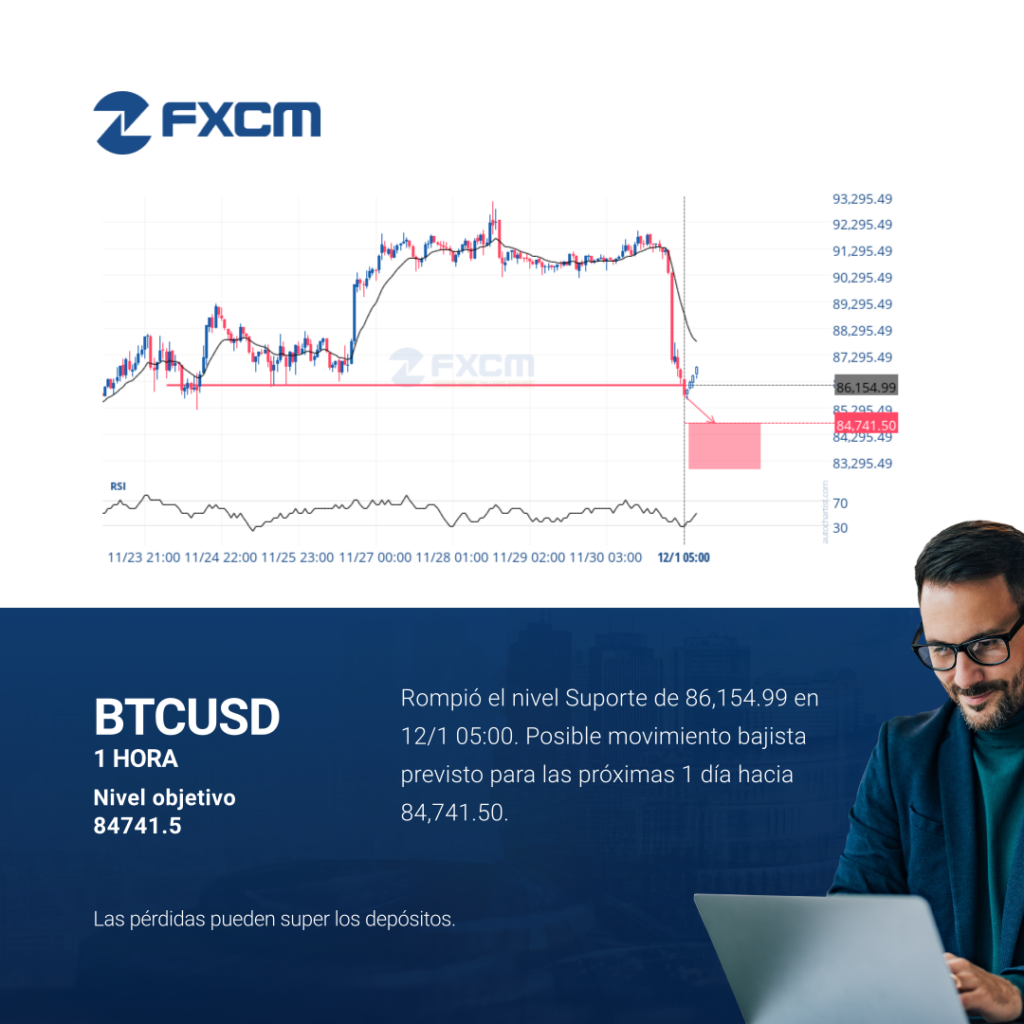
Rompió el nivel Suporte de 86,154.99 en 12/1 05:00. Posible movimiento bajista previsto para las próximas 1 día hacia 84,741.50. El rendimiento pasado no es indicativo de resultados futuros. Las pérdidas pueden exceder los fondos depositados.
Technical Analysis Forex

Broke through Resistance level of 0.8775 at 12/1 08:00. Possible bullish price movement forecast for the next 20 hours towards 0.8798. Past performance is not an indicator of future results. Losses can exceed deposits.
Technical Analysis Forex
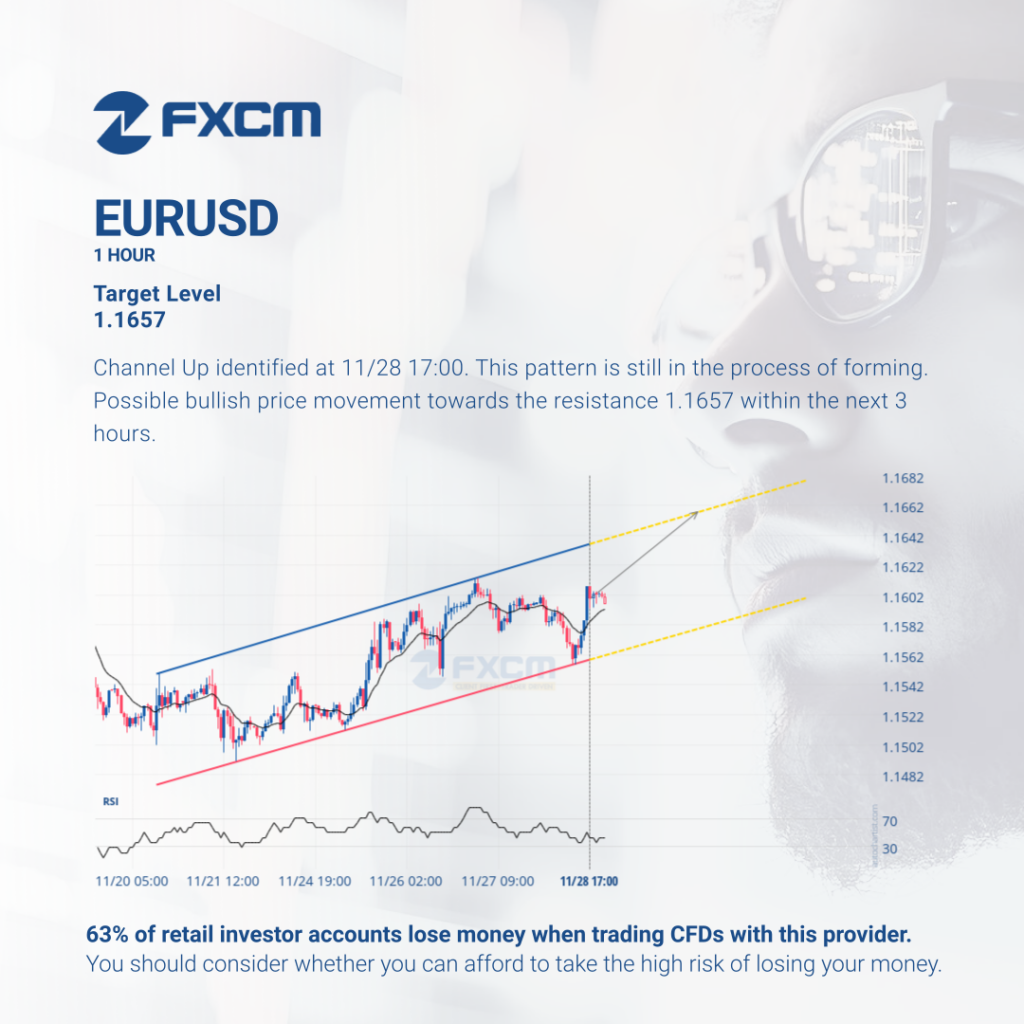
Channel Up identified at 11/28 17:00. This pattern is still in the process of forming. Possible bullish price movement towards the resistance 1.1657 within the next 3 hours. Past performance is not an indicator of future results. Losses can exceed deposits.
Índices de Análisis Técnico

Gartley Se ha identificado el patrón de Fibonacci en 11/30 08:00. Este patrón todavía está en el proceso de formarse. Un posible movimiento bajista hacia los niveles del objetivo que van de 84.2680 a 82.6520 dentro del siguiente 3 Horas. El rendimiento pasado no es indicativo de resultados futuros. Las pérdidas pueden exceder los fondos depositados.
Technical Analysis Indices

Gartley Fibonacci pattern identified at 11/30 08:00. This pattern is still in the process of forming. Possible bearish price movement towards target levels ranging from 84.2680 to 82.6520 within the next 6 hours. Past performance is not an indicator of future results. Trading leveraged products carries significant risk. Please refer to PDS and TMD on […]
Análisis Técnico Cripto
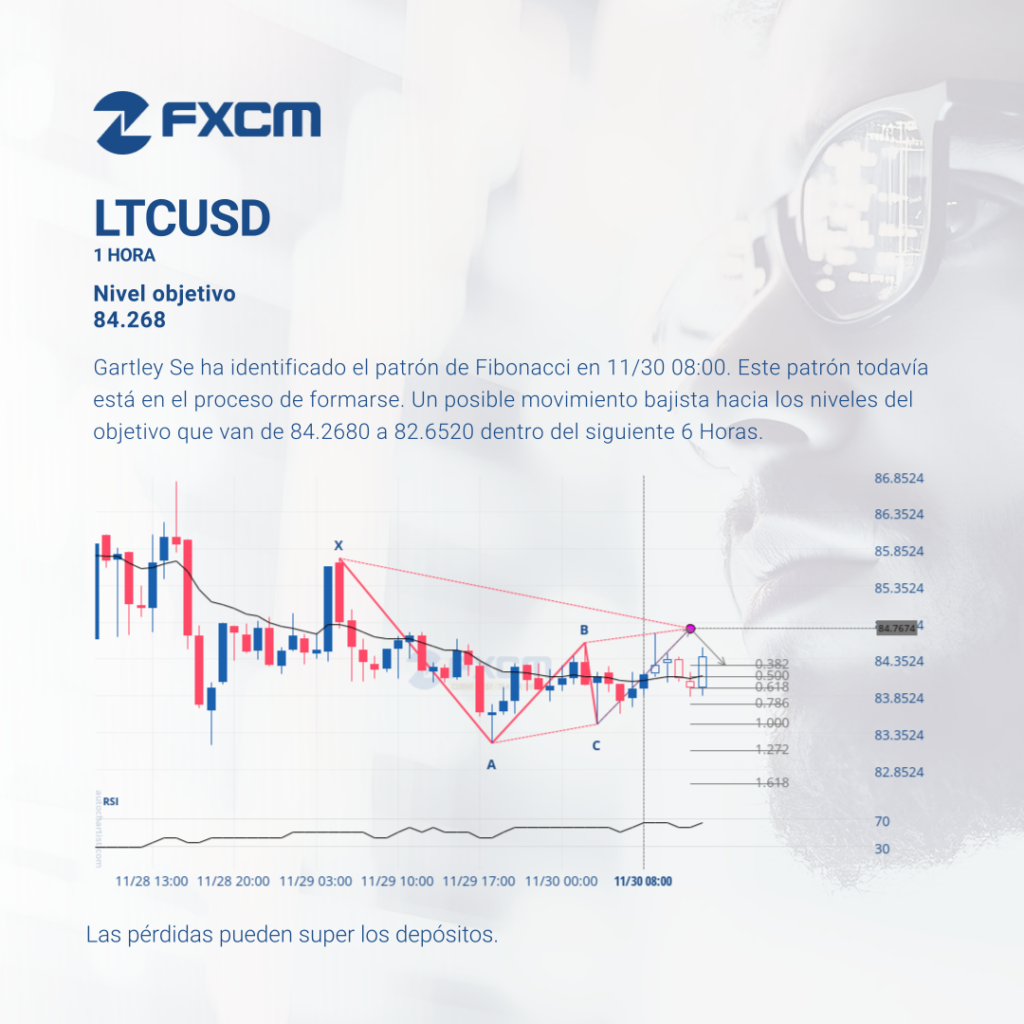
Gartley Se ha identificado el patrón de Fibonacci en 11/30 08:00. Este patrón todavía está en el proceso de formarse. Un posible movimiento bajista hacia los niveles del objetivo que van de 84.2680 a 82.6520 dentro del siguiente 6 Horas. El rendimiento pasado no es indicativo de resultados futuros. Las pérdidas pueden exceder los fondos depositados.
Índices de Análisis Técnico

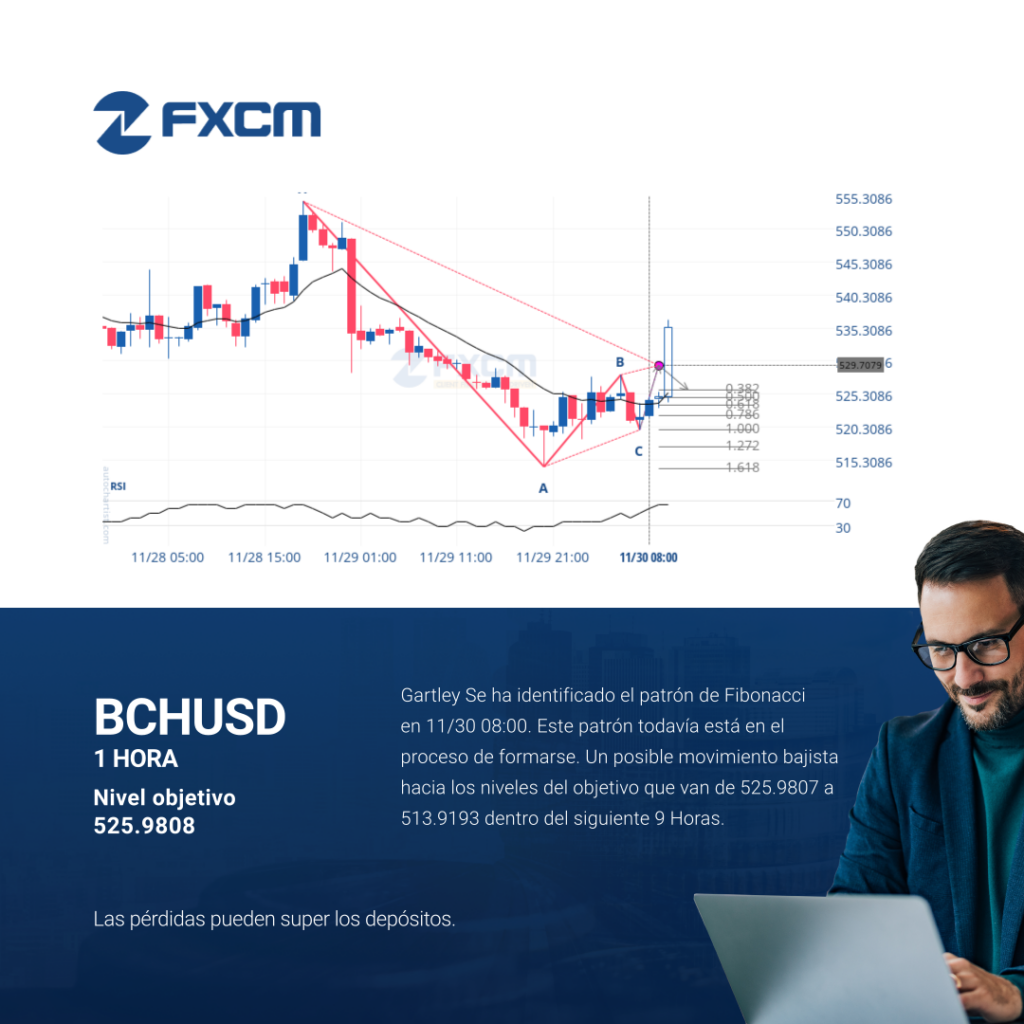
Gartley Se ha identificado el patrón de Fibonacci en 11/30 08:00. Este patrón todavía está en el proceso de formarse. Un posible movimiento bajista hacia los niveles del objetivo que van de 525.9807 a 513.9193 dentro del siguiente 9 Horas. El rendimiento pasado no es indicativo de resultados futuros. Las pérdidas pueden exceder los fondos depositados.
Análisis Técnico Cripto
Gartley Se ha identificado el patrón de Fibonacci en 11/30 08:00. Este patrón todavía está en el proceso de formarse. Un posible movimiento bajista hacia los niveles del objetivo que van de 525.9807 a 513.9193 dentro del siguiente 9 Horas. El rendimiento pasado no es indicativo de resultados futuros. Las pérdidas pueden exceder los fondos depositados.
Technical Analysis Forex
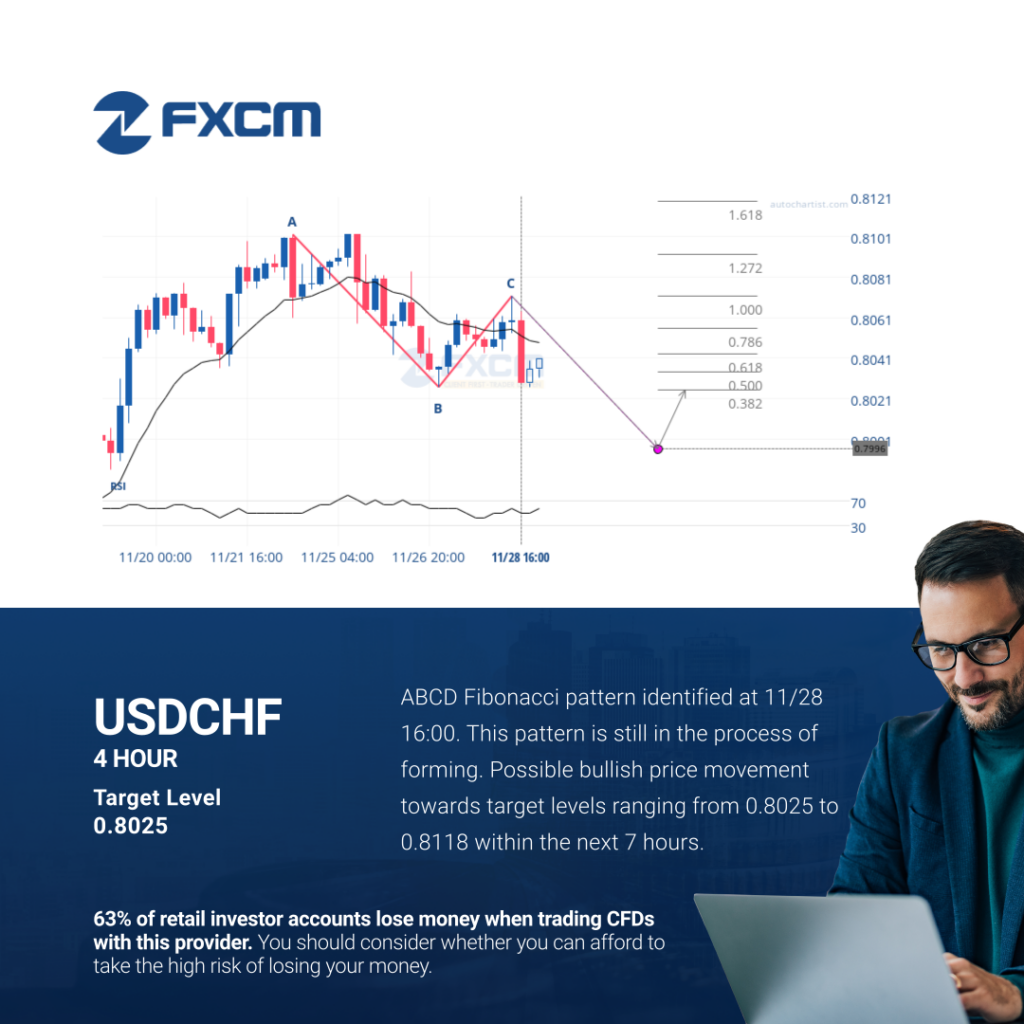
ABCD Fibonacci pattern identified at 11/28 16:00. This pattern is still in the process of forming. Possible bullish price movement towards target levels ranging from 0.8025 to 0.8118 within the next 7 hours. Past performance is not an indicator of future results. Losses can exceed deposits.
Análisis Técnico Cripto
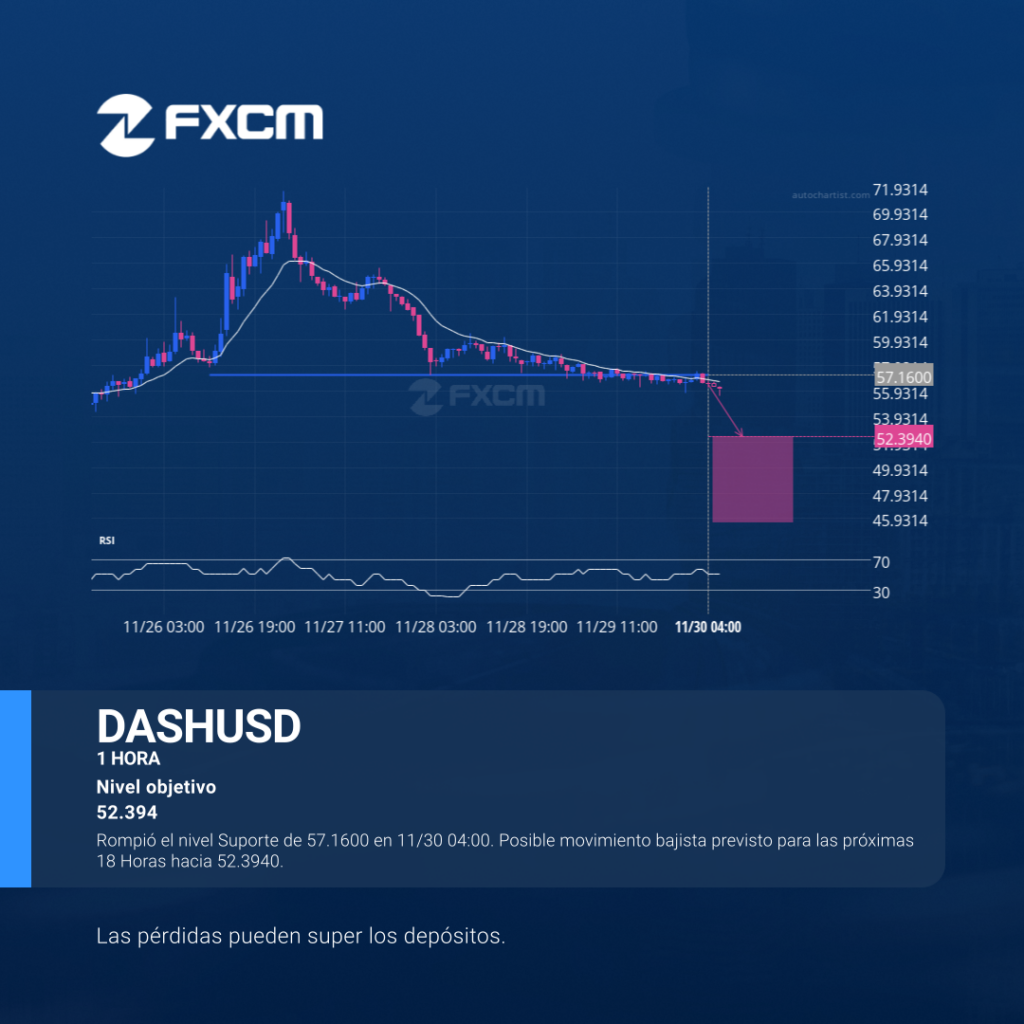
Rompió el nivel Suporte de 57.1600 en 11/30 04:00. Posible movimiento bajista previsto para las próximas 18 Horas hacia 52.3940. El rendimiento pasado no es indicativo de resultados futuros. Las pérdidas pueden exceder los fondos depositados.