ESP35 breakout through resistance
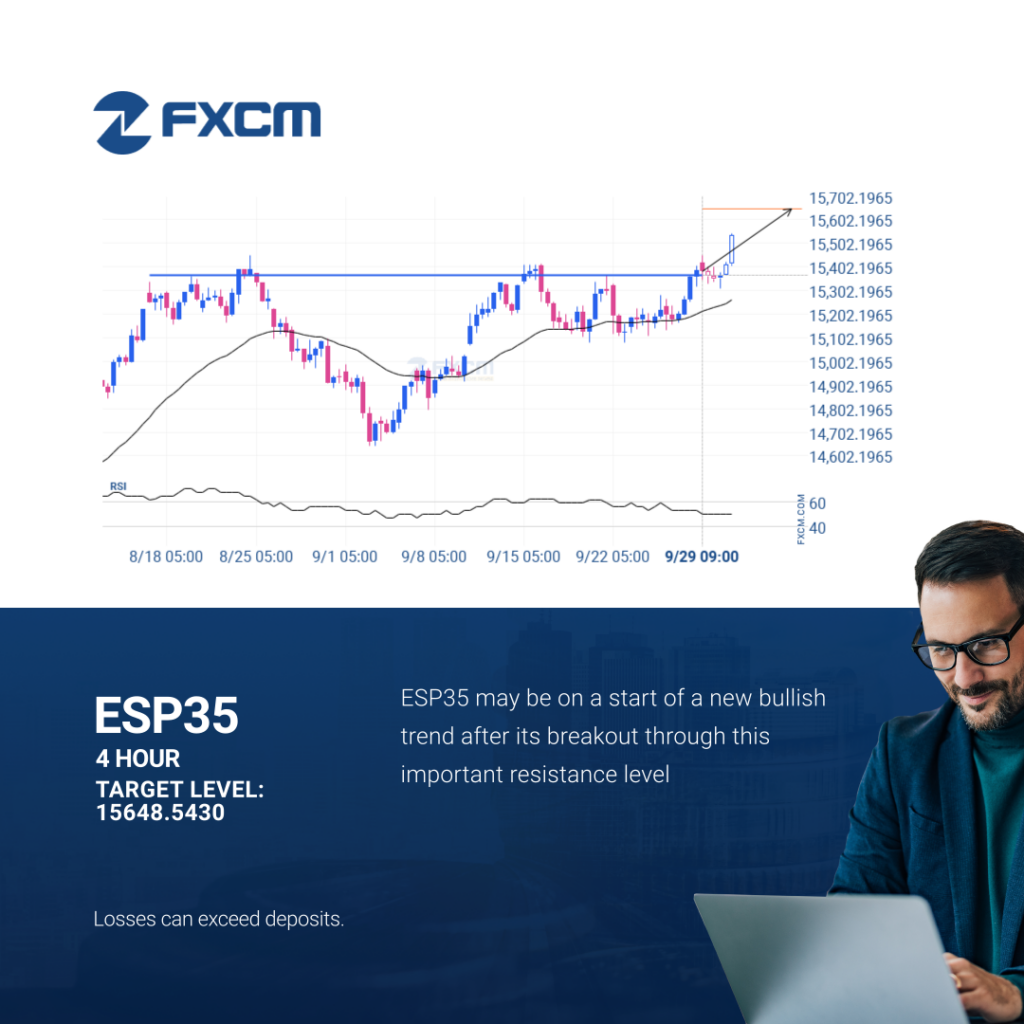
The breakout of ESP35 through the 15365.6602 price line is a breach of an important psychological price that is has tested numerous in the past. If this breakout persists, ESP35 could test 15648.5430 within the next 3 days. One should always be cautious before placing a trade, wait for confirmation of the breakout. Past performance […]
EURUSD – Patrón de gráfico Continuation – Bandera

El patrón de Bandera emergente en su ola final se identificó en el gráfico de 1 Hora de EURUSD. Después de un fuerte movimiento alcista, encontramos que EURUSD se dirige hacia la línea del triángulo superior con una posible resistencia en 1.1768. Si resulta que el nivel de resistencia aguanta, el patrón de Bandera sugiere […]
A potential bullish movement on EURUSD

EURUSD is trapped in a Flag formation, implying that a breakout is Imminent. This is a great trade-setup for both trend and swing traders. It is now approaching a support line that has been tested in the past. Divergence opportunists may be very optimistic about a possible breakout and this may be the start of […]
BTCUSD – Continuation Patrón de gráfico – Canal alcista

El patrón de Canal alcista emergente en su ola final se identificó en el gráfico de 1 Hora de BTCUSD. Después de un fuerte movimiento alcista, encontramos que BTCUSD se dirige hacia la línea del triángulo superior con una posible resistencia en 117422.8726. Si resulta que el nivel de resistencia aguanta, el patrón de Canal […]
A potential bullish movement on EURUSD

EURUSD is trapped in a Flag formation, implying that a breakout is Imminent. This is a great trade-setup for both trend and swing traders. It is now approaching a support line that has been tested in the past. Divergence opportunists may be very optimistic about a possible breakout and this may be the start of […]
bearish technical pattern on XAGUSD 1 hour
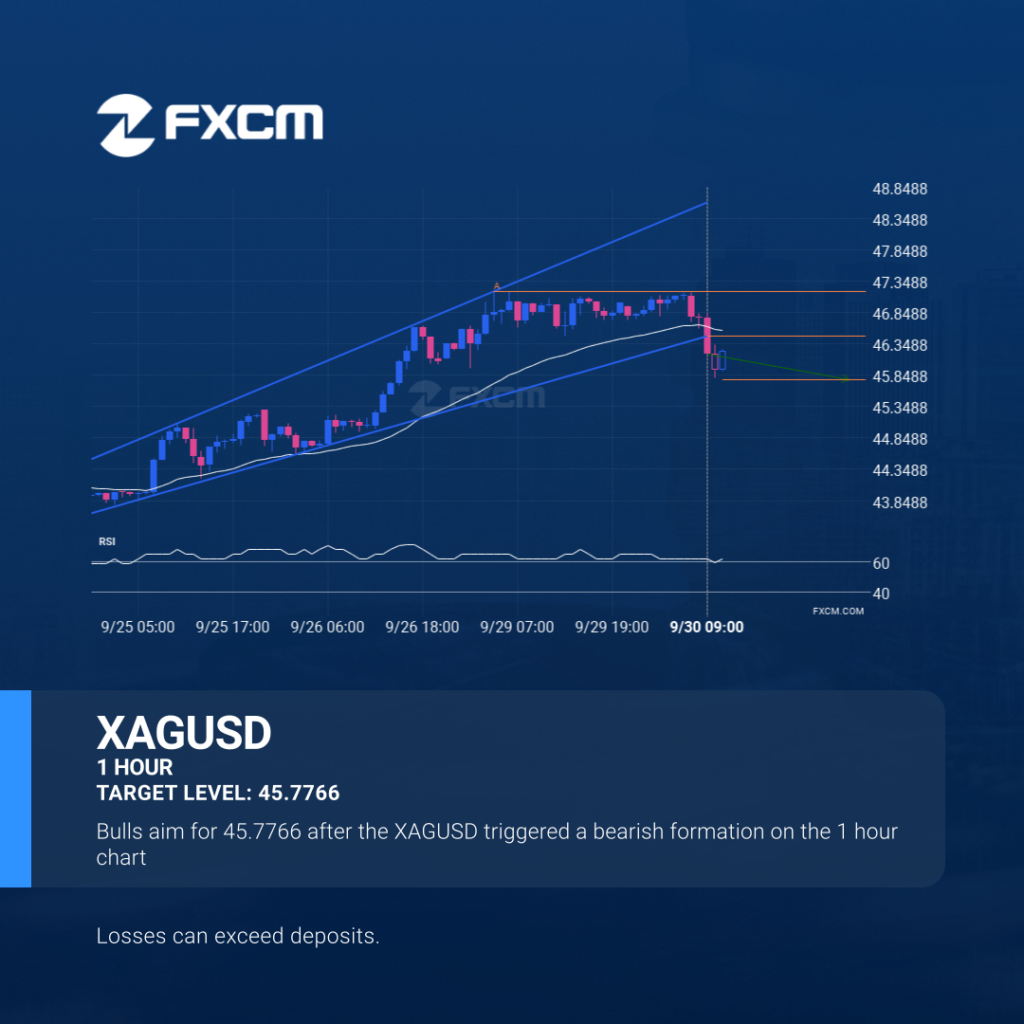
Channel Up pattern identified on XAGUSD has broken through a support level with the price momentum continuing to move in an downward direction. A solid trading opportunity continues with the price expected to reach 45.7766 in the next 21. Past performance is not an indicator of future results. Losses can exceed deposits.
Patrón técnico bajista en XAGUSD 1 Hora
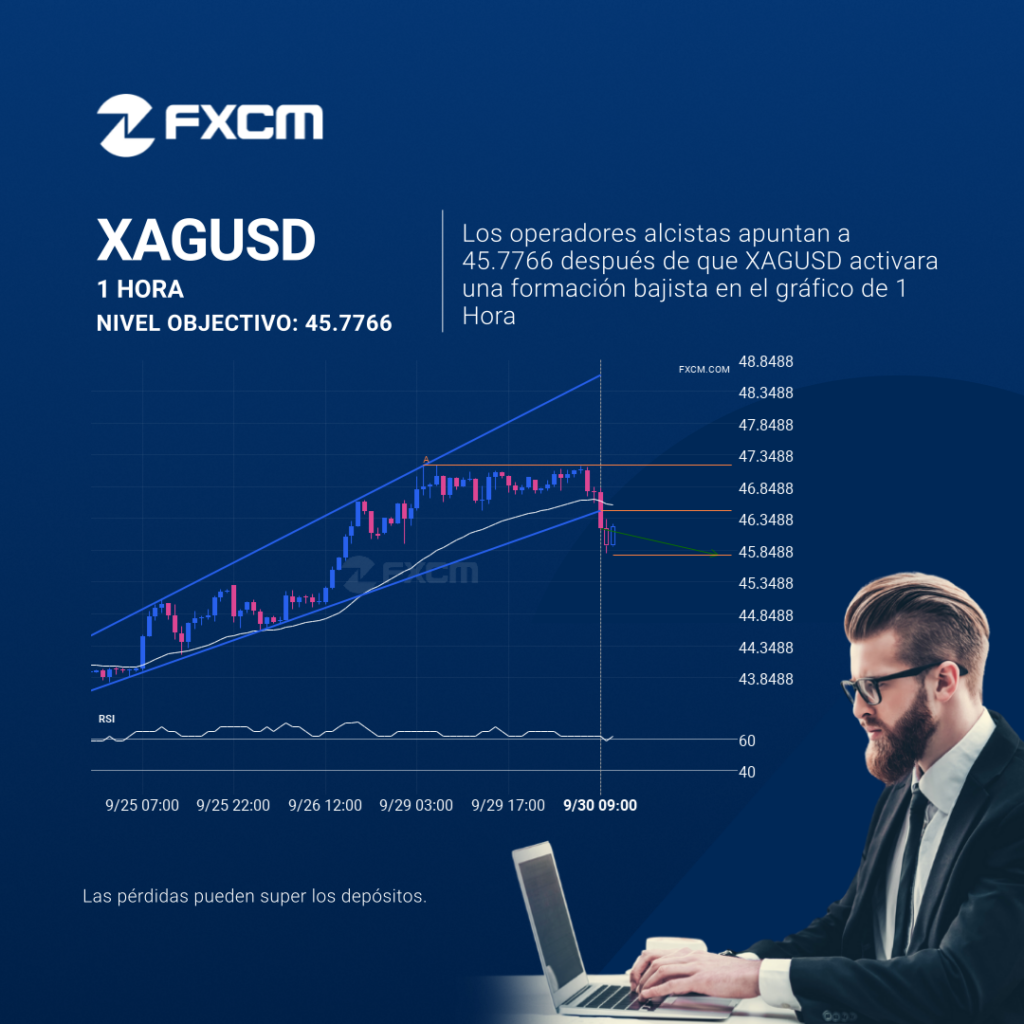
El patrón de Canal alcista identificado en XAGUSD ha atravesado un nivel de soporte y el impulso del precio continúa moviéndose en dirección bajista. Continúa siendo una buena oportunidad de trading y se espera que el precio alcance 45.7766 en un plazo de 21. El rendimiento pasado no es indicativo de resultados futuros. Las pérdidas […]
bearish technical pattern on XAGUSD 1 hour
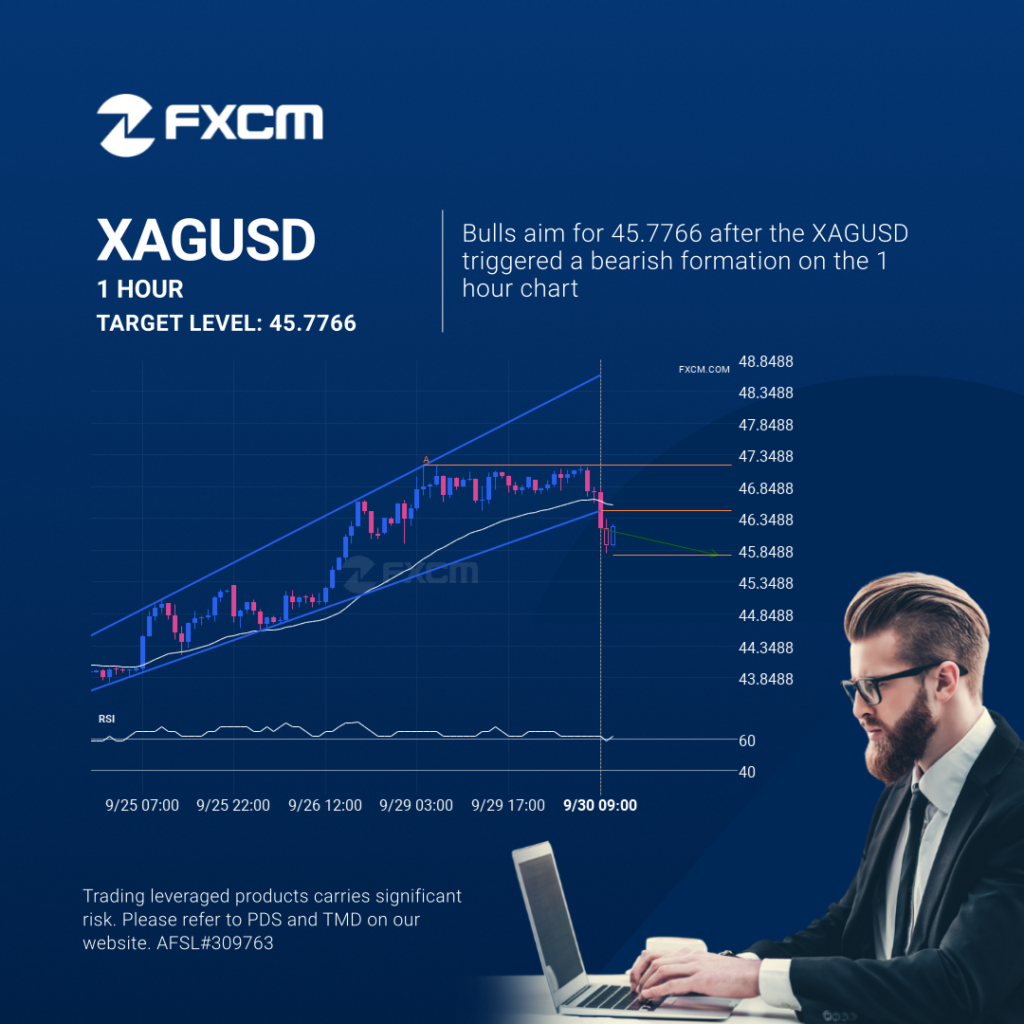
Channel Up pattern identified on XAGUSD has broken through a support level with the price momentum continuing to move in an downward direction. A solid trading opportunity continues with the price expected to reach 45.7766 in the next 21. Past performance is not an indicator of future results. Trading leveraged products carries significant risk. Please […]
USDJPY – Patrón de gráfico Continuation – Canal bajista
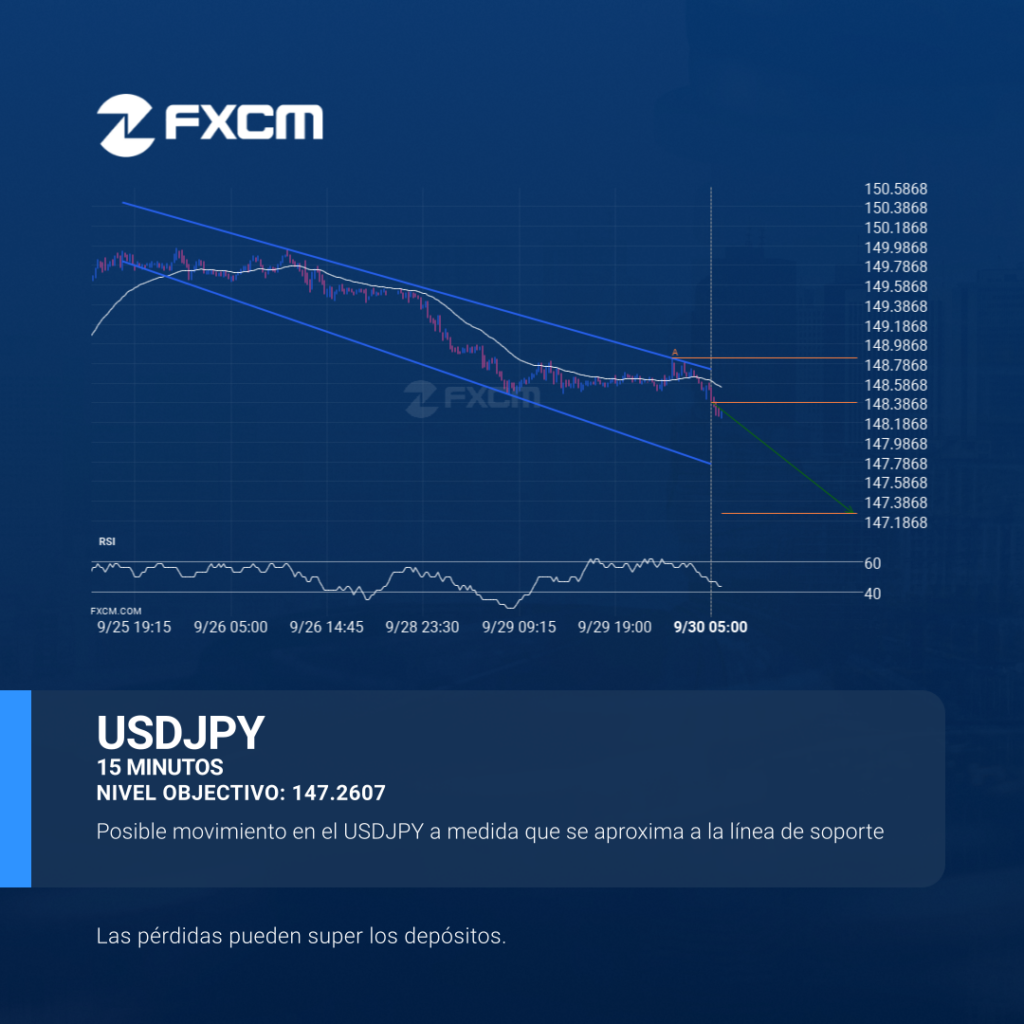
Se ha detectado un patrón Canal bajista en formación en USDJPY en el gráfico de 15 Minutos. Existe la posibilidad de un movimiento hacia 147.2607 en las próximas velas. Una vez que alcance resistance, el precio puede continuar su tendencia bajista o revertir a los niveles actuales de precio. El rendimiento pasado no es indicativo […]
A potential bearish movement on USDJPY
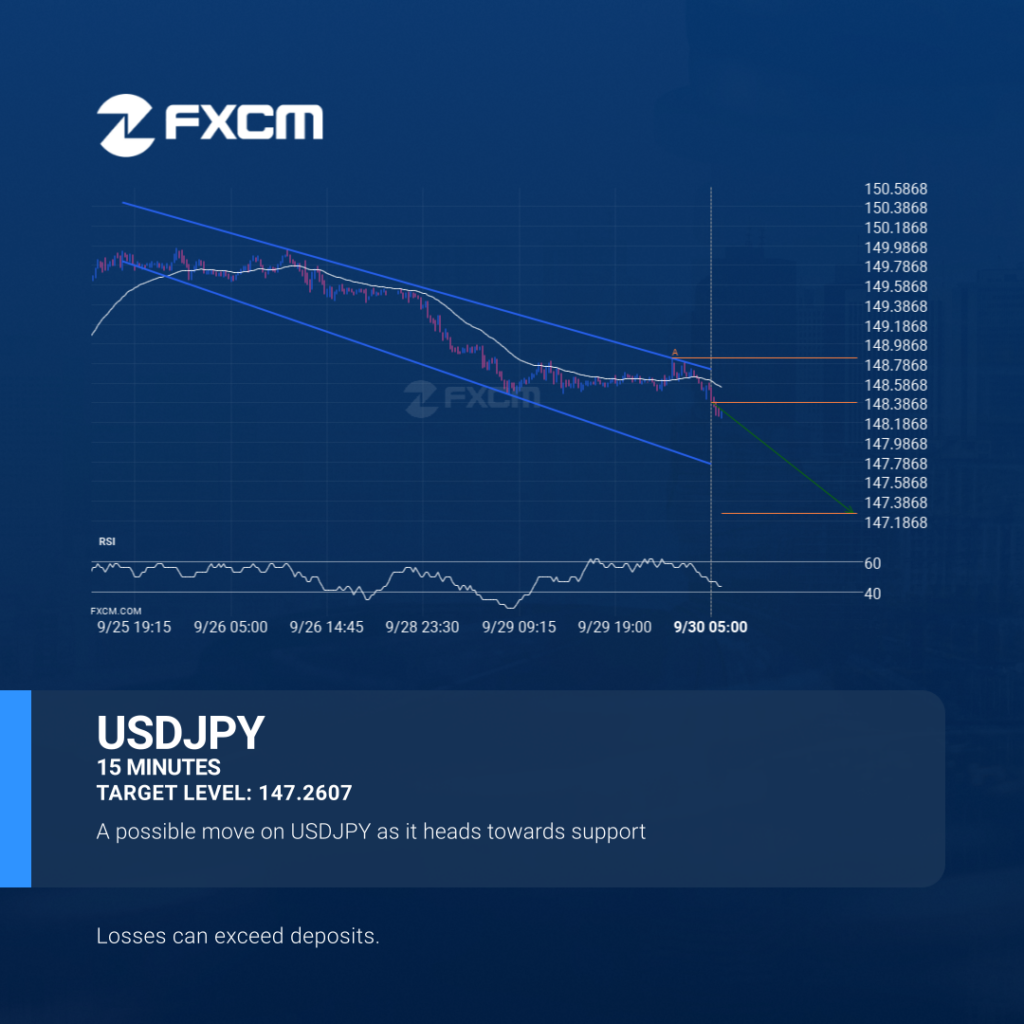
An emerging Channel Down has been detected on USDJPY on the 15 Minutes chart. There is a possible move towards 147.2607 next few candles. Once reaching resistance it may continue its bearish run or reverse back to current price levels. Past performance is not an indicator of future results. Losses can exceed deposits.