bullish technical pattern on GBPUSD 4 hour
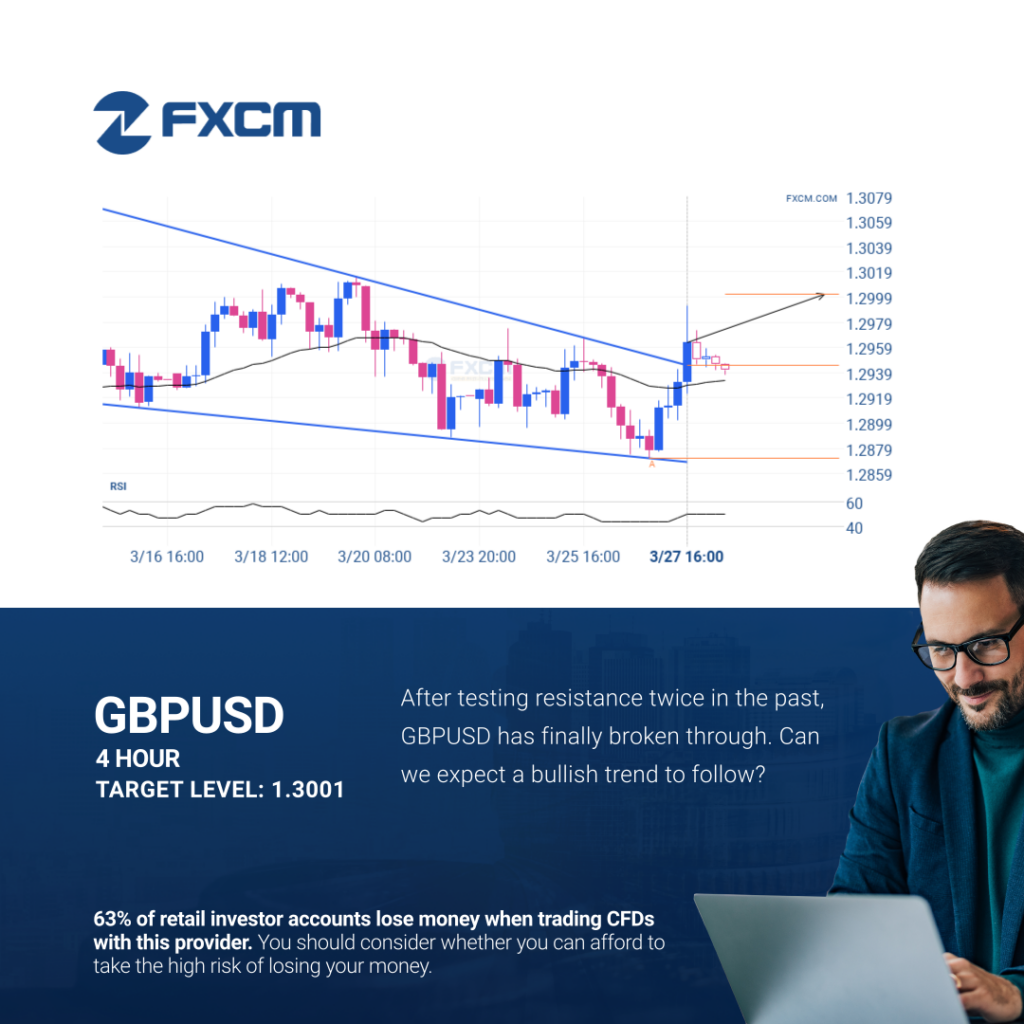
GBPUSD has broken through a resistance line of a Falling Wedge chart pattern. If this breakout holds true, we may see the price of GBPUSD testing 1.3001 within the next 3 days. But don’t be so quick to trade, it has tested this line in the past, so you should confirm the breakout before taking […]
bullish technical pattern on GBPUSD 4 hour
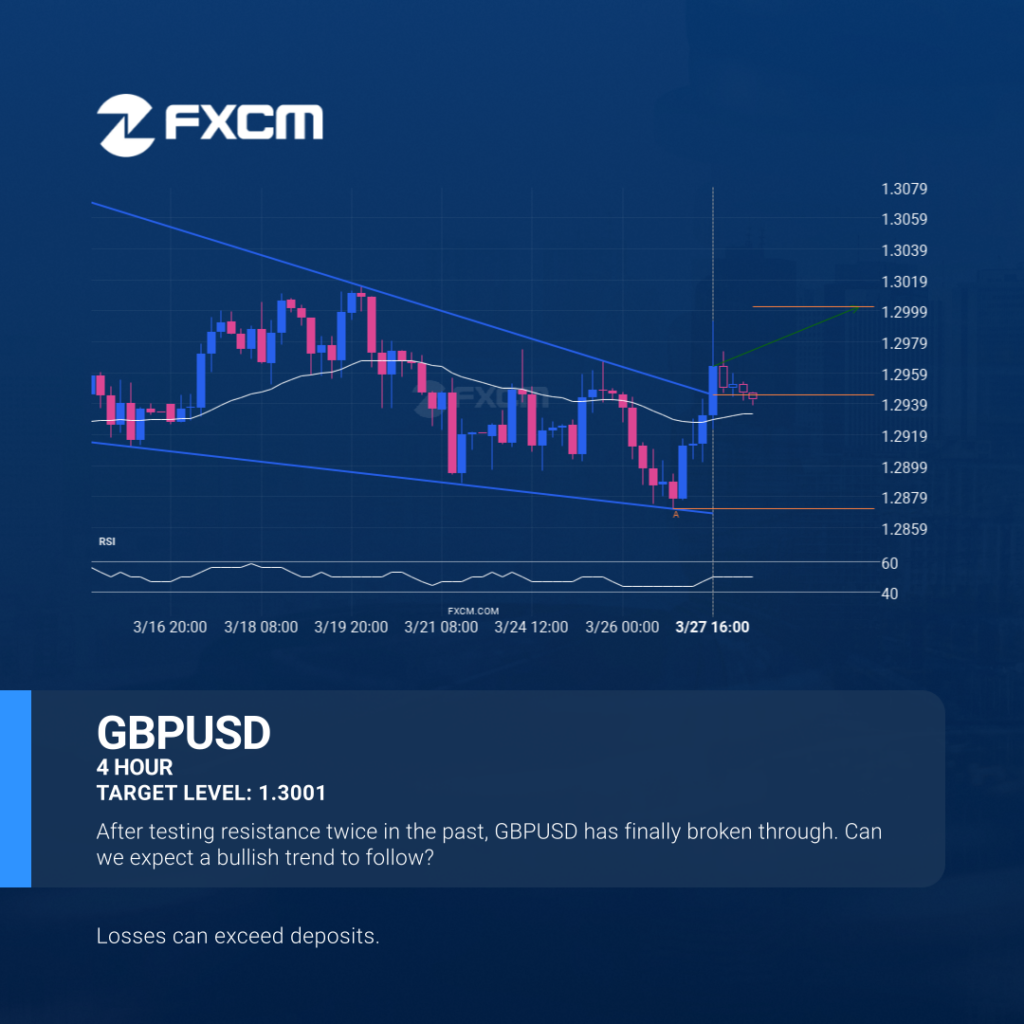
GBPUSD has broken through a resistance line of a Falling Wedge chart pattern. If this breakout holds true, we may see the price of GBPUSD testing 1.3001 within the next 3 days. But don’t be so quick to trade, it has tested this line in the past, so you should confirm the breakout before taking […]
bullish technical pattern on GBPUSD 4 hour
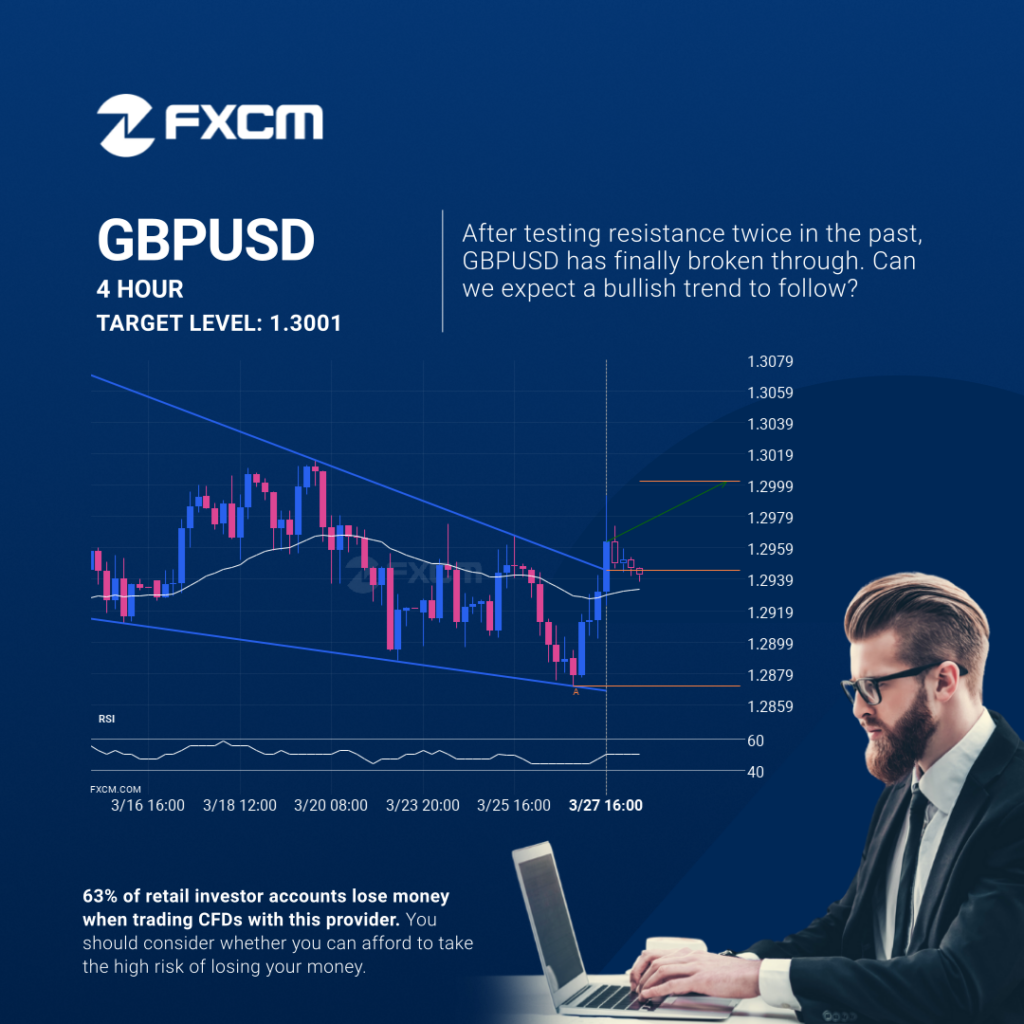
GBPUSD has broken through a resistance line of a Falling Wedge chart pattern. If this breakout holds true, we may see the price of GBPUSD testing 1.3001 within the next 3 days. But don’t be so quick to trade, it has tested this line in the past, so you should confirm the breakout before taking […]
A possible start of a bearish trend on HKG33
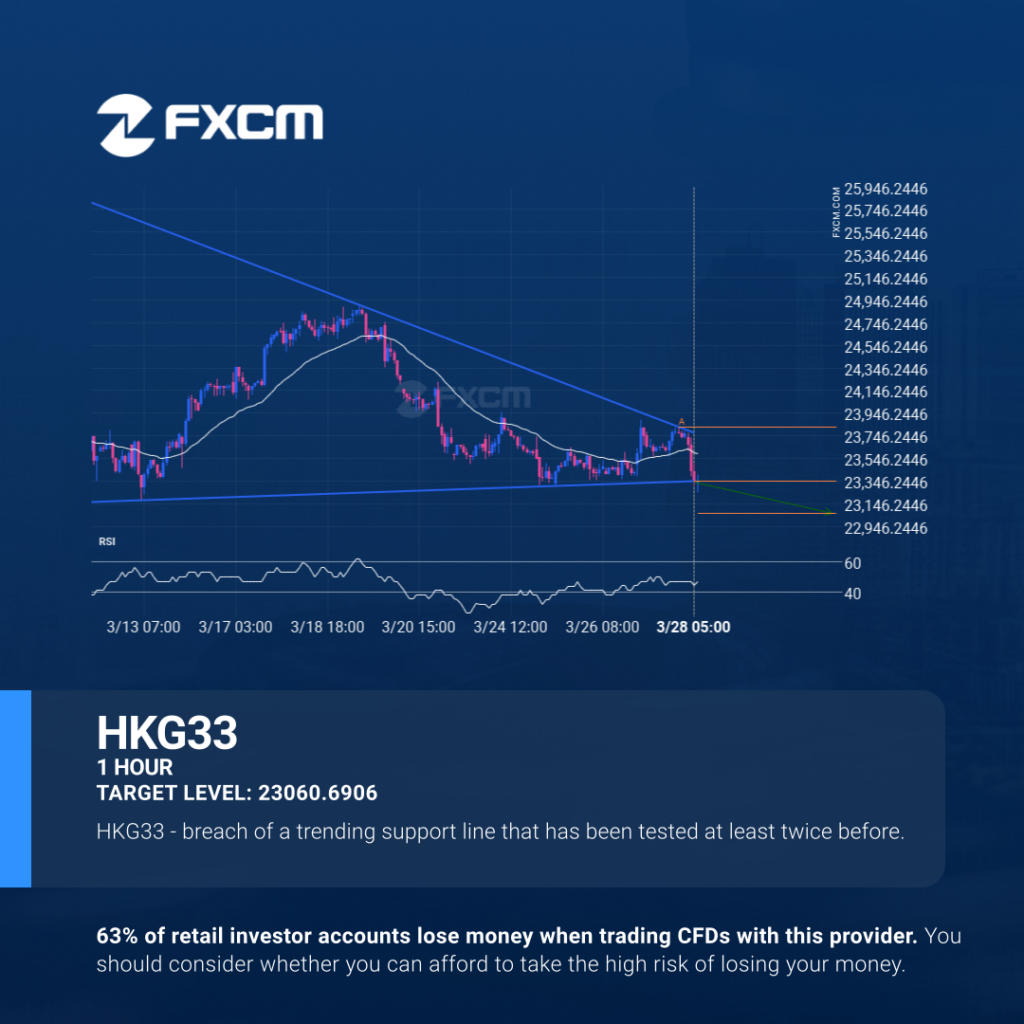
HKG33 has broken through the support line which it has tested twice in the past. We have seen it retrace from this line before, so one should wait for confirmation of the breakout before trading. If this new trend persists, a target level of around 23060.6906 may materialize within the next 3 days. Past performance […]
Patrón técnico alcista en GBPUSD 4 Hora
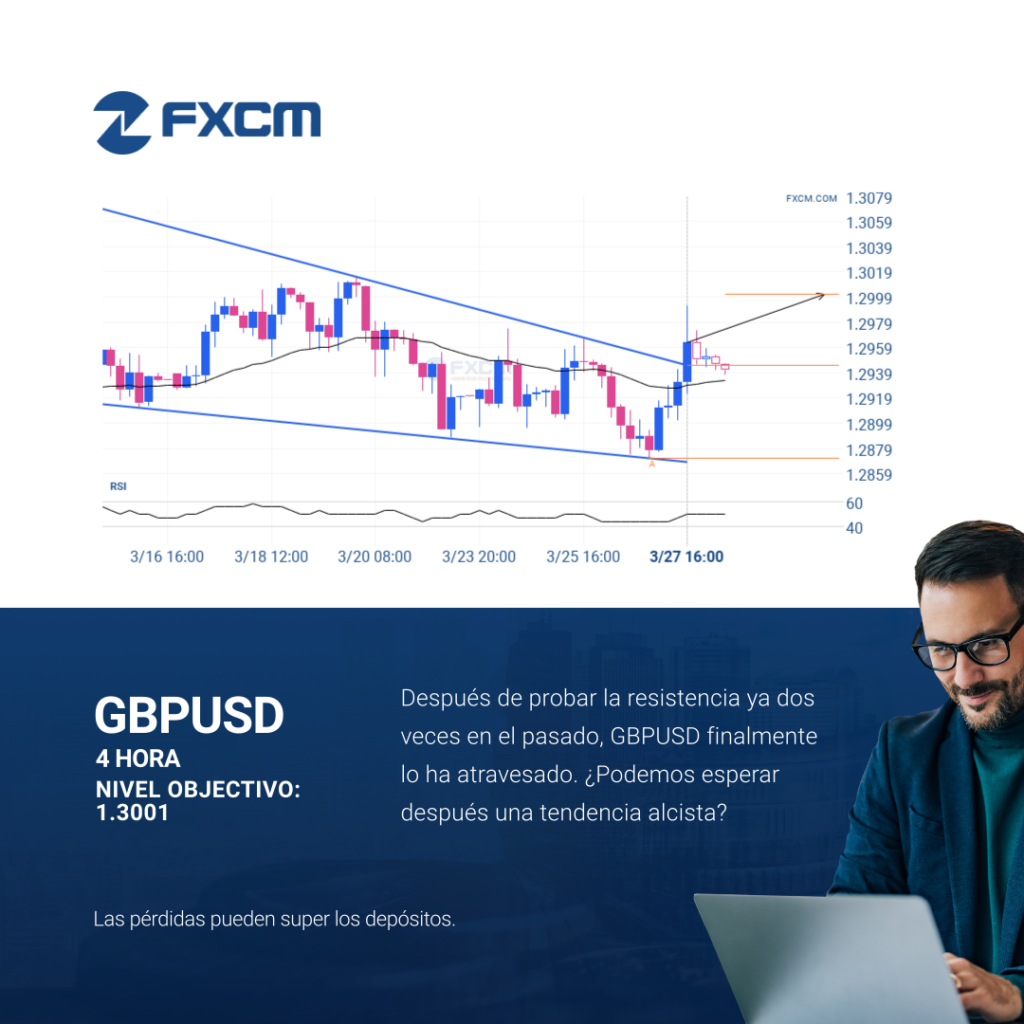
El GBPUSD ha atravesado una línea de resistencia de un patrón de gráfico que corresponde a un Cuña descendente. Si esta irrupción se mantiene, podríamos ver el precio del GBPUSD probando el nivel de 1.3001 dentro de las próximas 3 días. Pero no se apresure si desea operar, porque ya ha probado esta línea en […]
A possible start of a bearish trend on HKG33

HKG33 has broken through the support line which it has tested twice in the past. We have seen it retrace from this line before, so one should wait for confirmation of the breakout before trading. If this new trend persists, a target level of around 23060.6906 may materialize within the next 3 days. Past performance […]
Un posible comienzo de una tendencia bajista en el HKG33
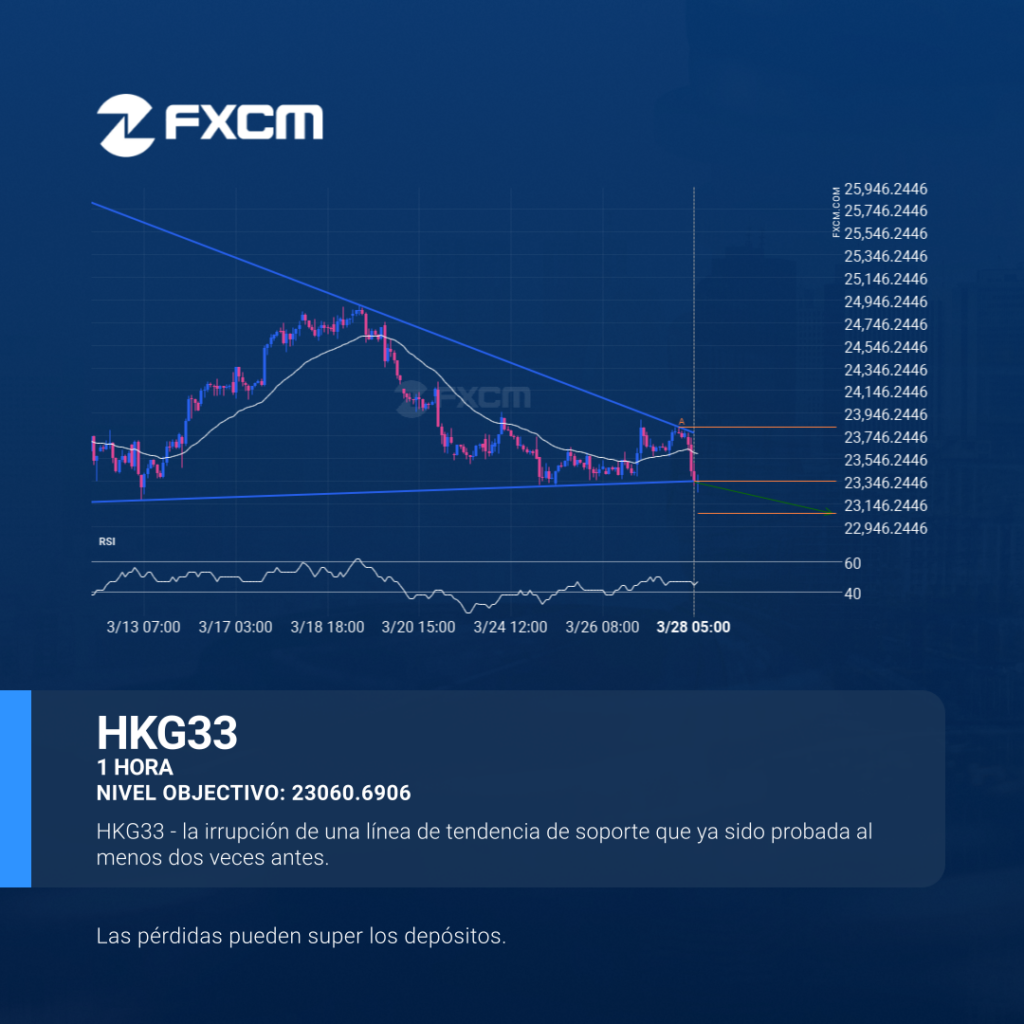
El HKG33 ha atravesado la línea de soporte, que ya se ha probado dos veces en el pasado. Hemos visto, anteriormente, un retroceso desde esta posición, así que debemos esperar la confirmación de la ruptura antes de operar. Si esta nueva tendencia persiste, un nivel objetivo alrededor de 23060.6906 podría materializarse dentro de las próximas […]
A possible start of a bearish trend on HKG33
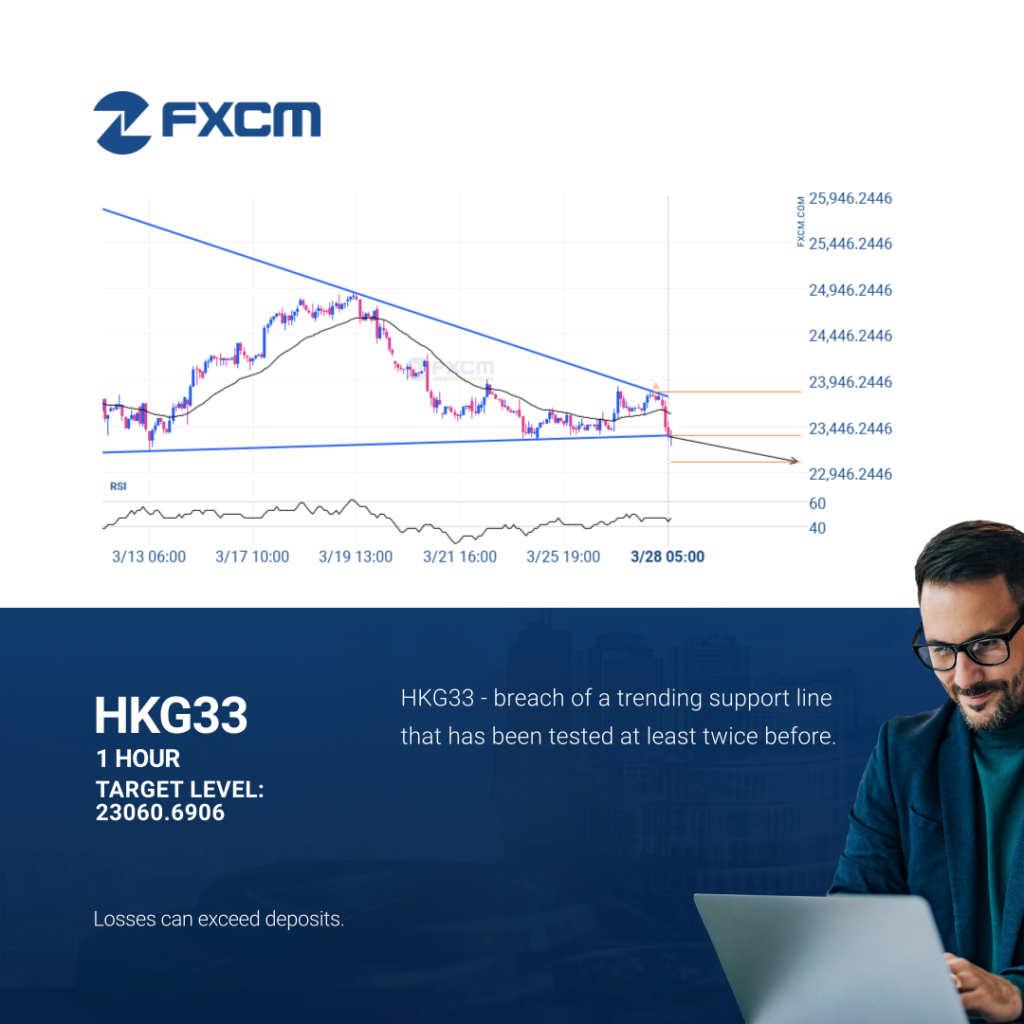
HKG33 has broken through the support line which it has tested twice in the past. We have seen it retrace from this line before, so one should wait for confirmation of the breakout before trading. If this new trend persists, a target level of around 23060.6906 may materialize within the next 3 days. Past performance […]
Inminente recuperación o irrupción del AUDUSD
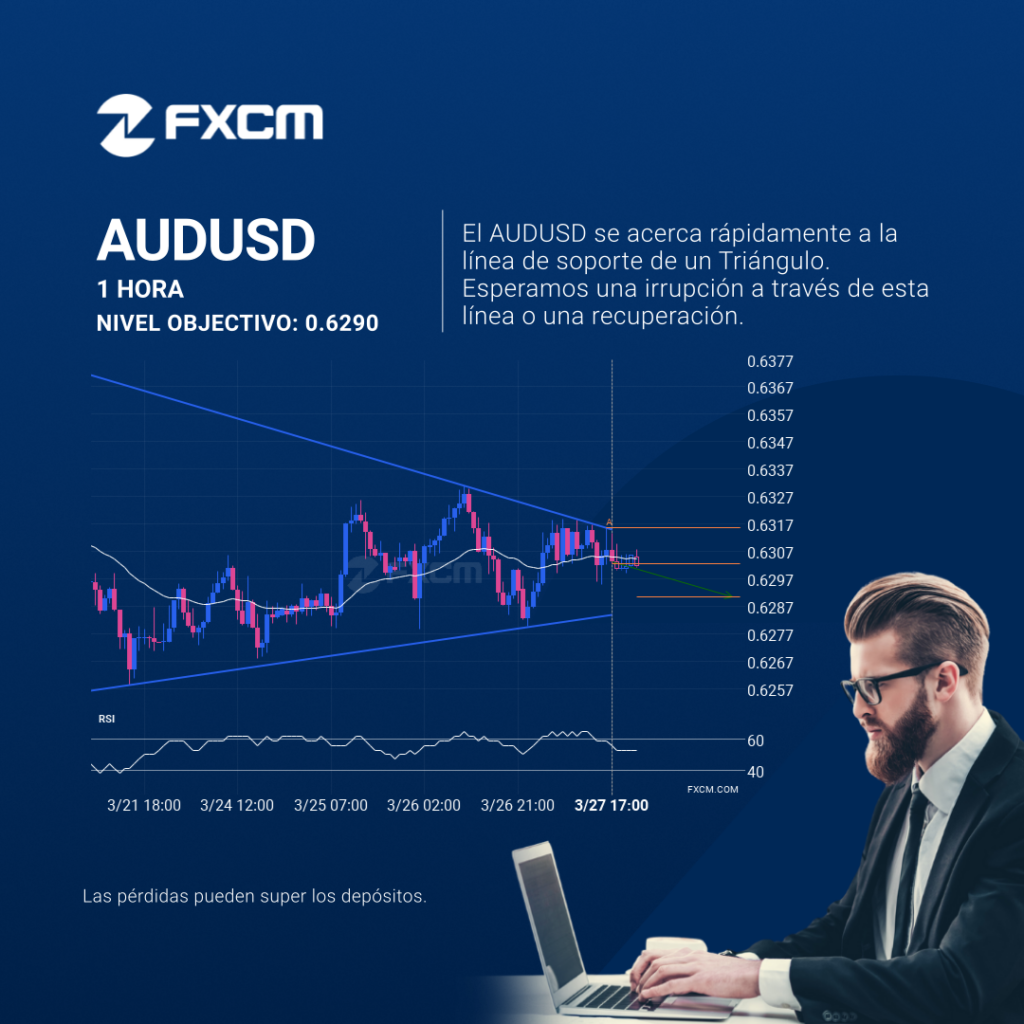
Se ha detectado un patrón Triángulo en formación en AUDUSD en el gráfico de 1 Hora. Existe la posibilidad de un movimiento hacia 0.6290 en las próximas velas. Una vez que alcance resistance, el precio puede continuar su tendencia bearish o revertir a los niveles actuales de precio. El rendimiento pasado no es indicativo de […]
Either a rebound or a breakout imminent on AUDUSD
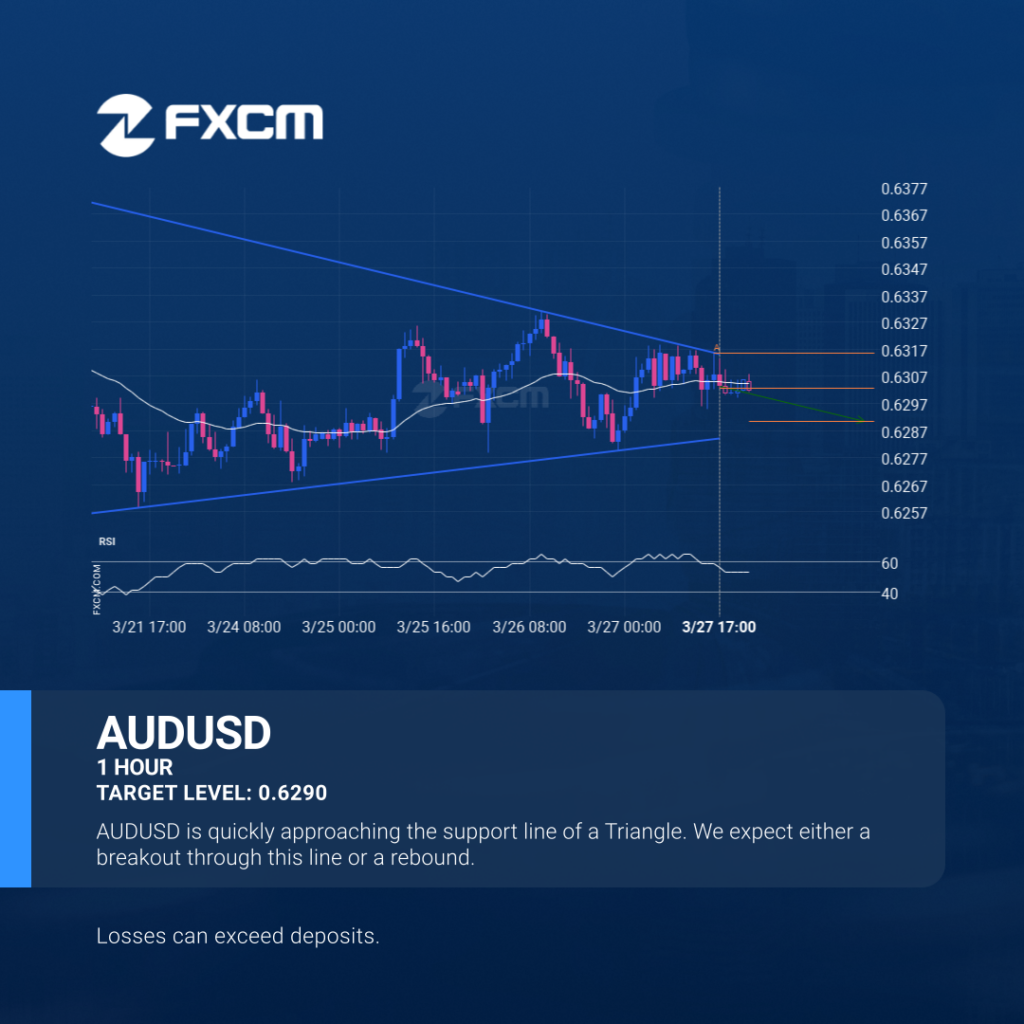
An emerging Triangle has been detected on AUDUSD on the 1 hour chart. There is a possible move towards 0.6290 next few candles. Once reaching resistance it may continue its bearish run or reverse back to current price levels. Past performance is not an indicator of future results. Losses can exceed deposits.