Rare opportunity on AUDUSD – extreme bullish movement
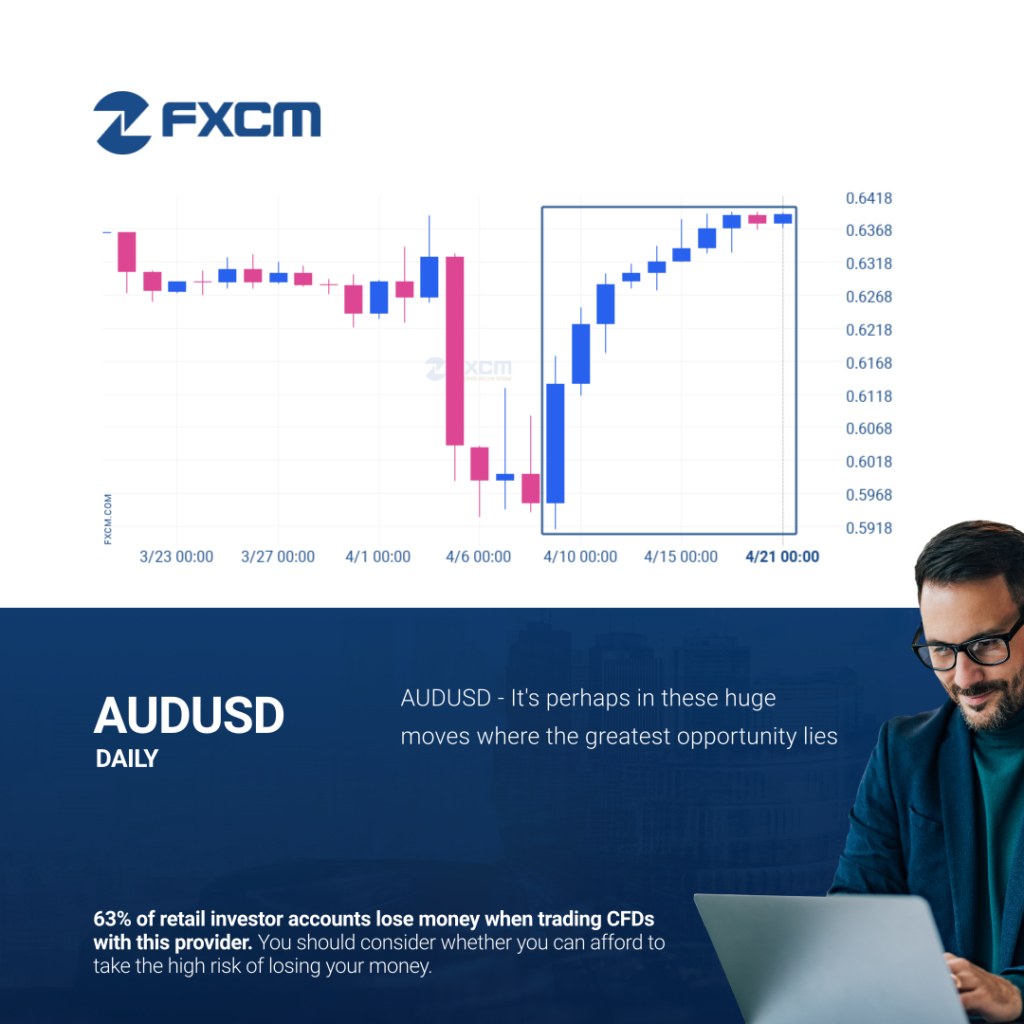
AUDUSD rose sharply for 12 days – which is an excessively big movement for this instrument; exceeding the 98% of past price moves. Even if this move is a sign of a new trend in AUDUSD there is a chance that we will witness a correction, no matter how brief. Past performance is not an […]
Rare opportunity on AUDUSD – extreme bullish movement
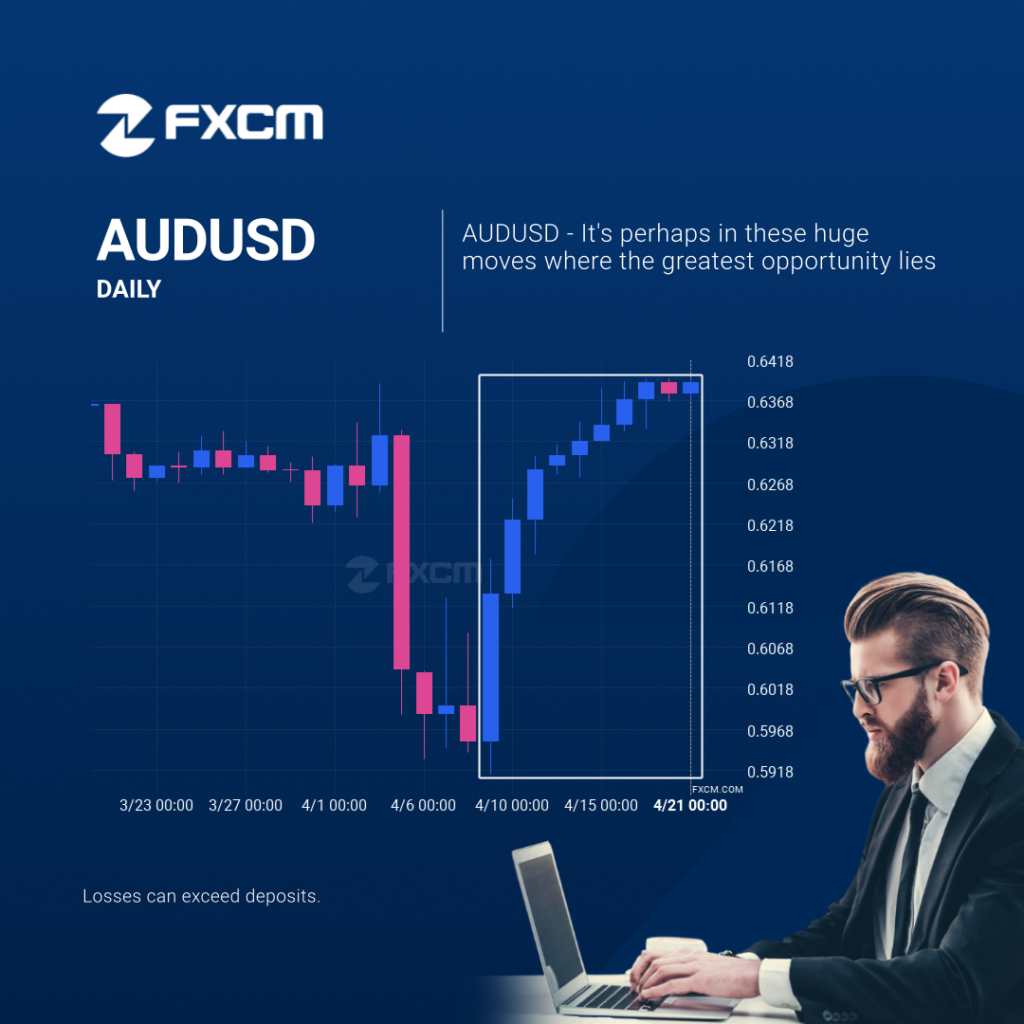
AUDUSD rose sharply for 12 days – which is an excessively big movement for this instrument; exceeding the 98% of past price moves. Even if this move is a sign of a new trend in AUDUSD there is a chance that we will witness a correction, no matter how brief. Past performance is not an […]
GBPUSD – Extreme movement, a rare opportunity
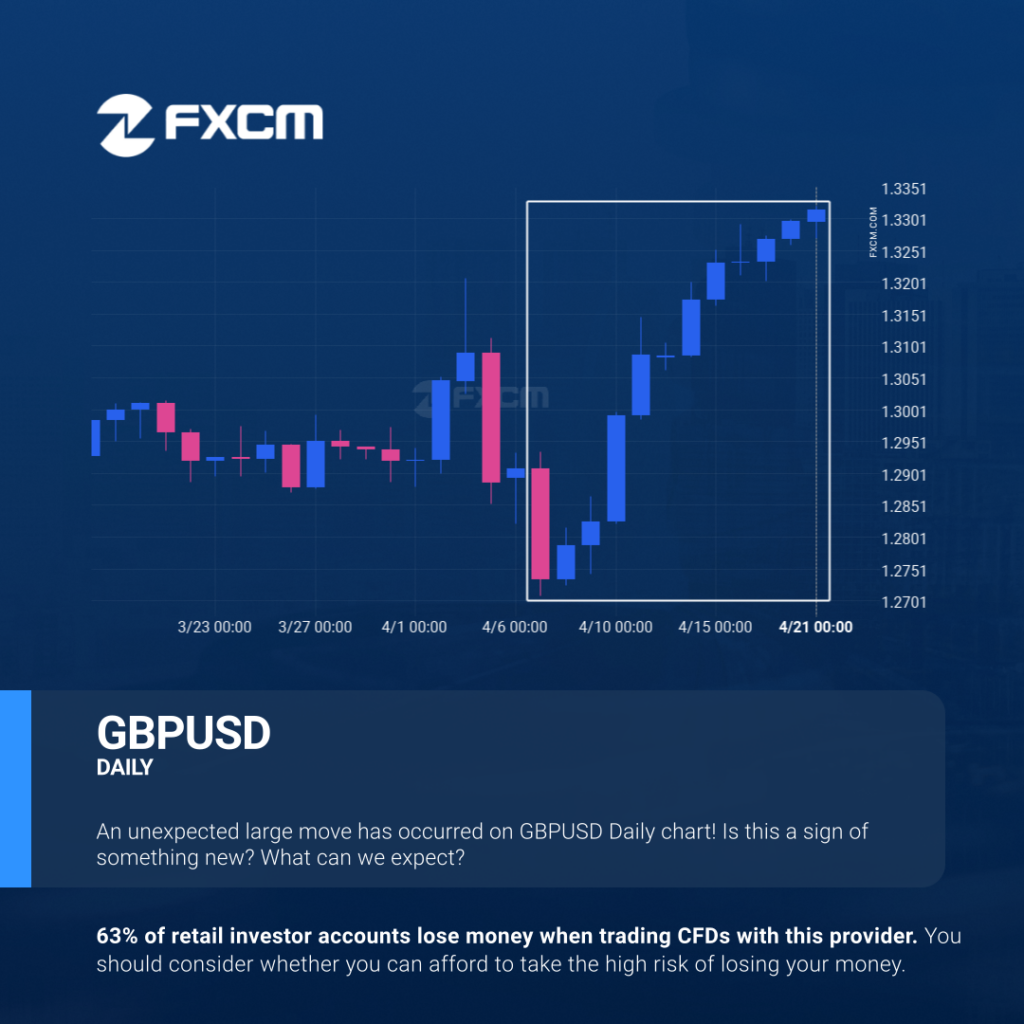
GBPUSD has moved higher by 4.57% from 1.27331 to 1.33148 in the last 15 days. Past performance is not an indicator of future results. 63% of retail investor accounts lose money when trading CFDs with this provider. You should consider whether you can afford to take the high risk of losing your money.
GBPUSD – Extreme movement, a rare opportunity
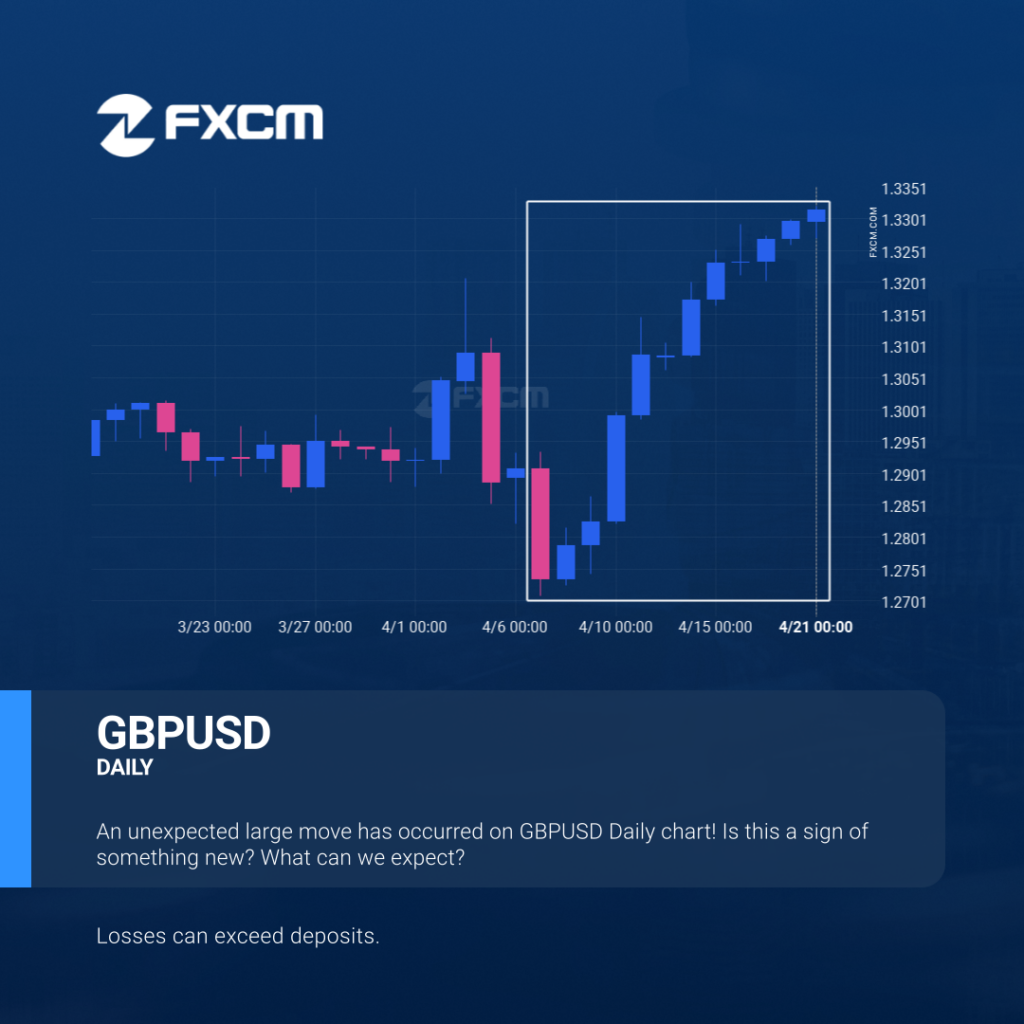
GBPUSD has moved higher by 4.57% from 1.27331 to 1.33148 in the last 15 days. Past performance is not an indicator of future results. Losses can exceed deposits.
GBPUSD: movimiento extremo, una oportunidad excepcional
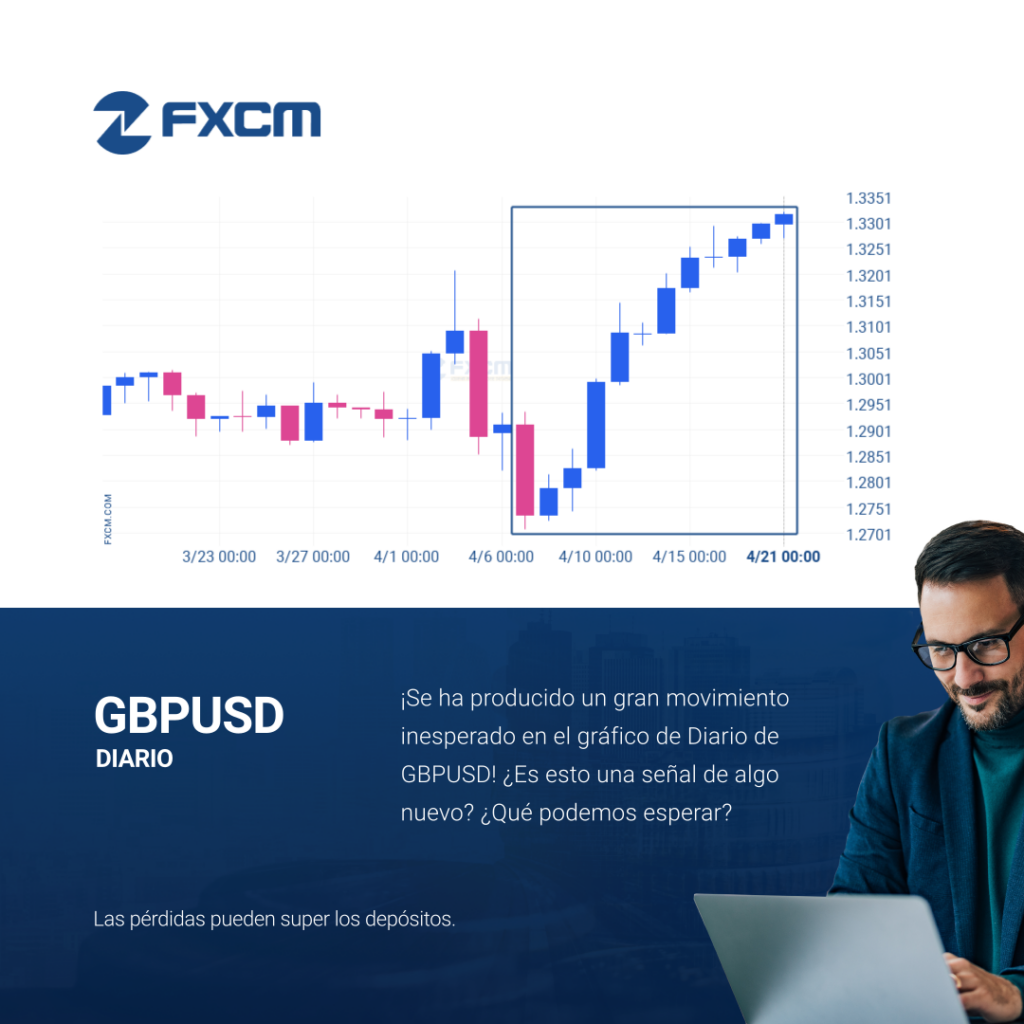
El GBPUSD ha ascendido un 4,57% de 1.27331 a 1.33148 en 15 días. El rendimiento pasado no es indicativo de resultados futuros. Las pérdidas pueden exceder los fondos depositados.
GBPUSD – Extreme movement, a rare opportunity
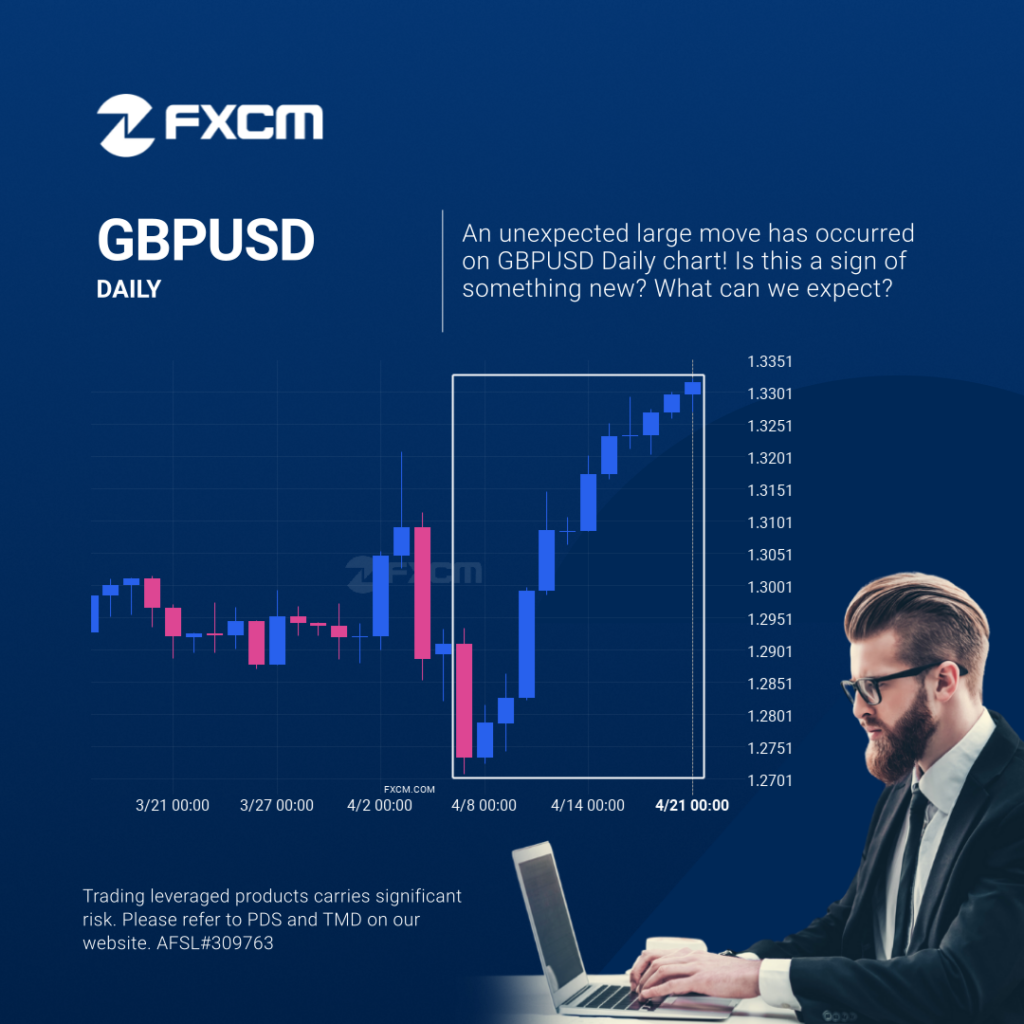
GBPUSD has moved higher by 4.57% from 1.27331 to 1.33148 in the last 15 days. Past performance is not an indicator of future results. Trading leveraged products carries significant risk. Please refer to PDS and TMD on our website. AFSL#309763
Is EURUSD likely to correct after this massive movement?
An unexpected large move has occurred on EURUSD Daily chart beginning at 1.07411 and ending at 1.144915. Is this a sign of something new? What can we expect in the future? Past performance is not an indicator of future results. Losses can exceed deposits.
Is EURUSD likely to correct after this massive movement?
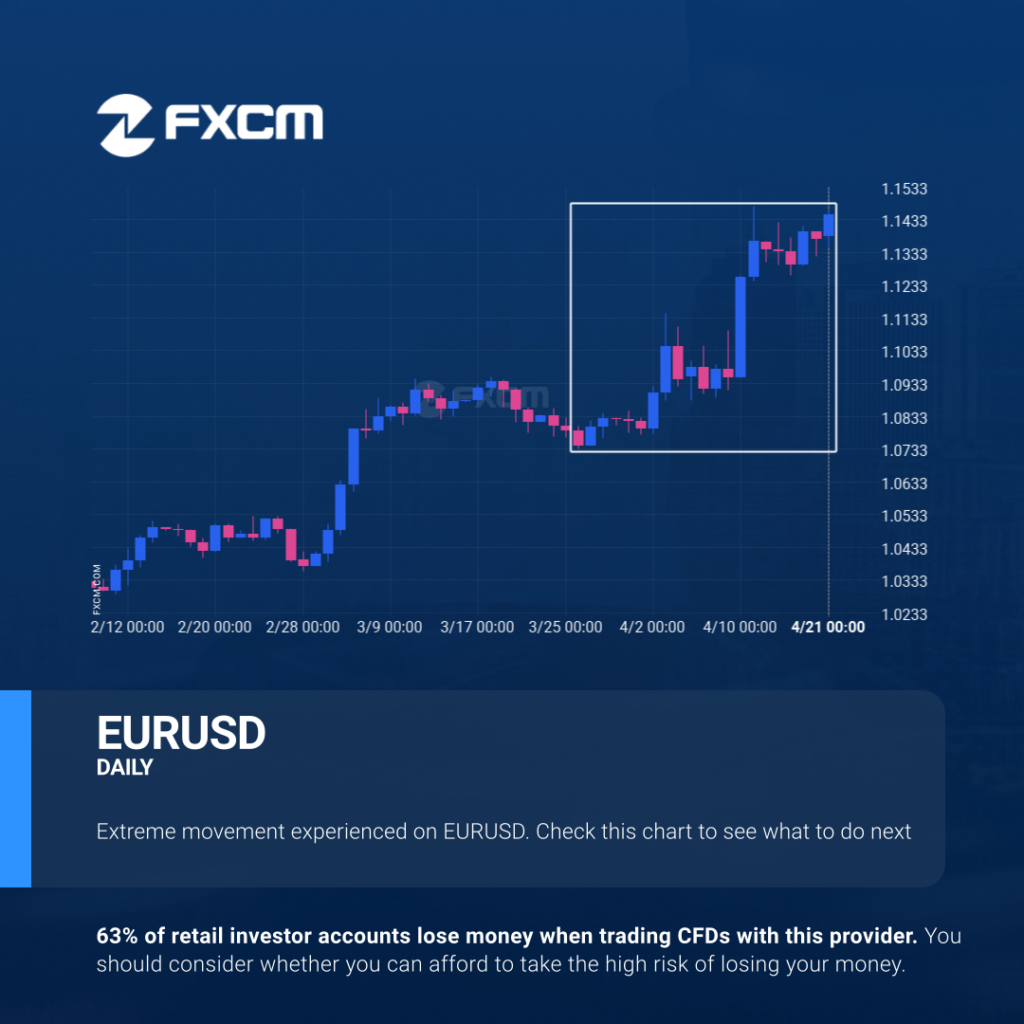
An unexpected large move has occurred on EURUSD Daily chart beginning at 1.07411 and ending at 1.144915. Is this a sign of something new? What can we expect in the future? Past performance is not an indicator of future results. 63% of retail investor accounts lose money when trading CFDs with this provider. You should […]
¿Es probable que EURUSD corrija después de este gran movimiento?
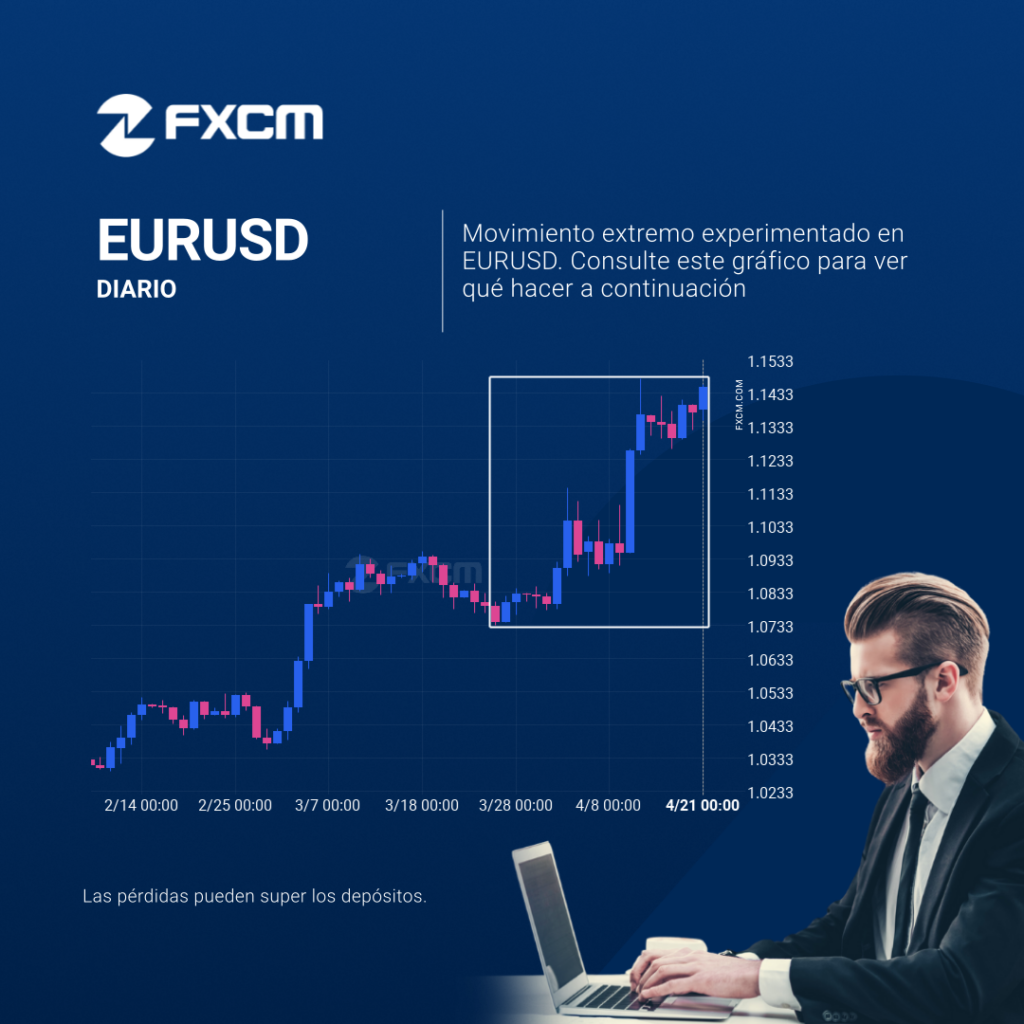
Se ha producido un gran movimiento inesperado en el gráfico de Diario de EURUSD que comienza en 1.07411 y finaliza en 1.144915. ¿Es esto una señal de algo nuevo? ¿Qué podemos esperar en el futuro? El rendimiento pasado no es indicativo de resultados futuros. Las pérdidas pueden exceder los fondos depositados.
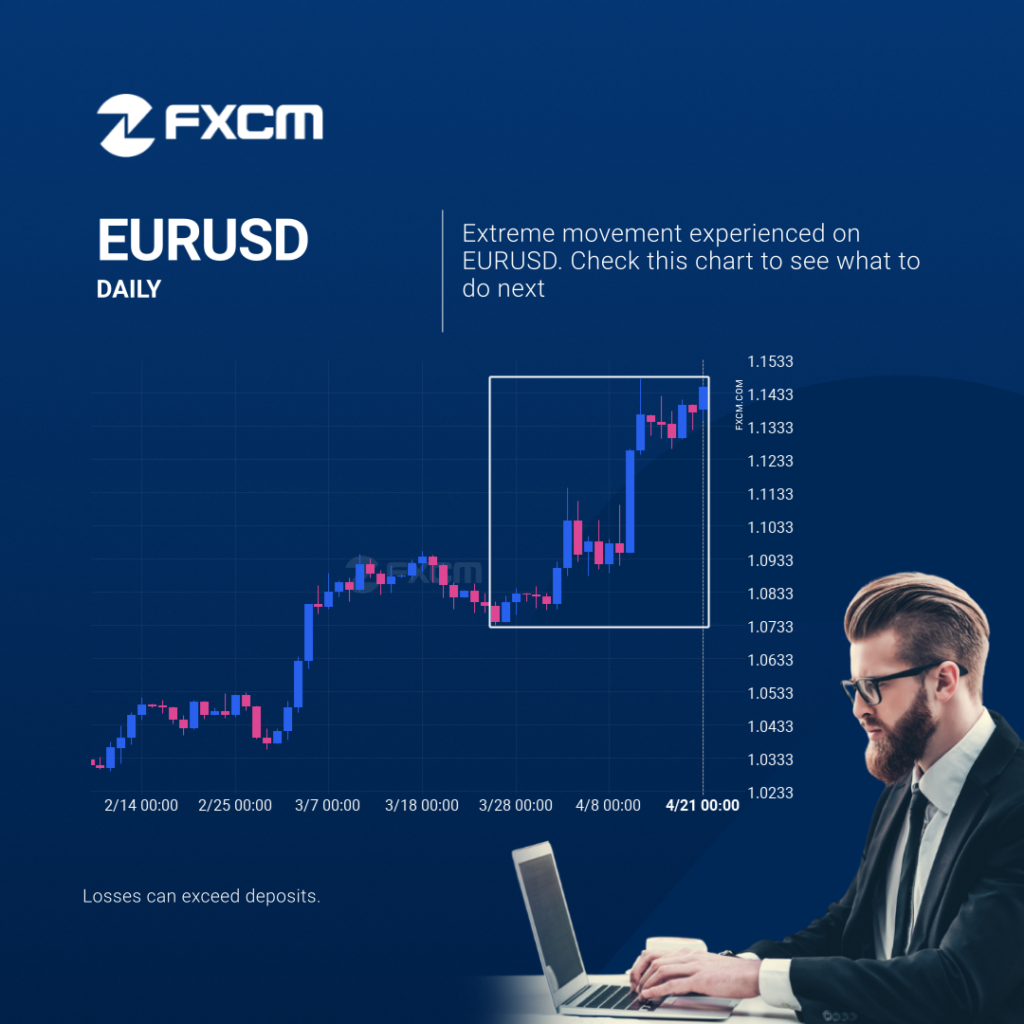
Is EURUSD likely to correct after this massive movement?
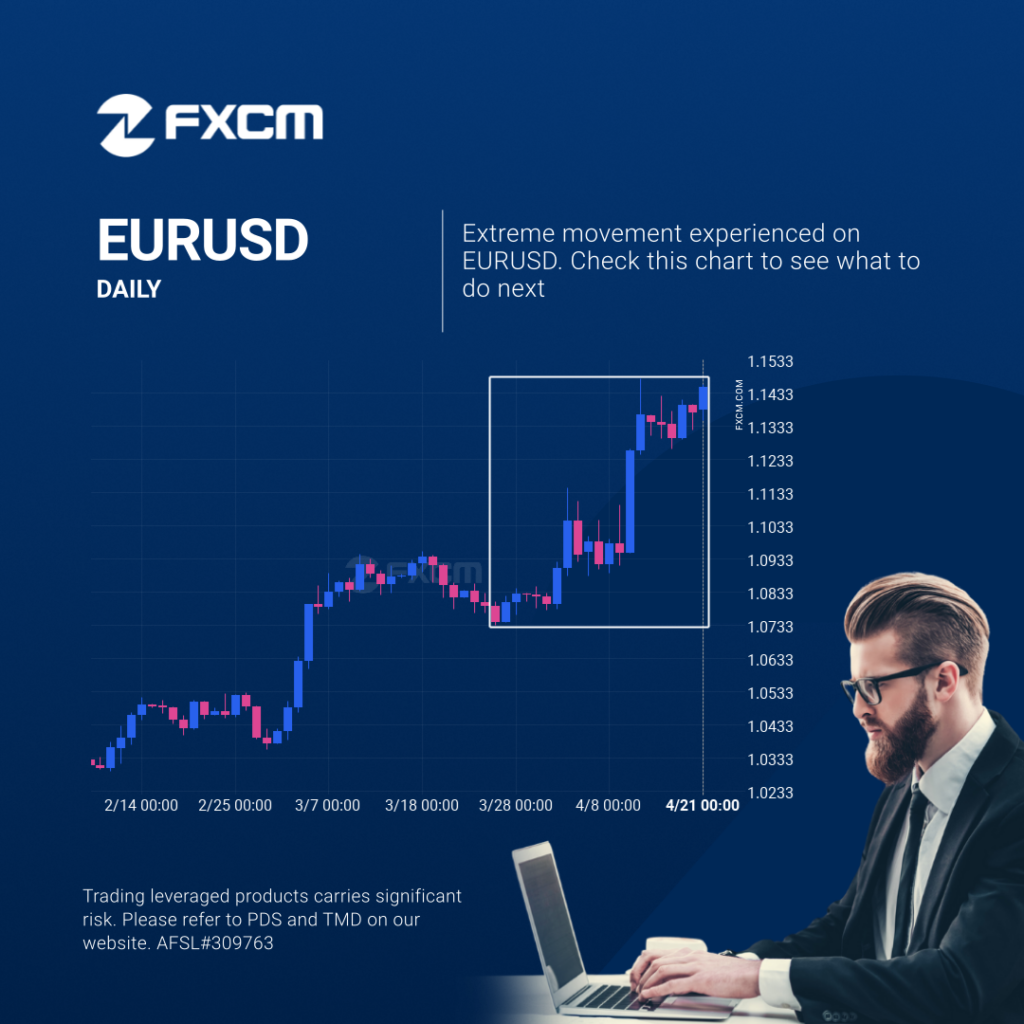
An unexpected large move has occurred on EURUSD Daily chart beginning at 1.07411 and ending at 1.144915. Is this a sign of something new? What can we expect in the future? Past performance is not an indicator of future results. Trading leveraged products carries significant risk. Please refer to PDS and TMD on our website. […]