GBPUSD va en camino hacia arriba

GBPUSD experimentó un movimiento extremadamente grande que duró 16. Este movimiento está en el percentil 97.0 y es poco común. No es inusual presenciar un retroceso después de un movimiento tan grande. El rendimiento pasado no es indicativo de resultados futuros. Las pérdidas pueden exceder los fondos depositados.
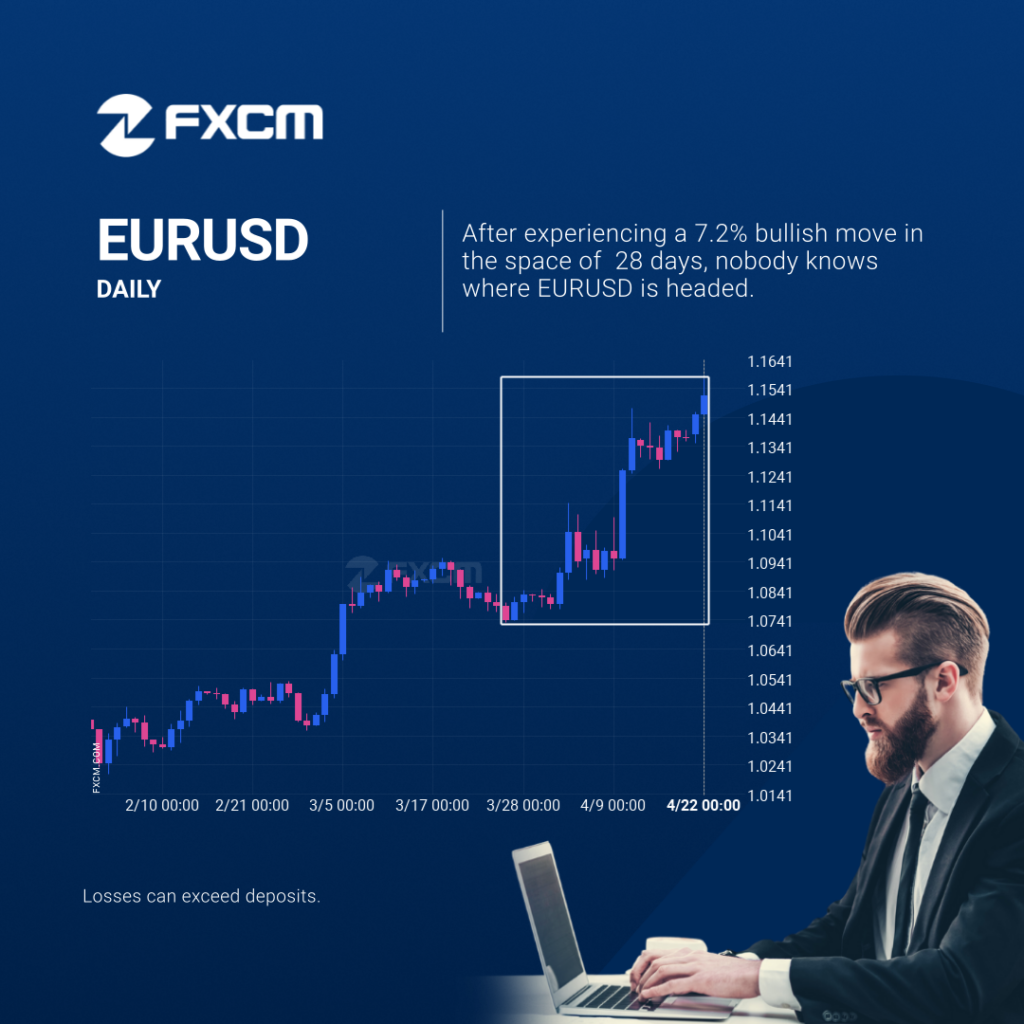
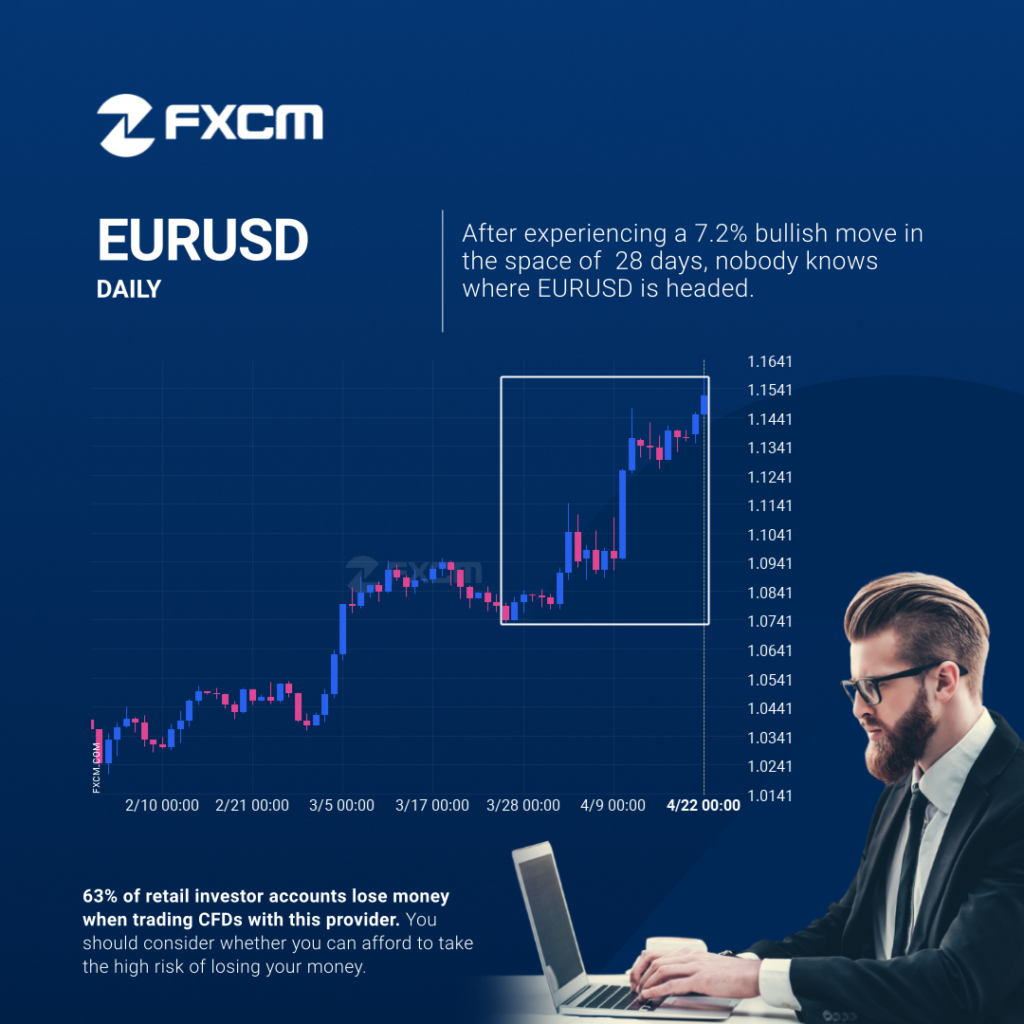
Rare opportunity on EURUSD – extreme bullish movement
EURUSD hits 1.151425 after a 7.2% move spanning 28 days. Past performance is not an indicator of future results. Trading leveraged products carries significant risk. Please refer to PDS and TMD on our website. AFSL#309763
Oportunidad rara en EURUSD – movimiento bullish extremo
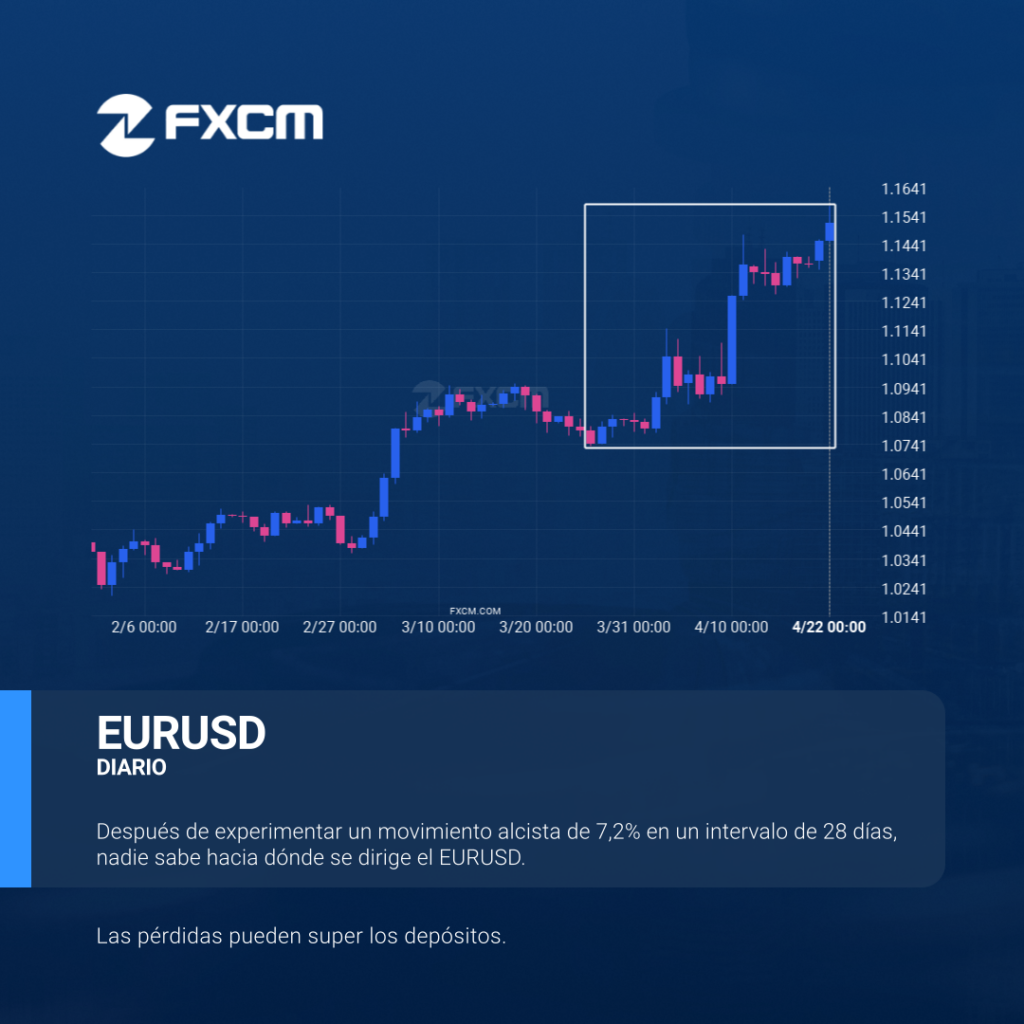
EURUSD llegó a 1.151425 después de un movimiento del 7,2% que ha durado 28 días. El rendimiento pasado no es indicativo de resultados futuros. Las pérdidas pueden exceder los fondos depositados.
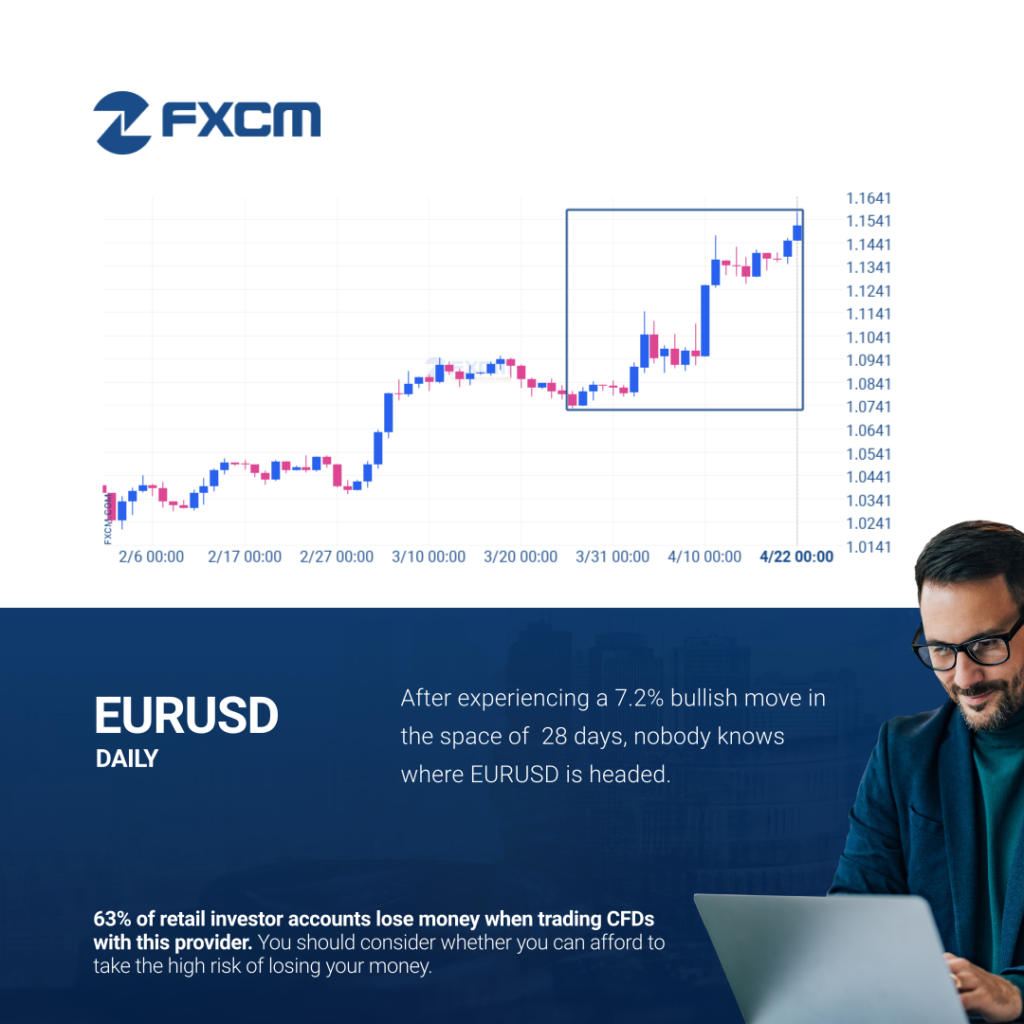
Rare opportunity on EURUSD – extreme bullish movement
EURUSD hits 1.151425 after a 7.2% move spanning 28 days. Past performance is not an indicator of future results. Losses can exceed deposits.
¿Deberíamos esperar una ruptura o una recuperación del ESP35?

El ESP35 avanza hacia la línea de resistencia de un Cuña ascendente, que ya ha probado varias veces en el pasado. Hemos visto un retroceso antes desde esta línea, así que en esta etapa no está claro si atravesará esta línea o se recuperará como lo ha hecho anteriormente. Si el ESP35 continúa con esta […]
Rare opportunity on EURUSD – extreme bullish movement
EURUSD hits 1.151425 after a 7.2% move spanning 28 days. Past performance is not an indicator of future results. Trading leveraged products carries significant risk. Please refer to PDS and TMD on our website. AFSL#309763
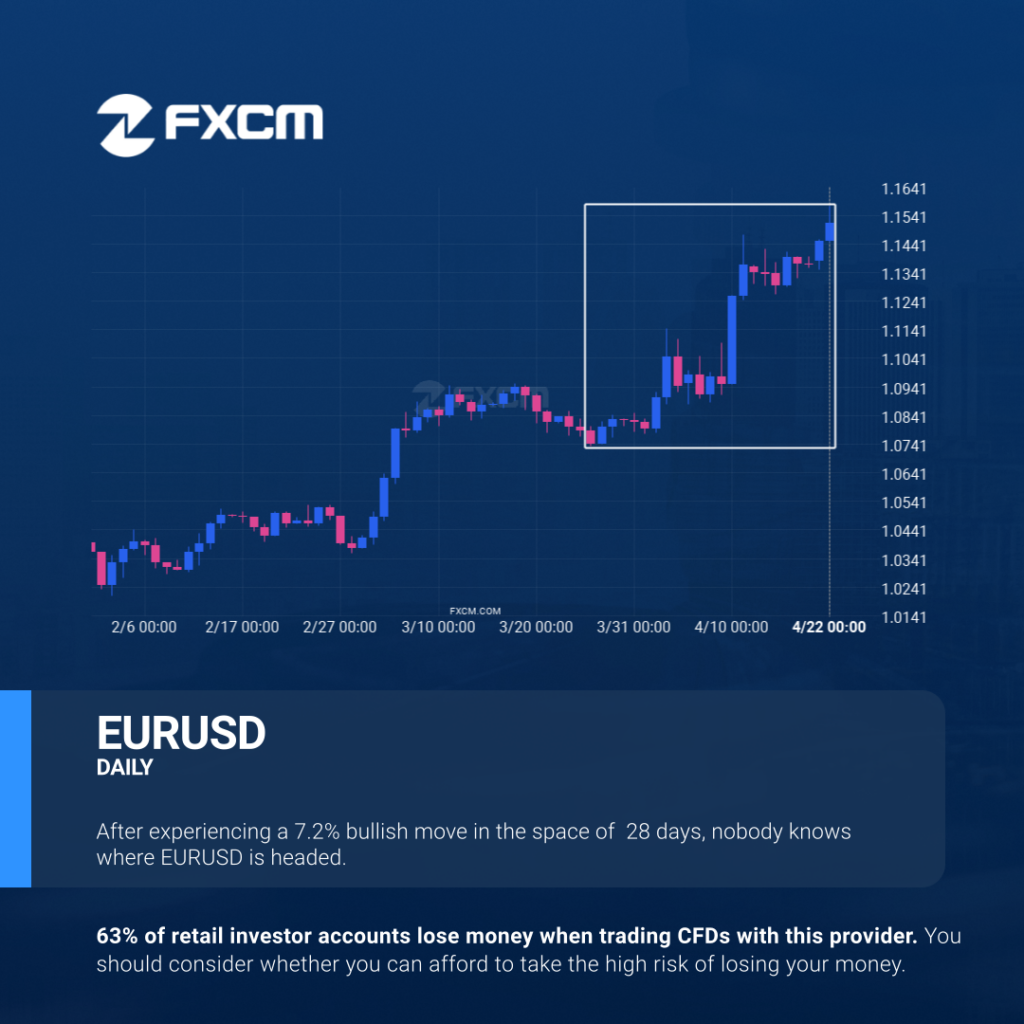
Rare opportunity on EURUSD – extreme bullish movement
EURUSD hits 1.151425 after a 7.2% move spanning 28 days. Past performance is not an indicator of future results. 63% of retail investor accounts lose money when trading CFDs with this provider. You should consider whether you can afford to take the high risk of losing your money.
Should we expect a breakout or a rebound on ESP35?
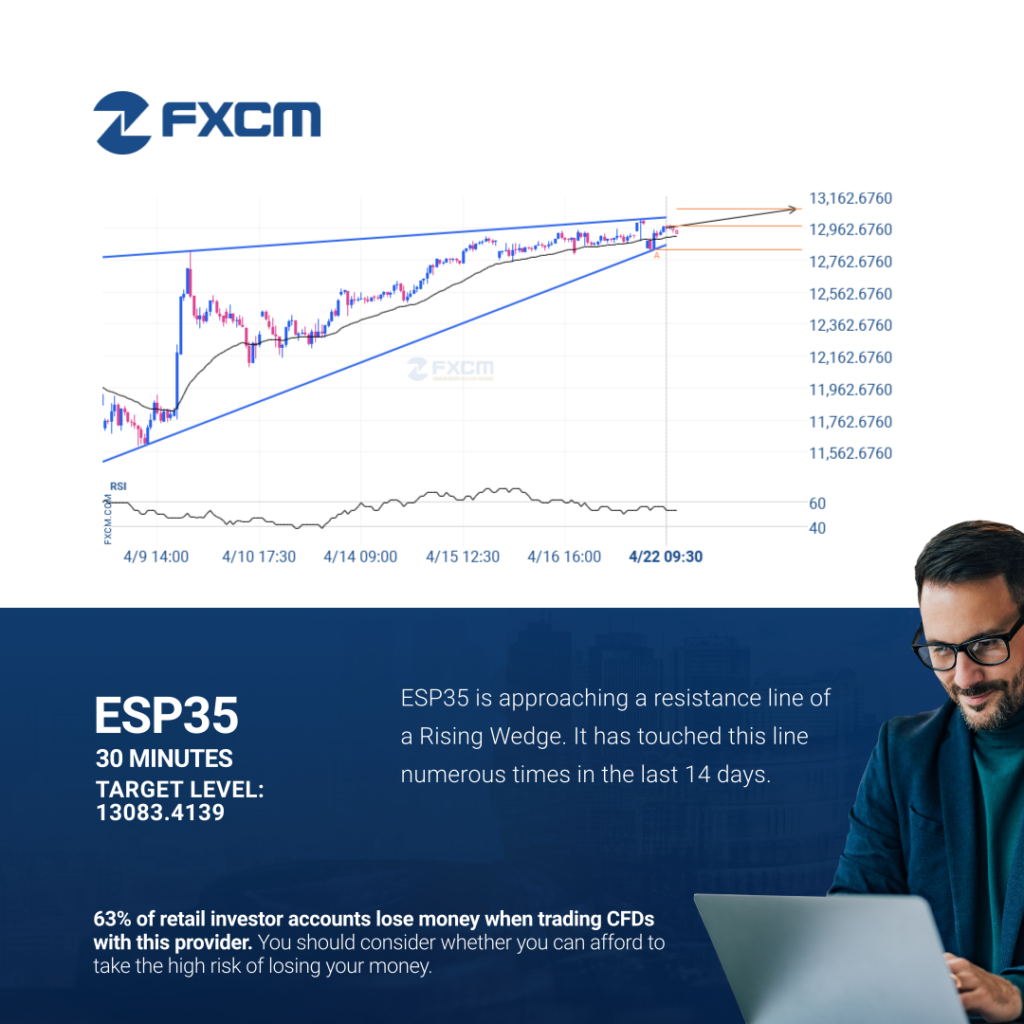
ESP35 is moving towards a resistance line which it has tested numerous times in the past. We have seen it retrace from this line before, so at this stage it isn’t clear whether it will breach this line or rebound as it did before. If ESP35 continues in its current trajectory, we could see it […]
Should we expect a breakout or a rebound on ESP35?
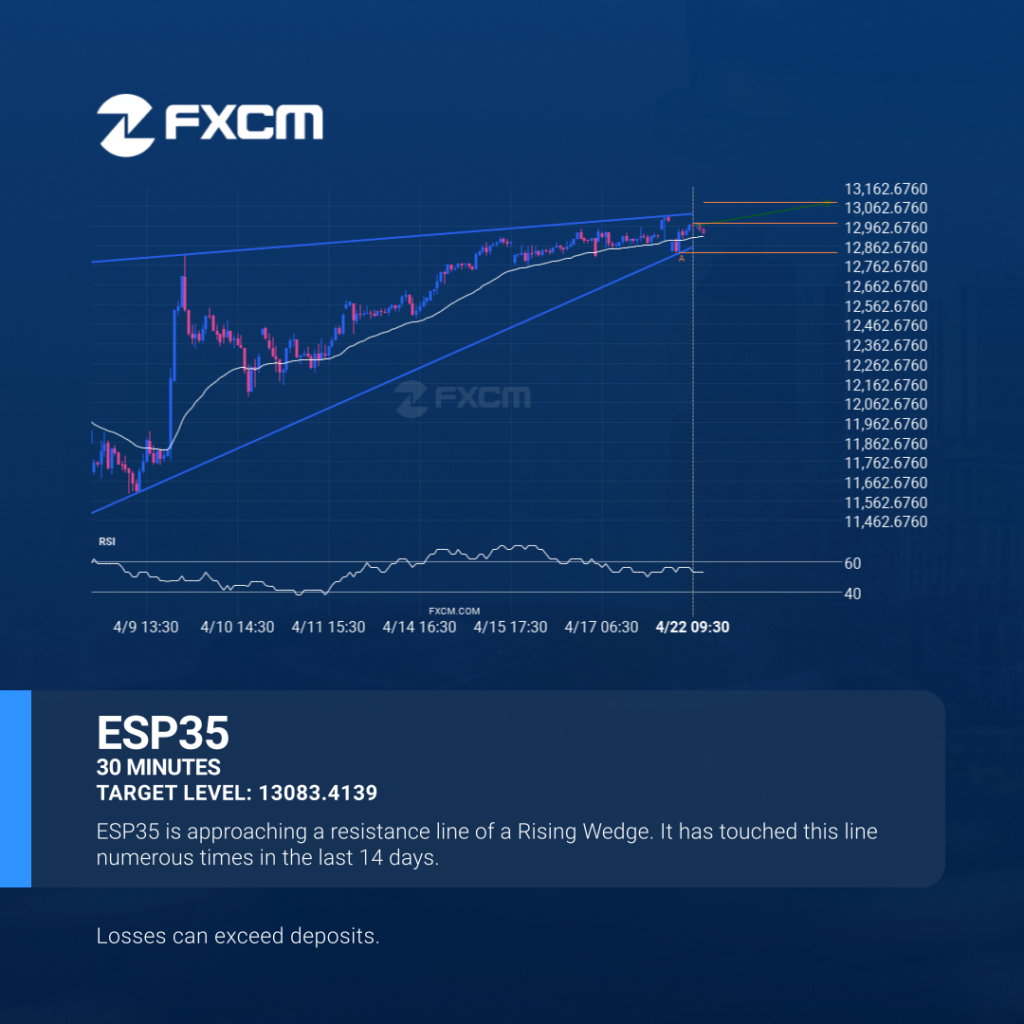
ESP35 is moving towards a resistance line which it has tested numerous times in the past. We have seen it retrace from this line before, so at this stage it isn’t clear whether it will breach this line or rebound as it did before. If ESP35 continues in its current trajectory, we could see it […]
Should we expect a breakout or a rebound on ESP35?
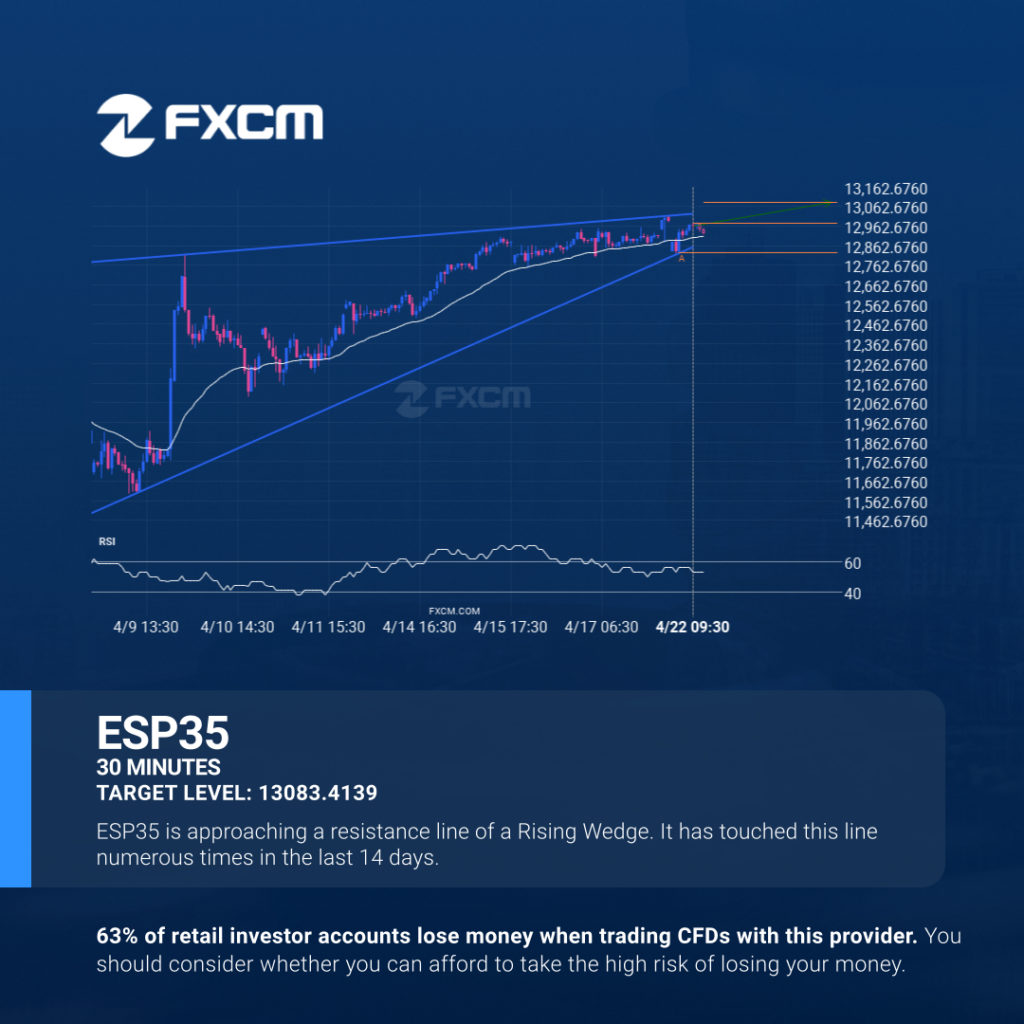
ESP35 is moving towards a resistance line which it has tested numerous times in the past. We have seen it retrace from this line before, so at this stage it isn’t clear whether it will breach this line or rebound as it did before. If ESP35 continues in its current trajectory, we could see it […]