Where is USDCHF moving to?
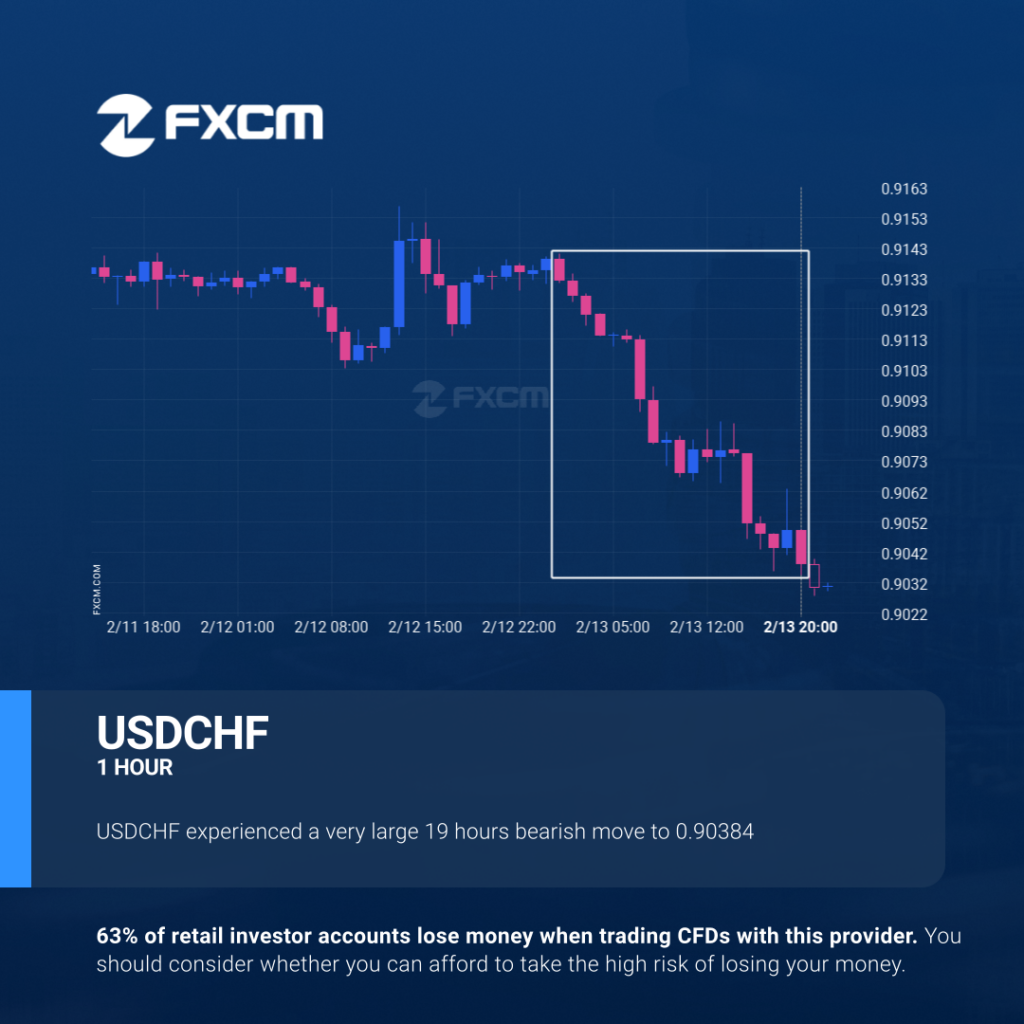
An unexpected large move has occurred on USDCHF 1 hour chart beginning at 0.91316 and ending at 0.90384. Is this a sign of something new? What can we expect in the future? Past performance is not an indicator of future results. 64% of retail investor accounts lose money when trading CFDs with this provider. You […]
Where is USDCHF moving to?
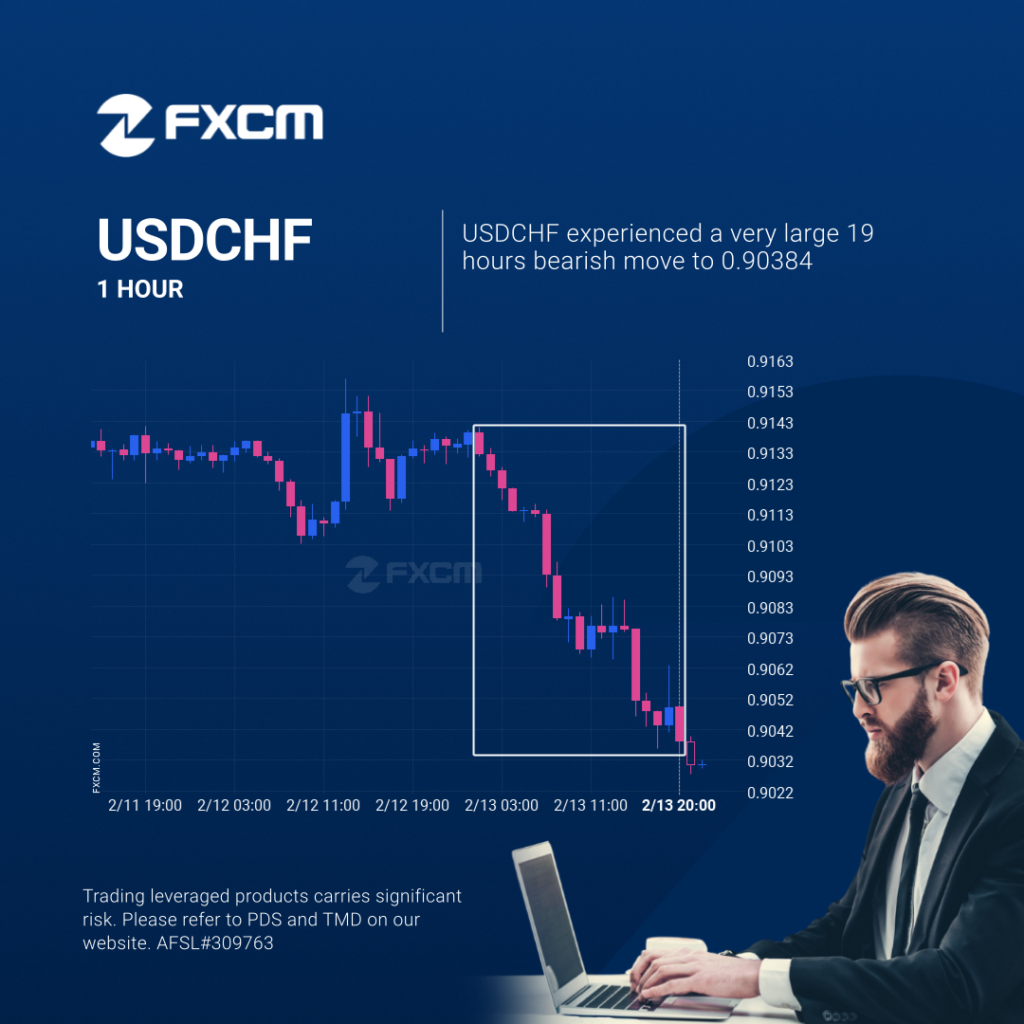
An unexpected large move has occurred on USDCHF 1 hour chart beginning at 0.91316 and ending at 0.90384. Is this a sign of something new? What can we expect in the future? Past performance is not an indicator of future results. Trading leveraged products carries significant risk. Please refer to PDS and TMD on our […]
Where is USDCHF moving to?
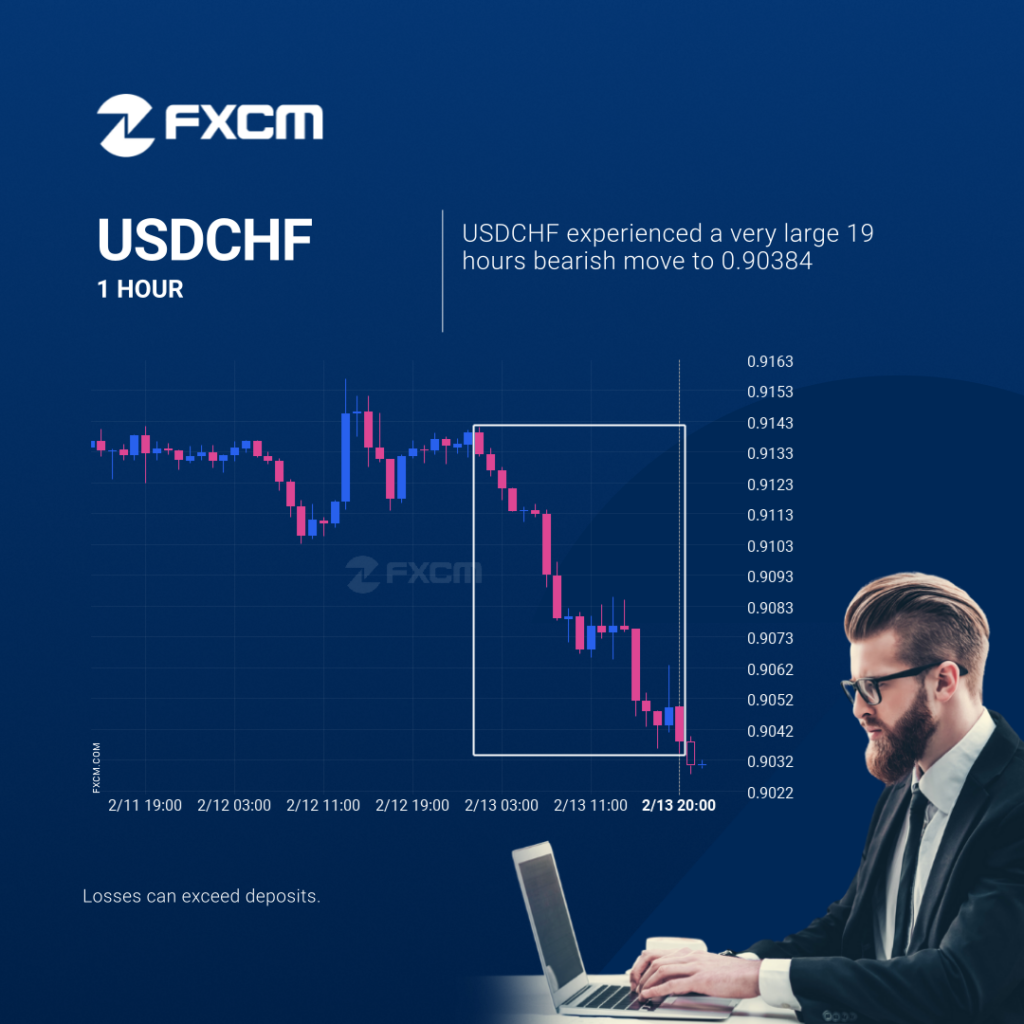
An unexpected large move has occurred on USDCHF 1 hour chart beginning at 0.91316 and ending at 0.90384. Is this a sign of something new? What can we expect in the future? Past performance is not an indicator of future results. Losses can exceed deposits.
Un posible comienzo de una tendencia bajista en el ESP35
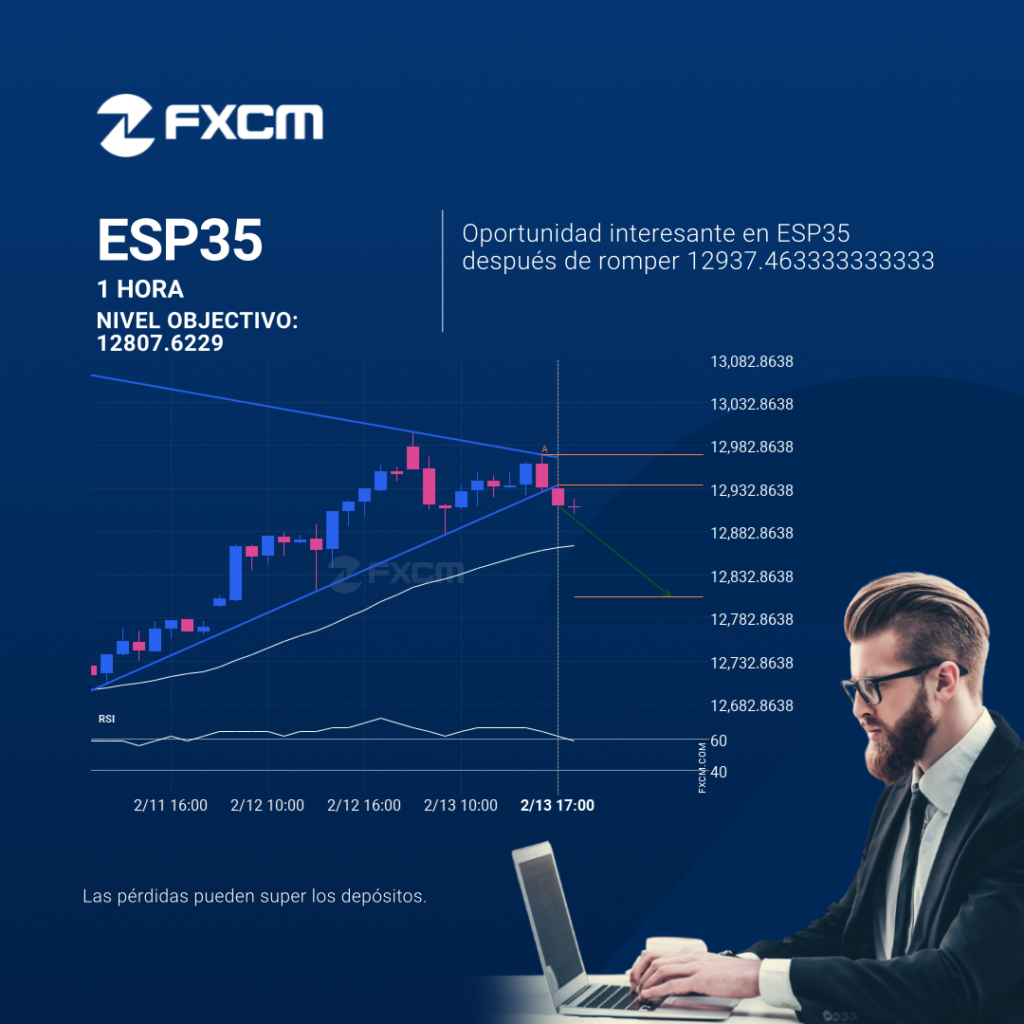
El ESP35 ha atravesado una línea de soporte de un patrón de gráfico que corresponde a un Triángulo. Si esta irrupción se mantiene, podríamos ver el precio del ESP35 probando el nivel de 12807.6229 dentro de las próximas 7 horas. Pero no se apresure si desea operar, porque ya ha probado esta línea en el […]
¿Hacia dónde se dirige el USDCHF?
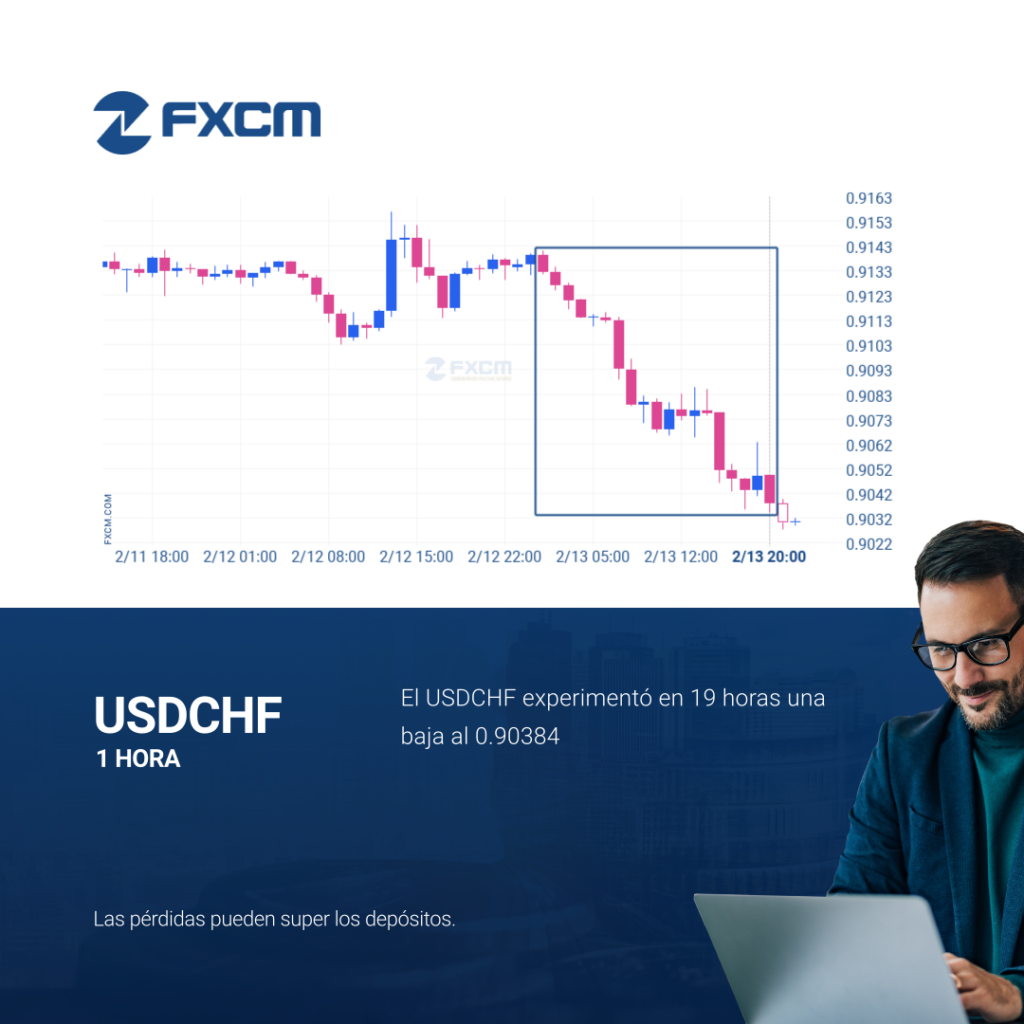
Se ha producido un gran movimiento inesperado en el gráfico de 1 Hora de USDCHF que comienza en 0.91316 y finaliza en 0.90384. ¿Es esto una señal de algo nuevo? ¿Qué podemos esperar en el futuro? El rendimiento pasado no es indicativo de resultados futuros. Las pérdidas pueden exceder los fondos depositados.
A possible start of a bearish trend on ESP35
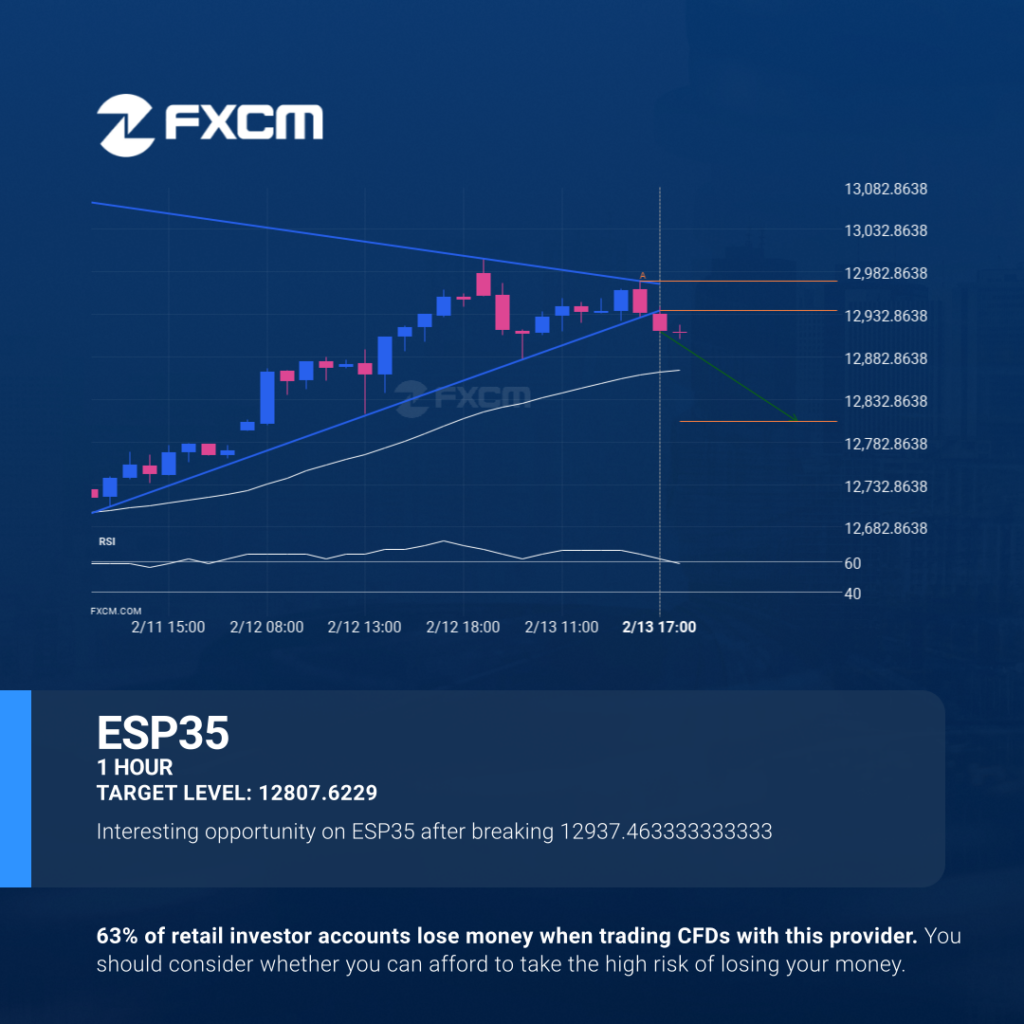
ESP35 has broken through a support line of a Triangle chart pattern. If this breakout holds true, we may see the price of ESP35 testing 12807.6229 within the next 7 hours. But don’t be so quick to trade, it has tested this line in the past, so you should confirm the breakout before taking any […]
A possible start of a bearish trend on ESP35
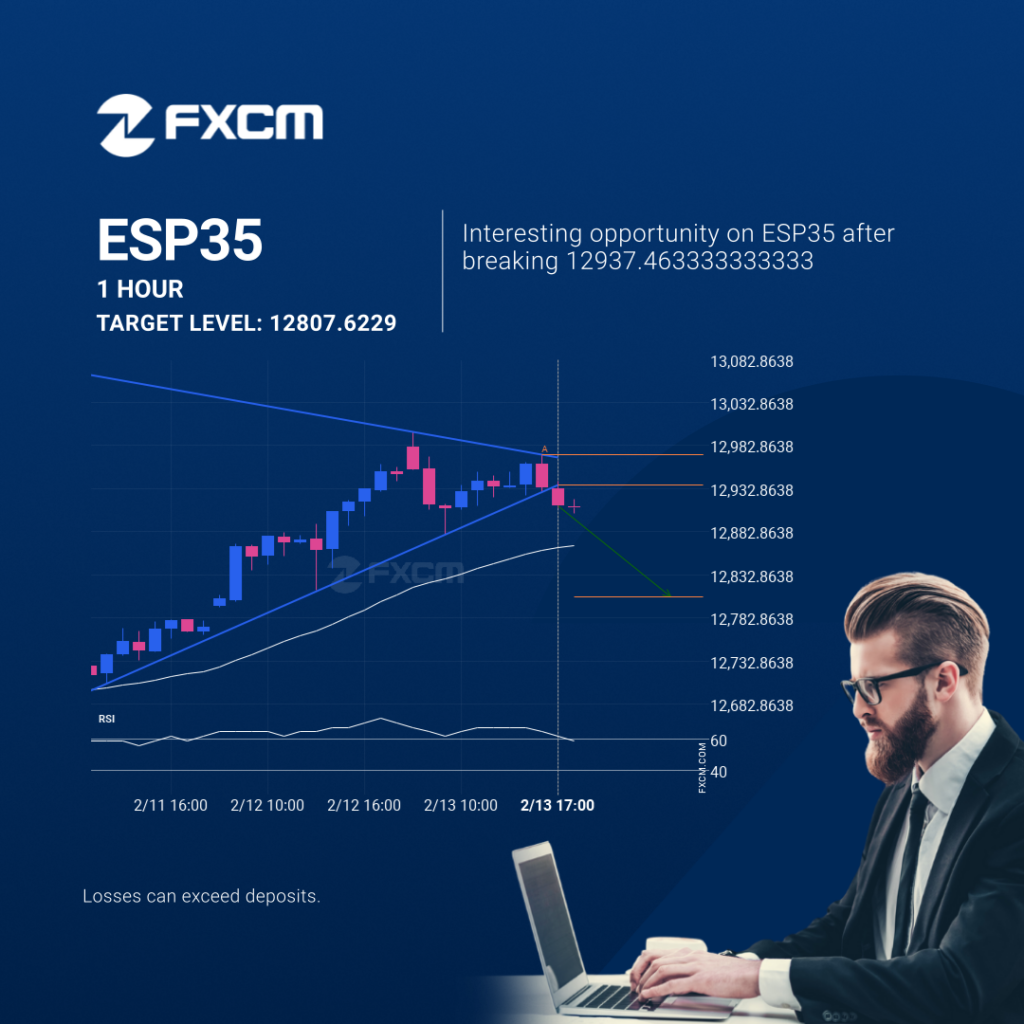
ESP35 has broken through a support line of a Triangle chart pattern. If this breakout holds true, we may see the price of ESP35 testing 12807.6229 within the next 7 hours. But don’t be so quick to trade, it has tested this line in the past, so you should confirm the breakout before taking any […]
A possible start of a bearish trend on ESP35
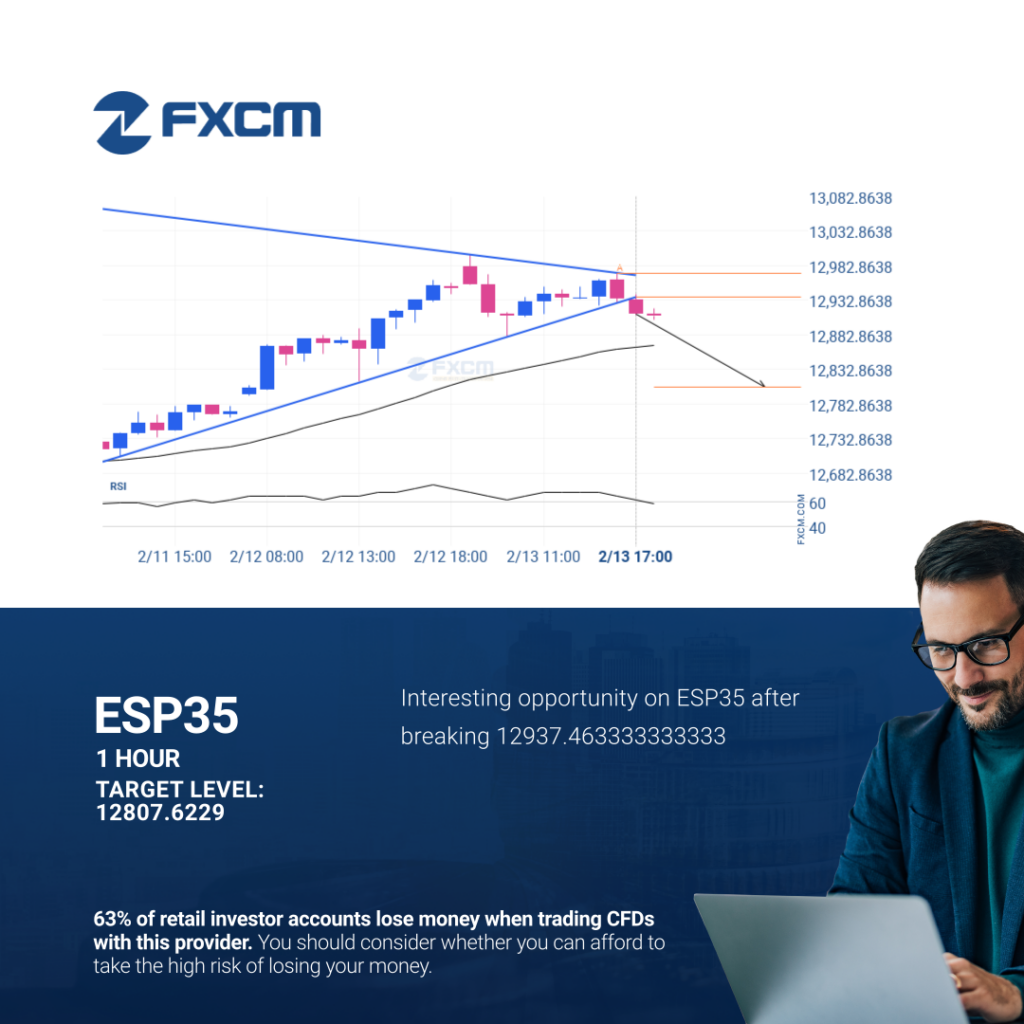
ESP35 has broken through a support line of a Triangle chart pattern. If this breakout holds true, we may see the price of ESP35 testing 12807.6229 within the next 7 hours. But don’t be so quick to trade, it has tested this line in the past, so you should confirm the breakout before taking any […]
Should we expect a breakout or a rebound on XAGUSD?
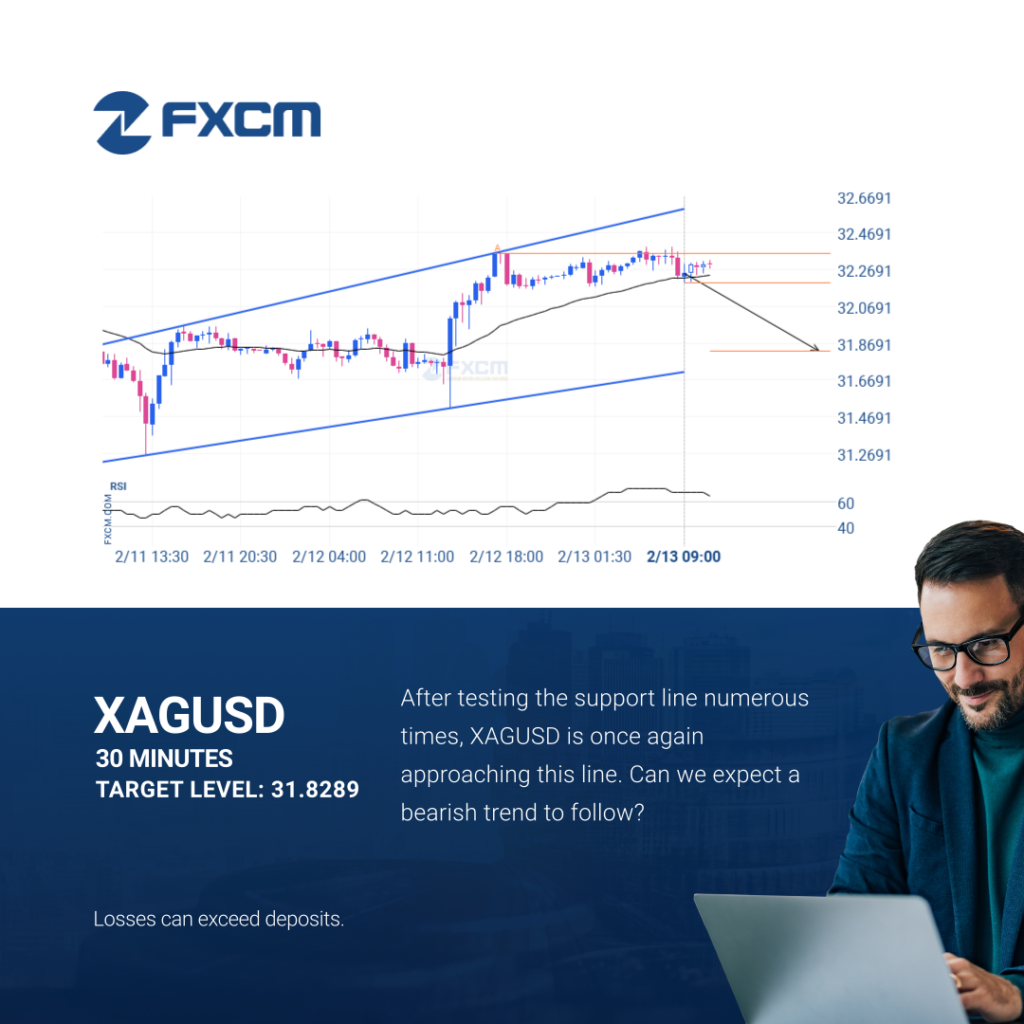
XAGUSD was identified at around 32.199 having recently rebounded of the resistance on the 30 Minutes data interval. Ultimately, the price action of the stock has formed a Channel Up pattern. This squeeze may increases the chances of a strong breakout. The projected movement will potentially take the price to around the 31.8289 level. Past […]
Should we expect a breakout or a rebound on XAGUSD?

XAGUSD was identified at around 32.199 having recently rebounded of the resistance on the 30 Minutes data interval. Ultimately, the price action of the stock has formed a Channel Up pattern. This squeeze may increases the chances of a strong breakout. The projected movement will potentially take the price to around the 31.8289 level. Past […]