Should we expect a breakout or a rebound on EURCHF?
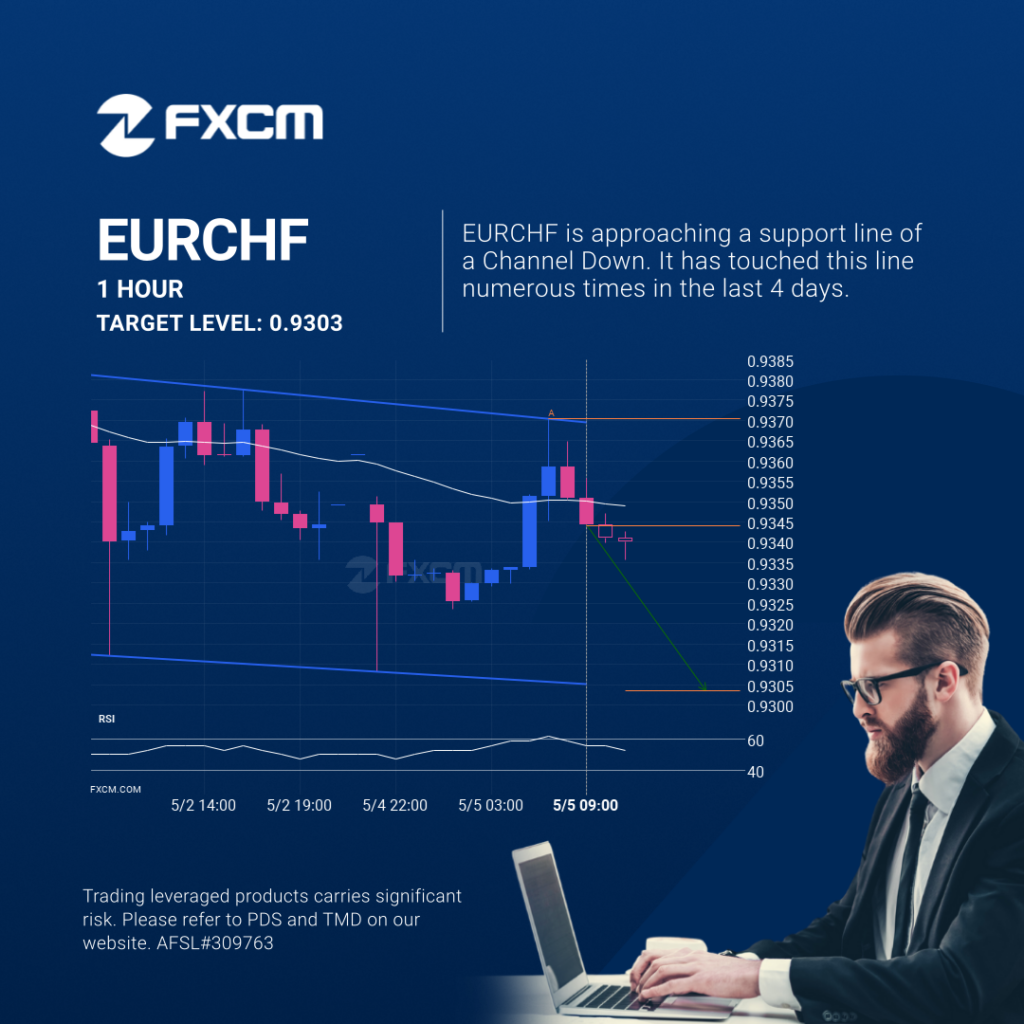
EURCHF was identified at around 0.934365 having recently rebounded of the resistance on the 1 hour data interval. Ultimately, the price action of the stock has formed a Channel Down pattern. This squeeze may increases the chances of a strong breakout. The projected movement will potentially take the price to around the 0.9303 level. Past […]
Should we expect a breakout or a rebound on EURCHF?
EURCHF was identified at around 0.934365 having recently rebounded of the resistance on the 1 hour data interval. Ultimately, the price action of the stock has formed a Channel Down pattern. This squeeze may increases the chances of a strong breakout. The projected movement will potentially take the price to around the 0.9303 level. Past […]
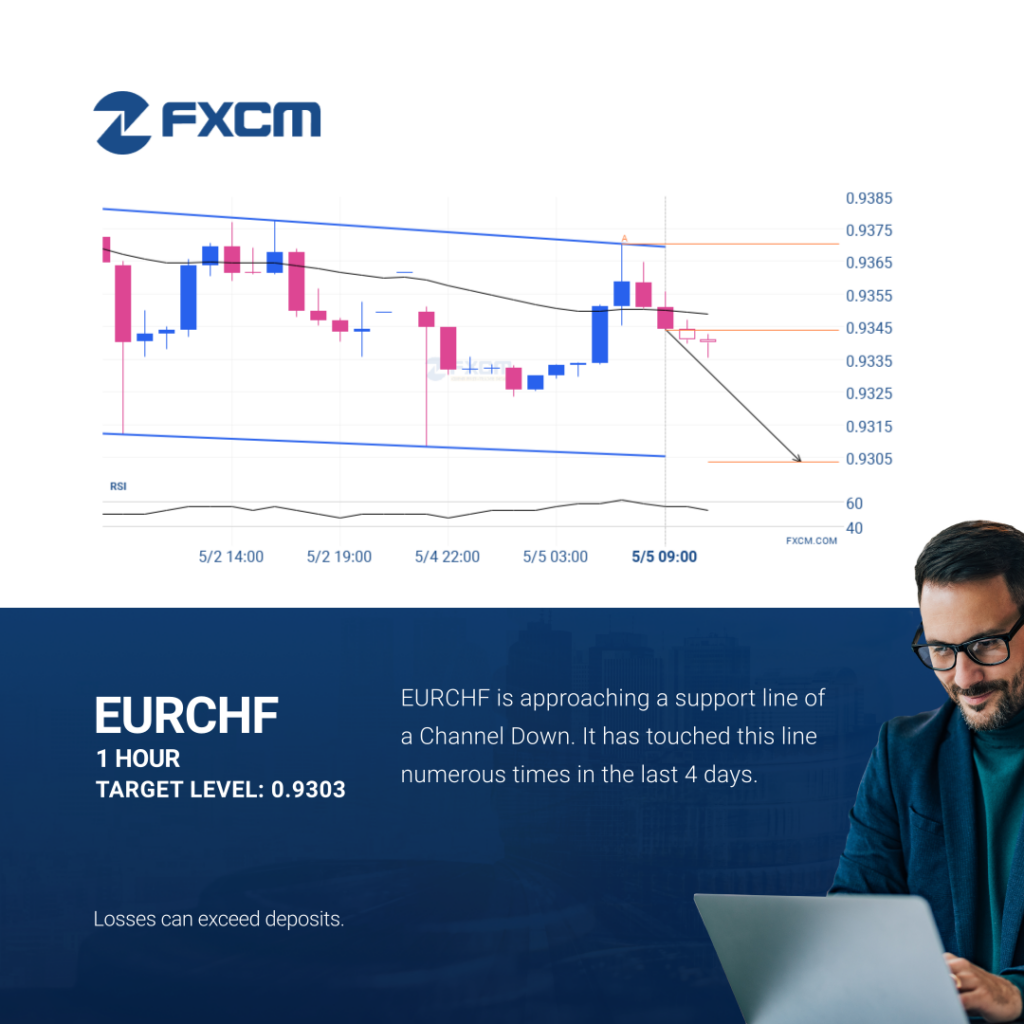
¿Deberíamos esperar una ruptura o una recuperación del EURCHF?

Se identificó un patrón de Canal bajista en EURCHF en 0.934365, lo que generó la expectativa de que podría moverse a la línea de soporte en 0.9303. Puede atravesar esa línea y continuar la tendencia bajista o puede girarse desde esa línea. El rendimiento pasado no es indicativo de resultados futuros. Las pérdidas pueden exceder […]
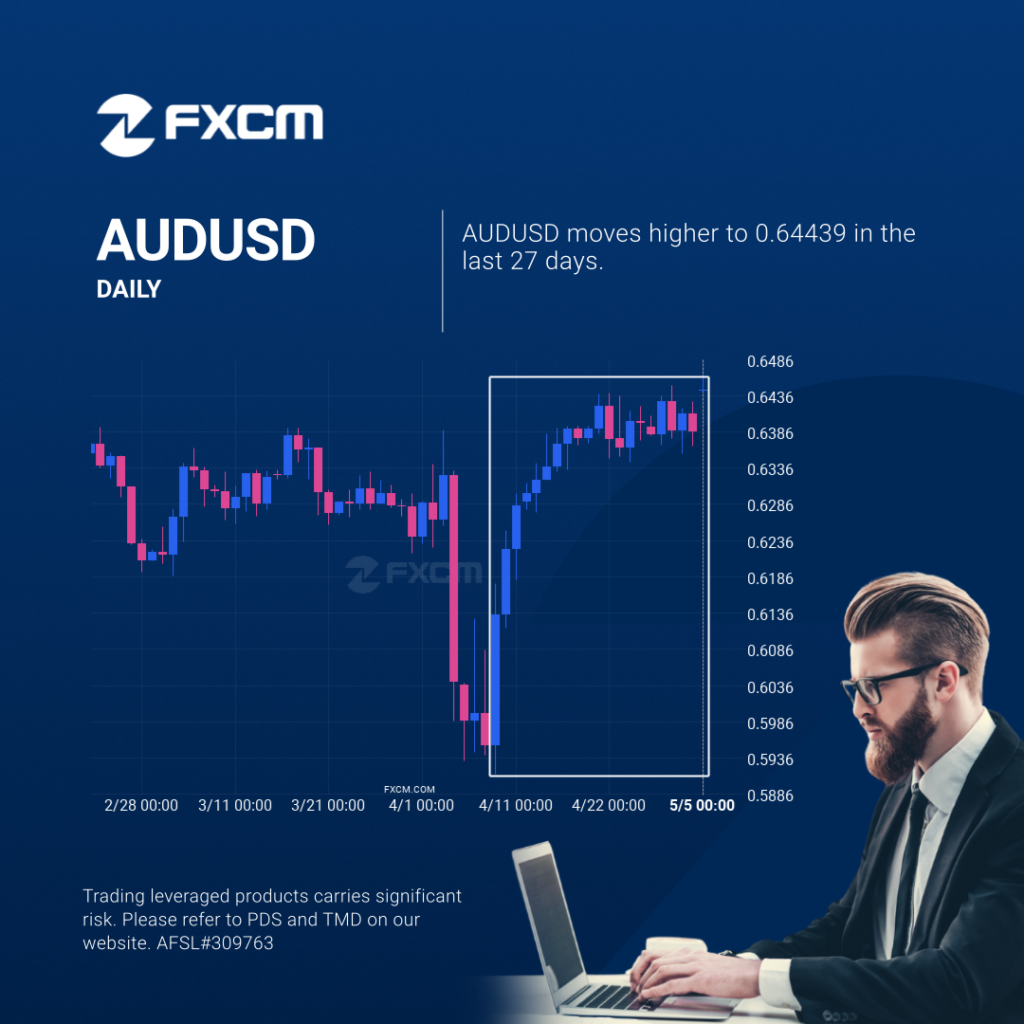
Dramatic change in AUDUSD. A sign of things to come?

Those of you that are trend followers are probably eagerly watching AUDUSD to see if its latest 5.07% move continues. If not, the mean-reversion people out there will be delighted with this exceptionally large 27 days move. Past performance is not an indicator of future results. Losses can exceed deposits.
Dramatic change in AUDUSD. A sign of things to come?
Those of you that are trend followers are probably eagerly watching AUDUSD to see if its latest 5.07% move continues. If not, the mean-reversion people out there will be delighted with this exceptionally large 27 days move. Past performance is not an indicator of future results. Trading leveraged products carries significant risk. Please refer to […]
Cambio dramático en AUDUSD. ¿Una muestra de lo que vendrá?
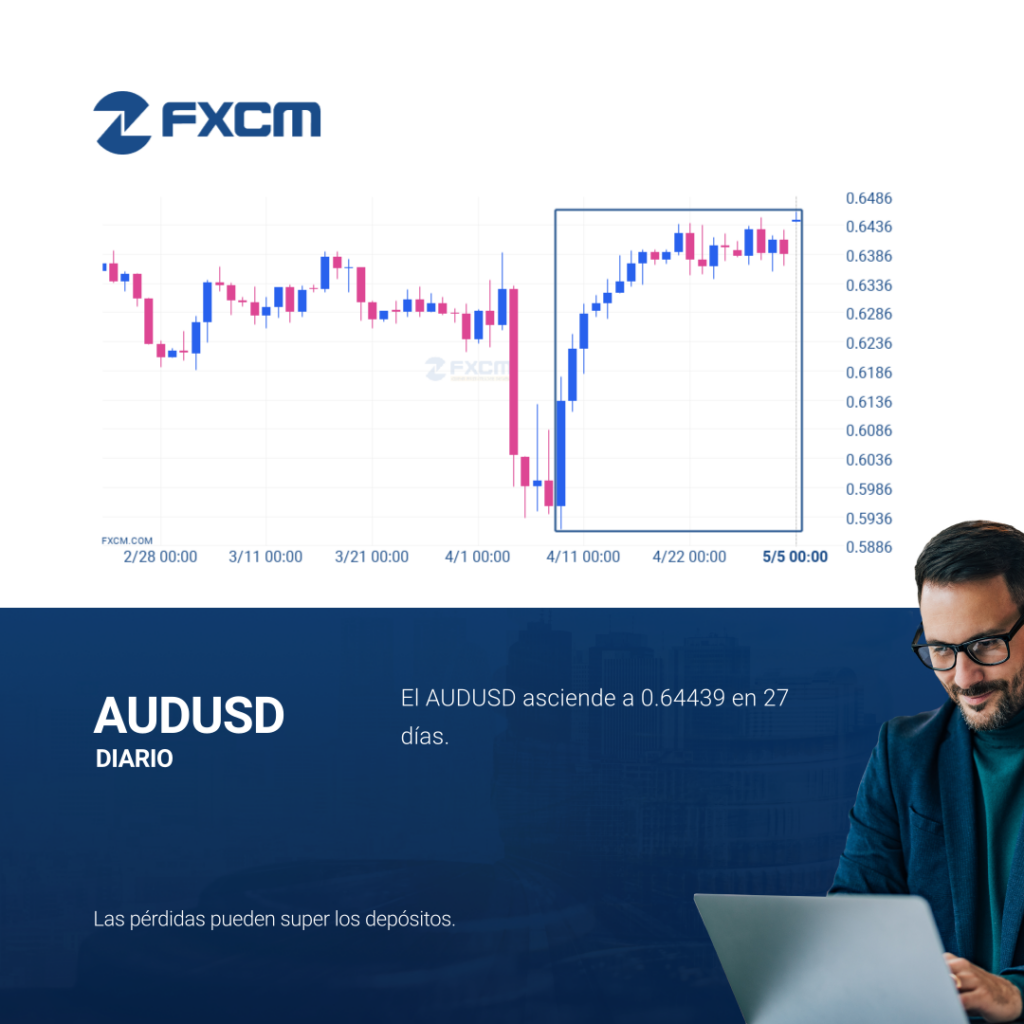
Aquellos de ustedes que sean seguidores de tendencias probablemente estarán observando ansiosamente AUDUSD para comprobar si el último movimiento de un 5,07% continúa. Si no lo hace, las personas fieles al método de reversión a la media estarán encantadas con este excepcionalmente gran movimiento de 27 días. El rendimiento pasado no es indicativo de resultados […]
Will EURUSD have enough momentum to break support?
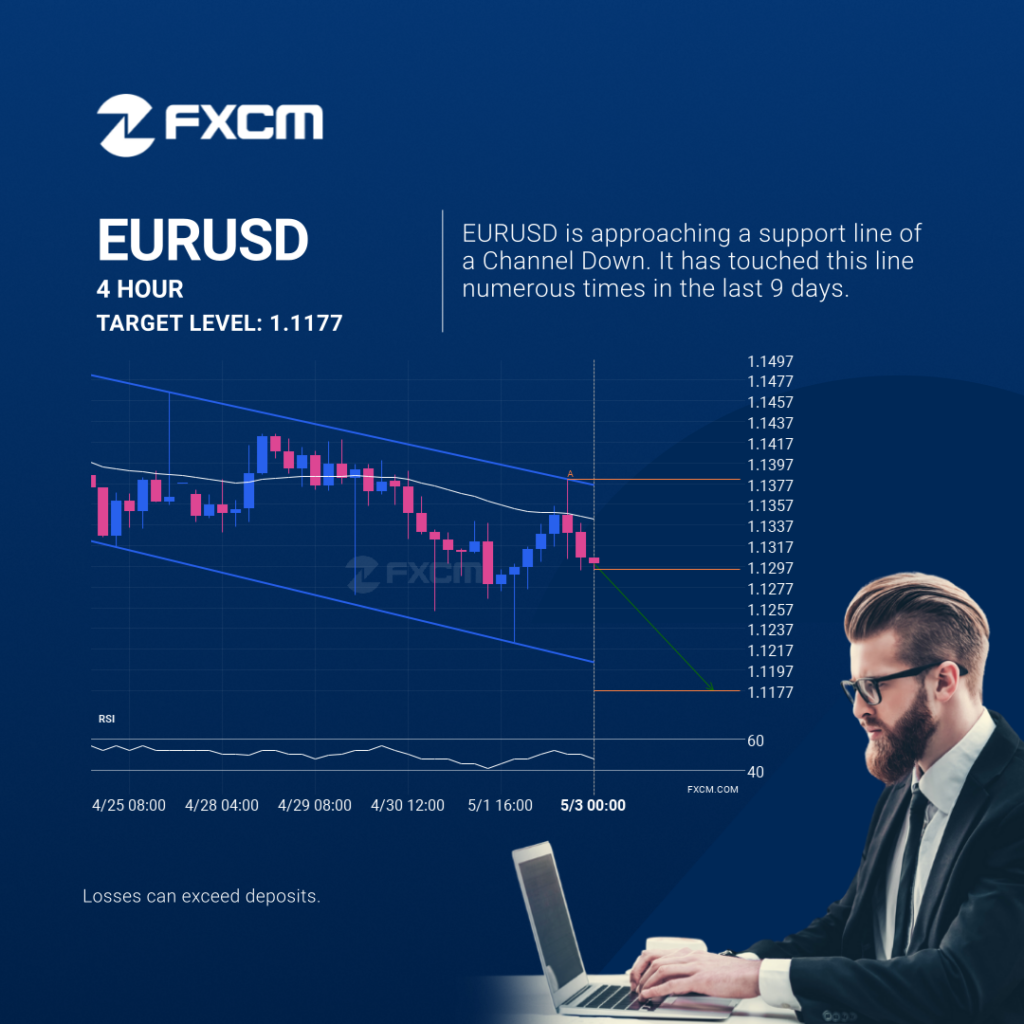
EURUSD is heading towards the support line of a Channel Down. If this movement continues, the price of EURUSD could test 1.1177 within the next 2 days. It has tested this line numerous times in the past, so this movement could be short-lived and end up rebounding just like it did in the past. Past […]
Possible breach of resistance level by HKG33
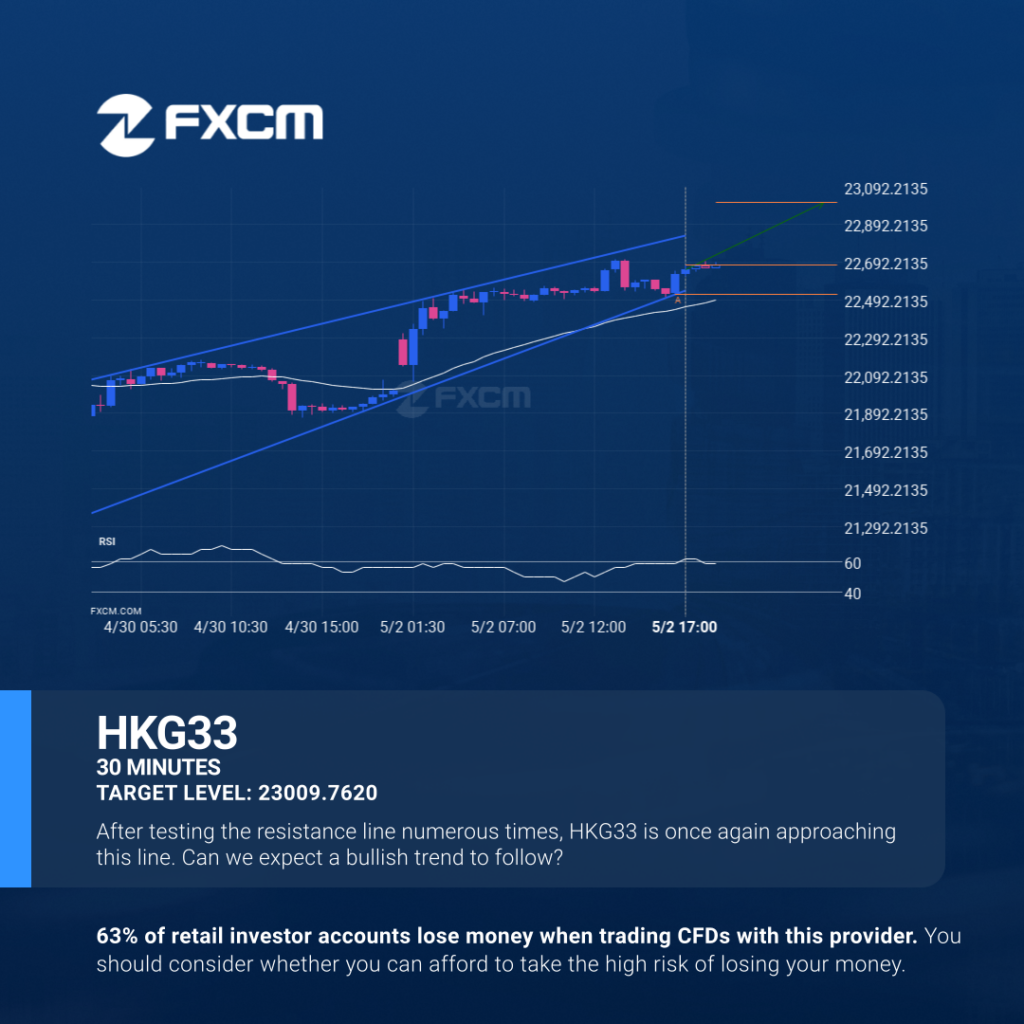
An emerging Rising Wedge has been detected on HKG33 on the 30 Minutes chart. There is a possible move towards 23009.7620 next few candles. Once reaching support it may continue its bullish run or reverse back to current price levels. Past performance is not an indicator of future results. Trading leveraged products carries significant risk. […]
Possible breach of resistance level by HKG33

An emerging Rising Wedge has been detected on HKG33 on the 30 Minutes chart. There is a possible move towards 23009.7620 next few candles. Once reaching support it may continue its bullish run or reverse back to current price levels. Past performance is not an indicator of future results. Losses can exceed deposits.