Posible ruptura del nivel de resistencia en el BTCUSD

El patrón de Canal alcista emergente en su ola final se identificó en el gráfico de 30 Minutos de BTCUSD. Después de un fuerte movimiento alcista, encontramos que BTCUSD se dirige hacia la línea del triángulo superior con una posible resistencia en 106211.0260. Si resulta que el nivel de resistencia aguanta, el patrón de Canal […]
A potential bullish movement on ESP35
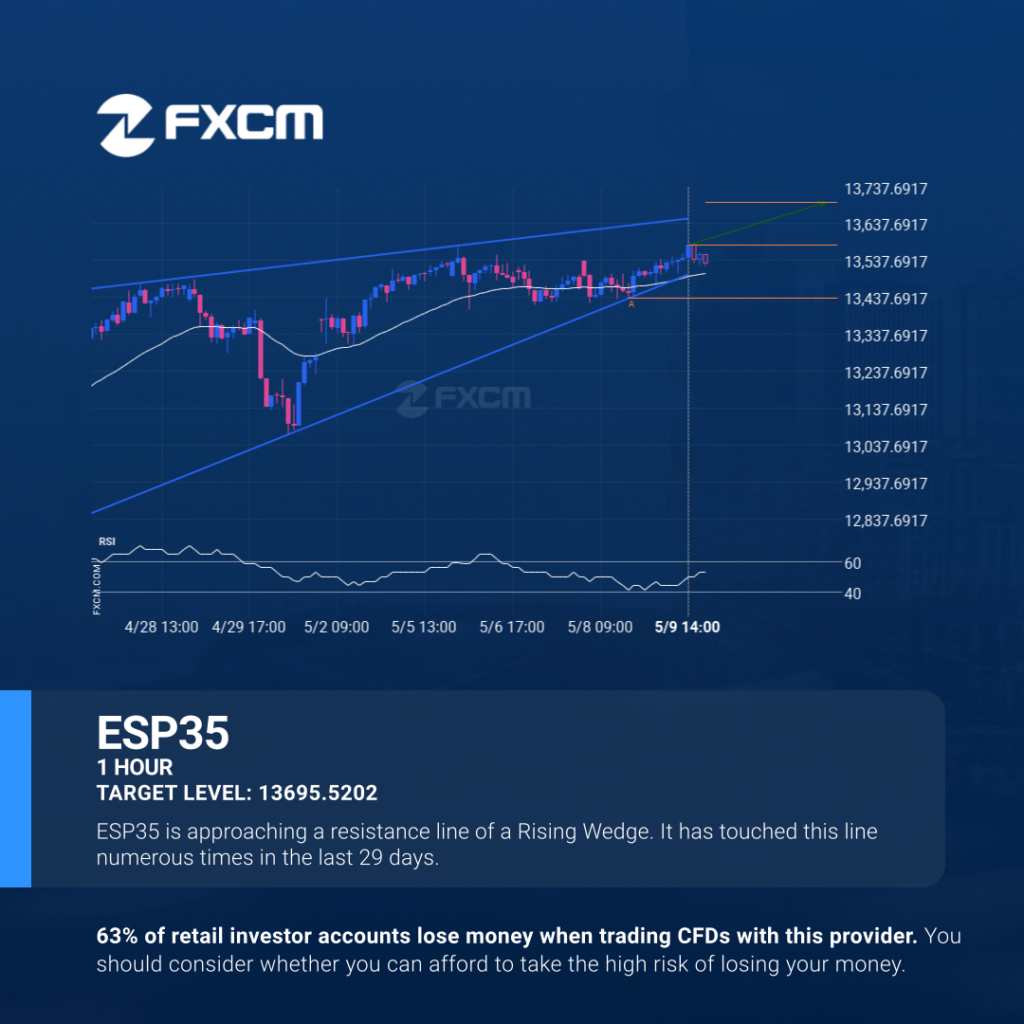
ESP35 is moving towards a resistance line which it has tested numerous times in the past. We have seen it retrace from this line before, so at this stage it isn’t clear whether it will breach this line or rebound as it did before. If ESP35 continues in its current trajectory, we could see it […]
ESP35 – Patrón de gráfico Continuation – Cuña ascendente
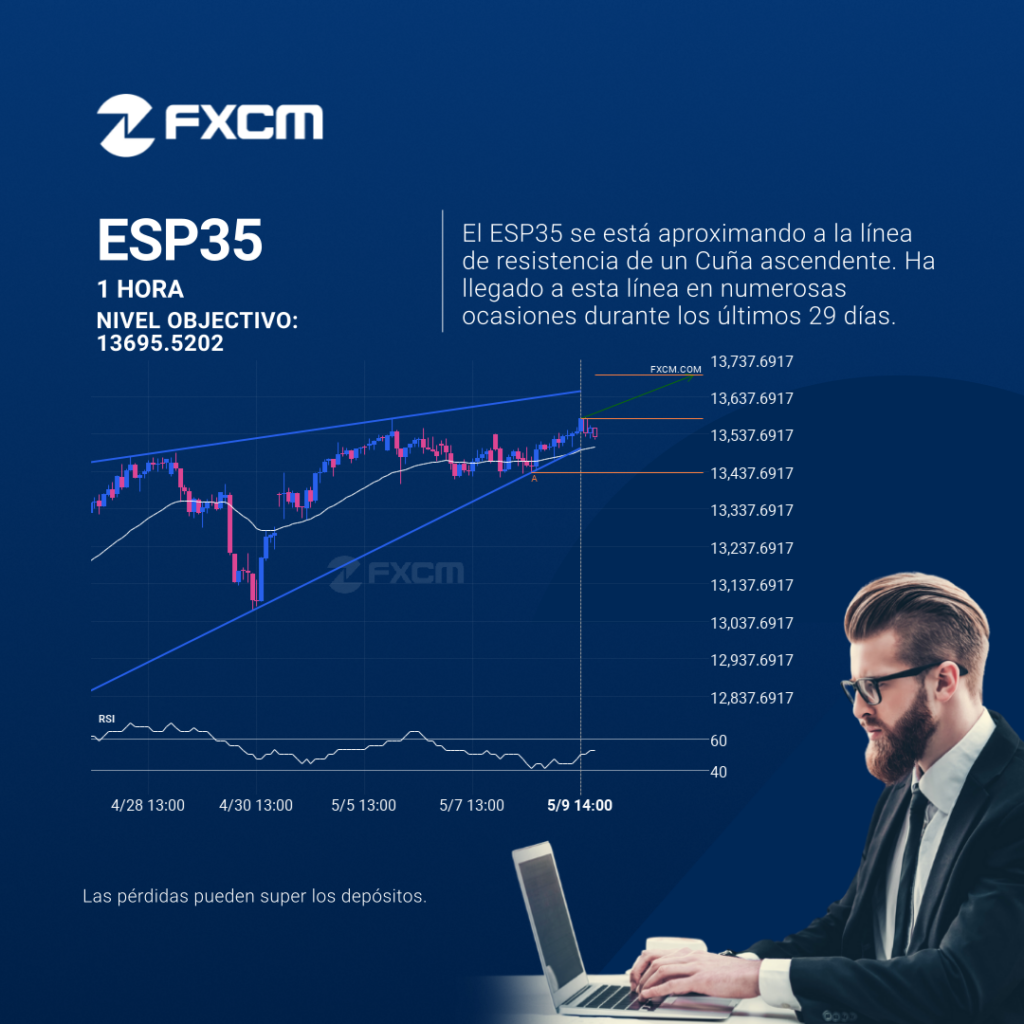
El ESP35 avanza hacia la línea de resistencia de un Cuña ascendente, que ya ha probado varias veces en el pasado. Hemos visto un retroceso antes desde esta línea, así que en esta etapa no está claro si atravesará esta línea o se recuperará como lo ha hecho anteriormente. Si el ESP35 continúa con esta […]
A potential bullish movement on ESP35
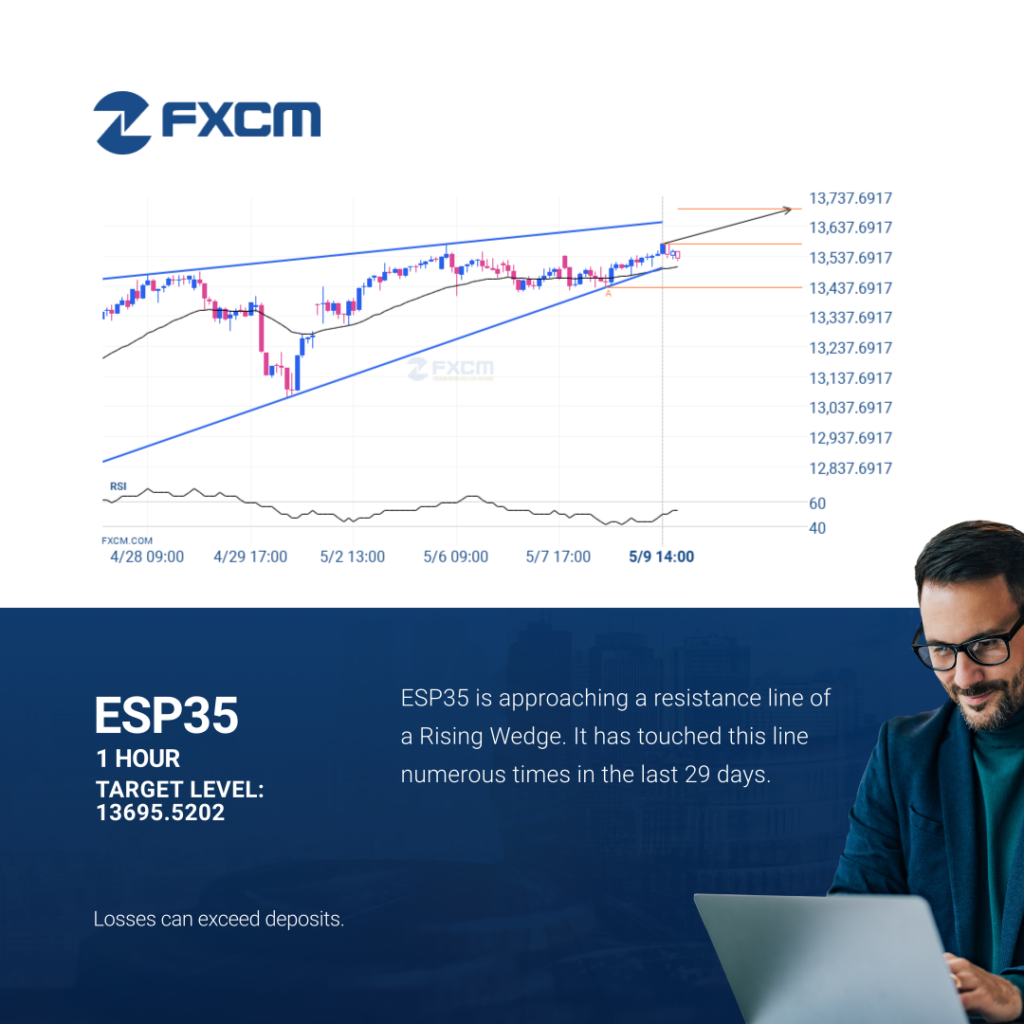
ESP35 is moving towards a resistance line which it has tested numerous times in the past. We have seen it retrace from this line before, so at this stage it isn’t clear whether it will breach this line or rebound as it did before. If ESP35 continues in its current trajectory, we could see it […]
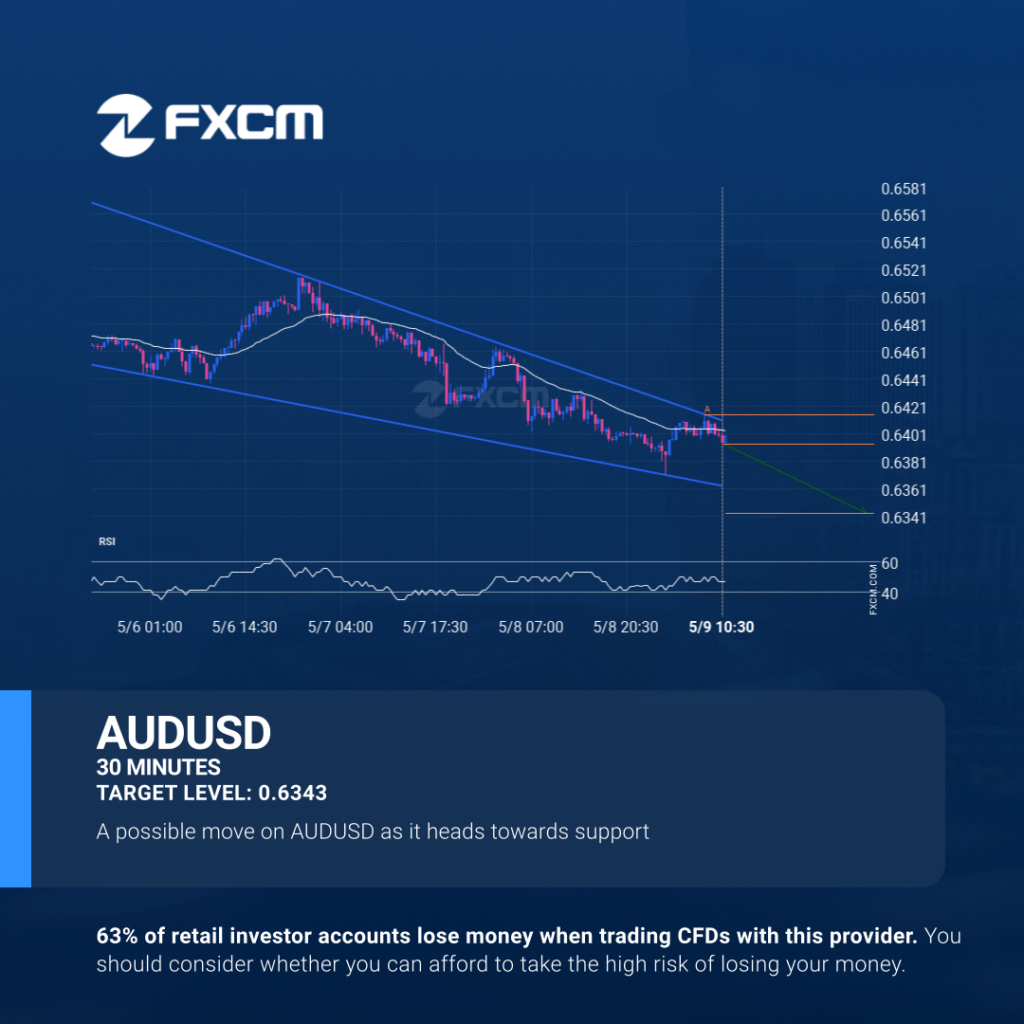
Should we expect a breakout or a rebound on AUDUSD?

AUDUSD is trapped in a Falling Wedge formation, implying that a breakout is Imminent. This is a great trade-setup for both trend and swing traders. It is now approaching a resistance line that has been tested in the past. Divergence opportunists may be very optimistic about a possible breakout and this may be the start […]
¿Deberíamos esperar una ruptura o una recuperación del AUDUSD?
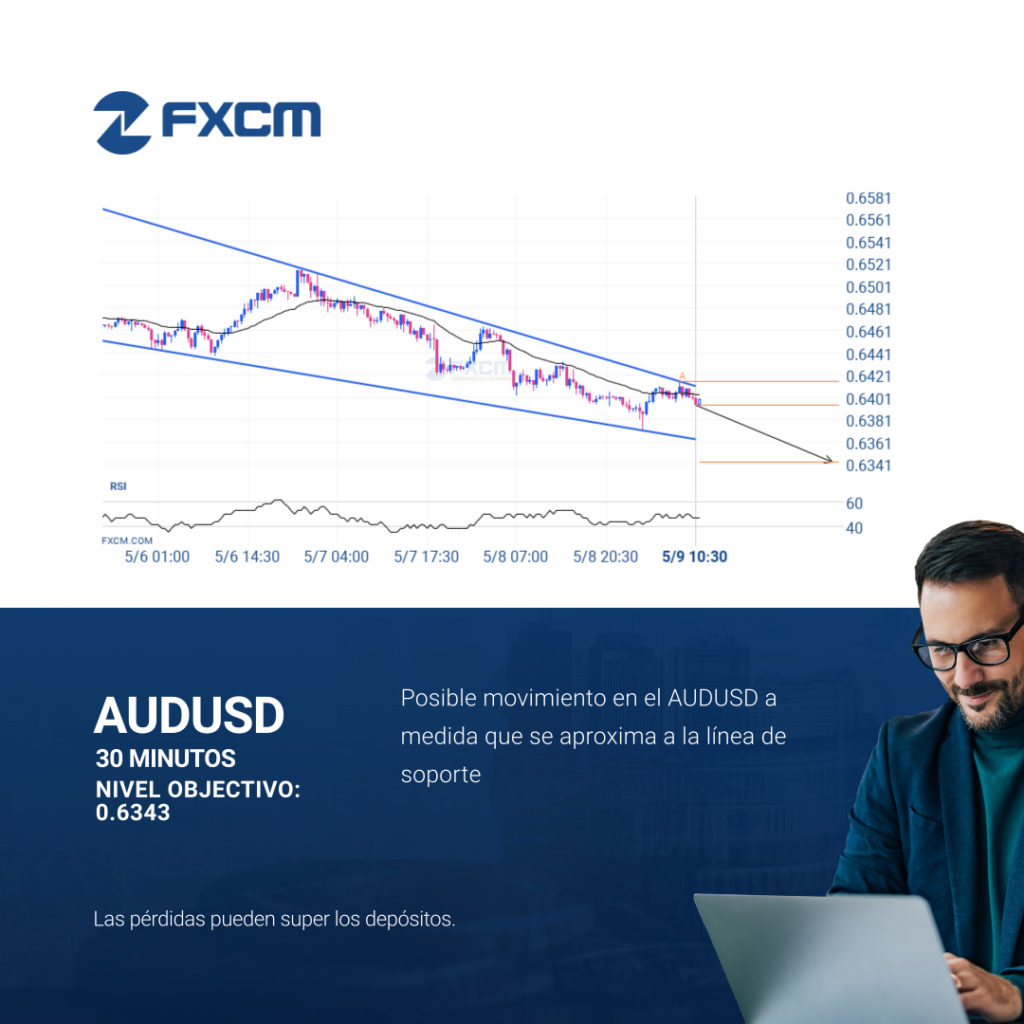
El patrón de Cuña descendente emergente en su ola final se identificó en el gráfico de 30 Minutos de AUDUSD. Después de un fuerte movimiento bajista, encontramos que AUDUSD se dirige hacia la línea del triángulo superior con una posible resistencia en 0.6343. Si resulta que el nivel de soporte aguanta, el patrón de Cuña […]
Should we expect a breakout or a rebound on AUDUSD?
AUDUSD is trapped in a Falling Wedge formation, implying that a breakout is Imminent. This is a great trade-setup for both trend and swing traders. It is now approaching a resistance line that has been tested in the past. Divergence opportunists may be very optimistic about a possible breakout and this may be the start […]
Should we expect a breakout or a rebound on AUDUSD?

AUDUSD is trapped in a Falling Wedge formation, implying that a breakout is Imminent. This is a great trade-setup for both trend and swing traders. It is now approaching a resistance line that has been tested in the past. Divergence opportunists may be very optimistic about a possible breakout and this may be the start […]
EURUSD fue hacia abajo
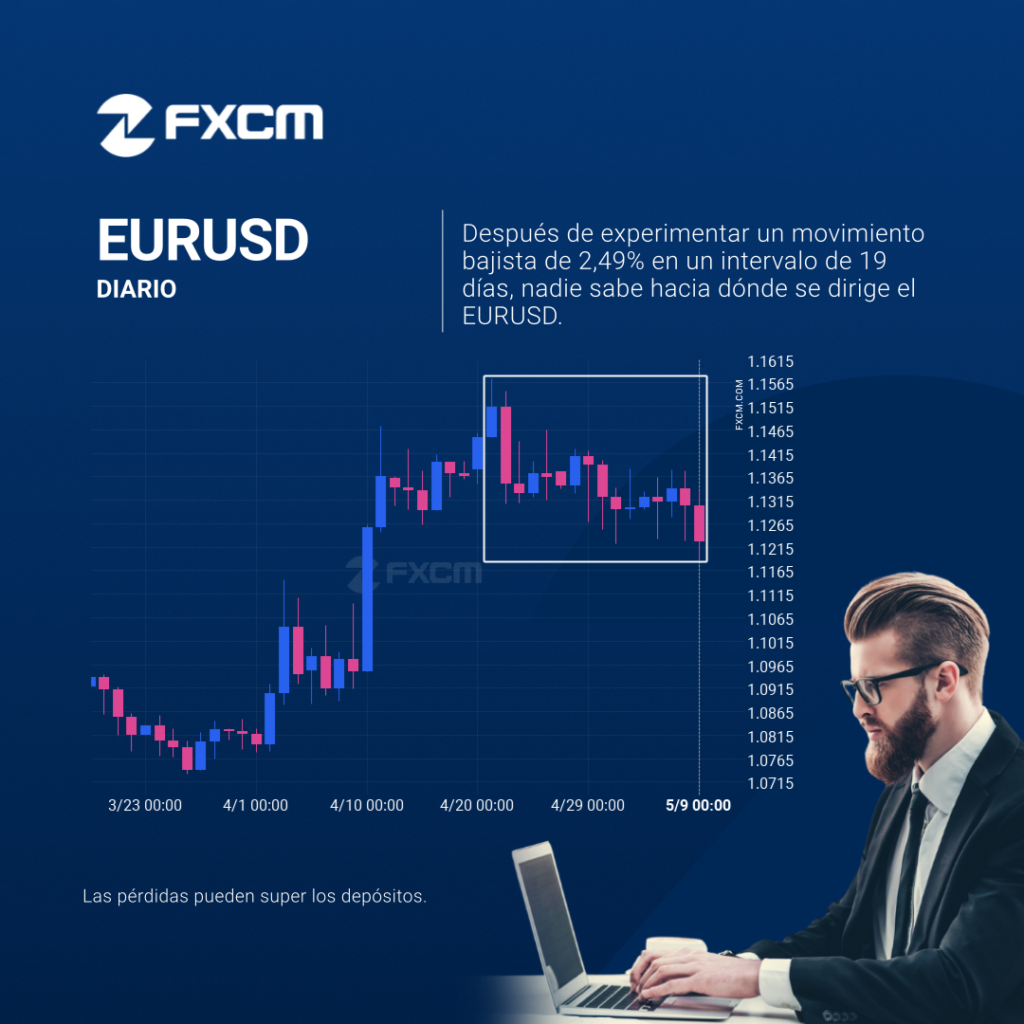
EURUSD experimentó un movimiento extremadamente grande en el último período de 18 días. Puede continuar la tendencia, pero esto haría que el movimiento no tuviera precedentes en el pasado reciente. El rendimiento pasado no es indicativo de resultados futuros. Las pérdidas pueden exceder los fondos depositados.
BTCUSD va en camino hacia arriba

Aquellos de ustedes que sean seguidores de tendencias probablemente estarán observando ansiosamente BTCUSD para comprobar si el último movimiento de un 22,63% continúa. Si no lo hace, las personas fieles al método de reversión a la media estarán encantadas con este excepcionalmente gran movimiento de 32 días. El rendimiento pasado no es indicativo de resultados […]