EURCHF has broken through resistance

The last 9 4 hour candles on EURCHF formed a Triangle pattern and broken out through the pattern lines, indicating a possible bullish movement towards the price level of 0.9458. Past performance is not an indicator of future results. Losses can exceed deposits.
BTCUSD – línea de precio psicológico atravesada
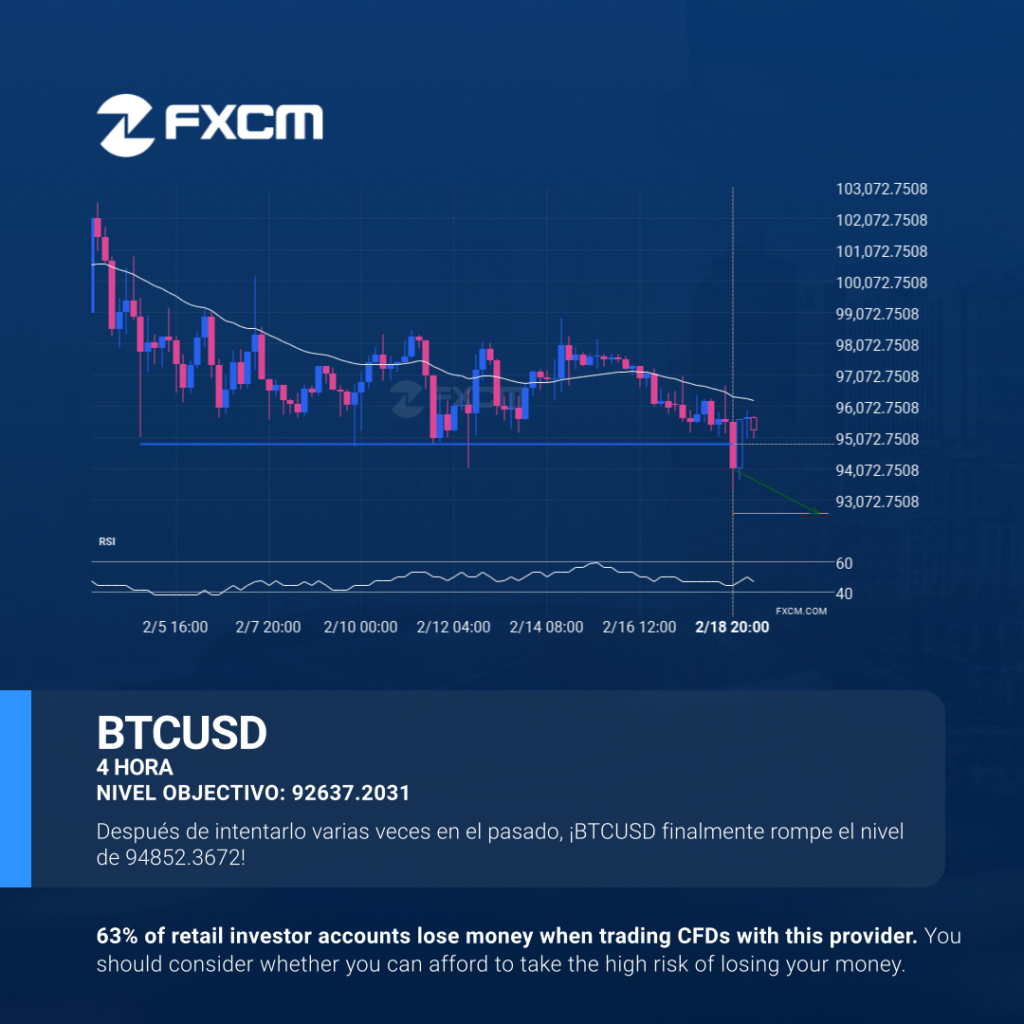
La rotura del BTCUSD a través de la línea de precio en 94852.3672 es una brecha de un importante precio psicológico que se ha probado numerosas veces en el pasado. Si esta rotura persiste, el BTCUSD podría probar el nivel de 92637.2031 durante las siguientes 3 días. Habría que ser prudentes antes de ejecutar una […]
HKG33 is on the approach
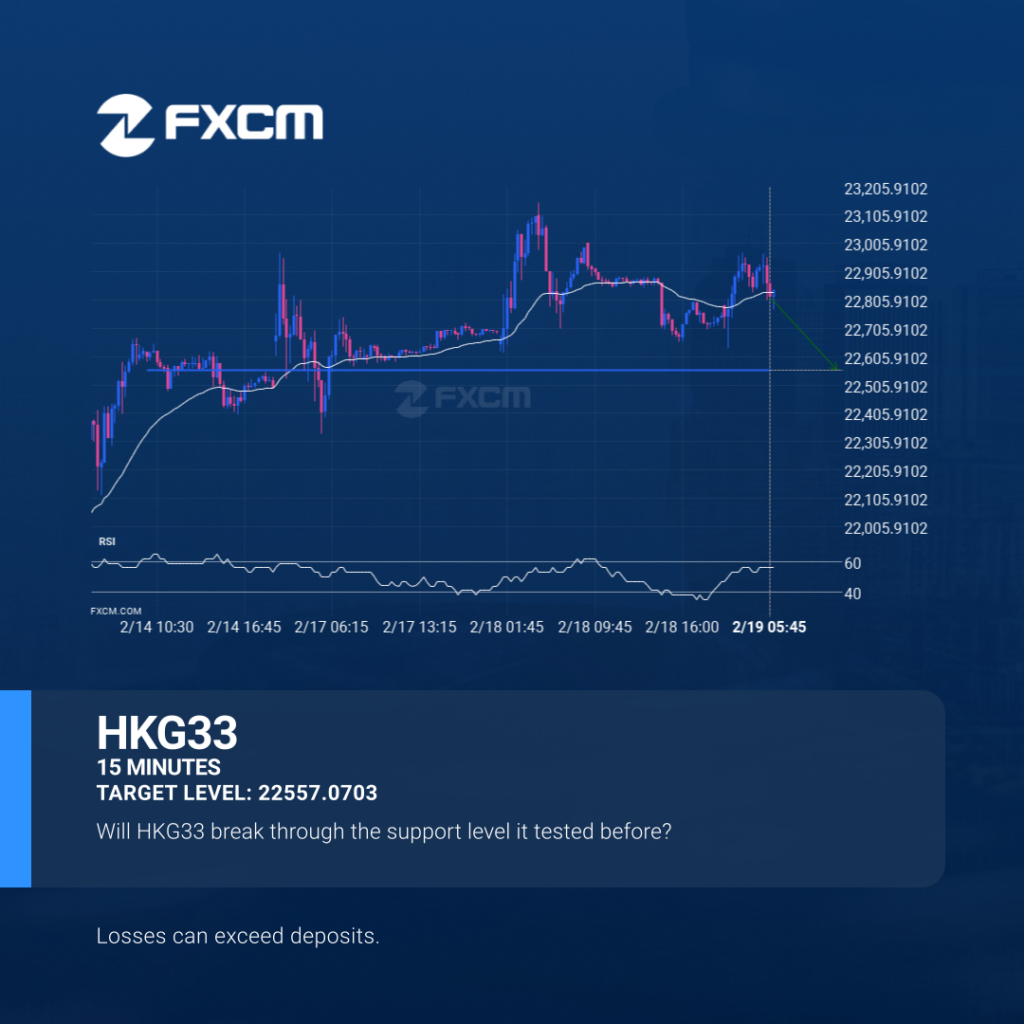
The movement of HKG33 towards 22557.0703 price line is yet another test of the line it reached numerous times in the past. We could expect this test to happen in the next 11 hours, but it is uncertain whether it will result in a breakout through this line, or simply rebound back to current lines. […]
EURCHF has broken through resistance

The last 9 4 hour candles on EURCHF formed a Triangle pattern and broken out through the pattern lines, indicating a possible bullish movement towards the price level of 0.9458. Past performance is not an indicator of future results. 64% of retail investor accounts lose money when trading CFDs with this provider. You should consider […]
Will ESP35 have enough momentum to break support?
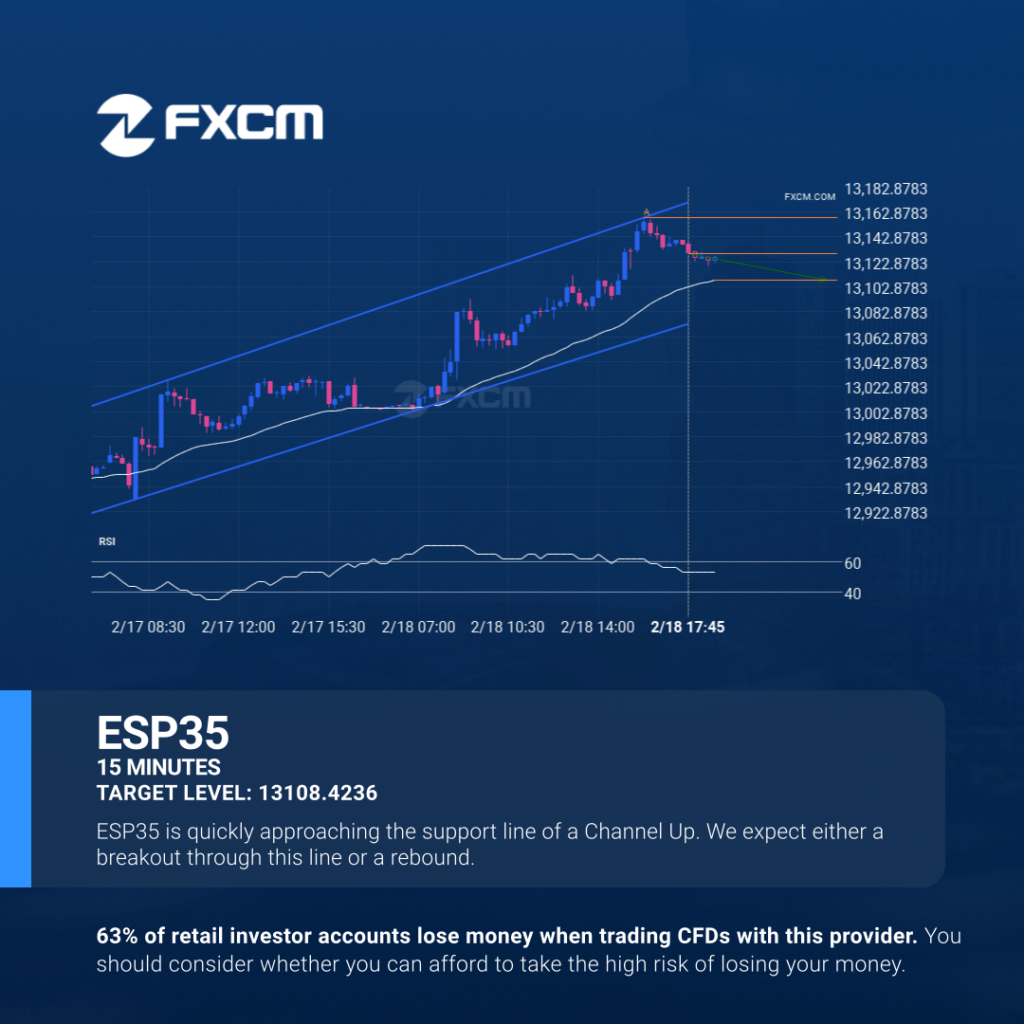
ESP35 is heading towards the support line of a Channel Up and could reach this point within the next 6 hours. It has tested this line numerous times in the past, and this time could be no different from the past, ending in a rebound instead of a breakout. If the breakout doesn’t happen, we […]
AUDUSD approaching resistance level
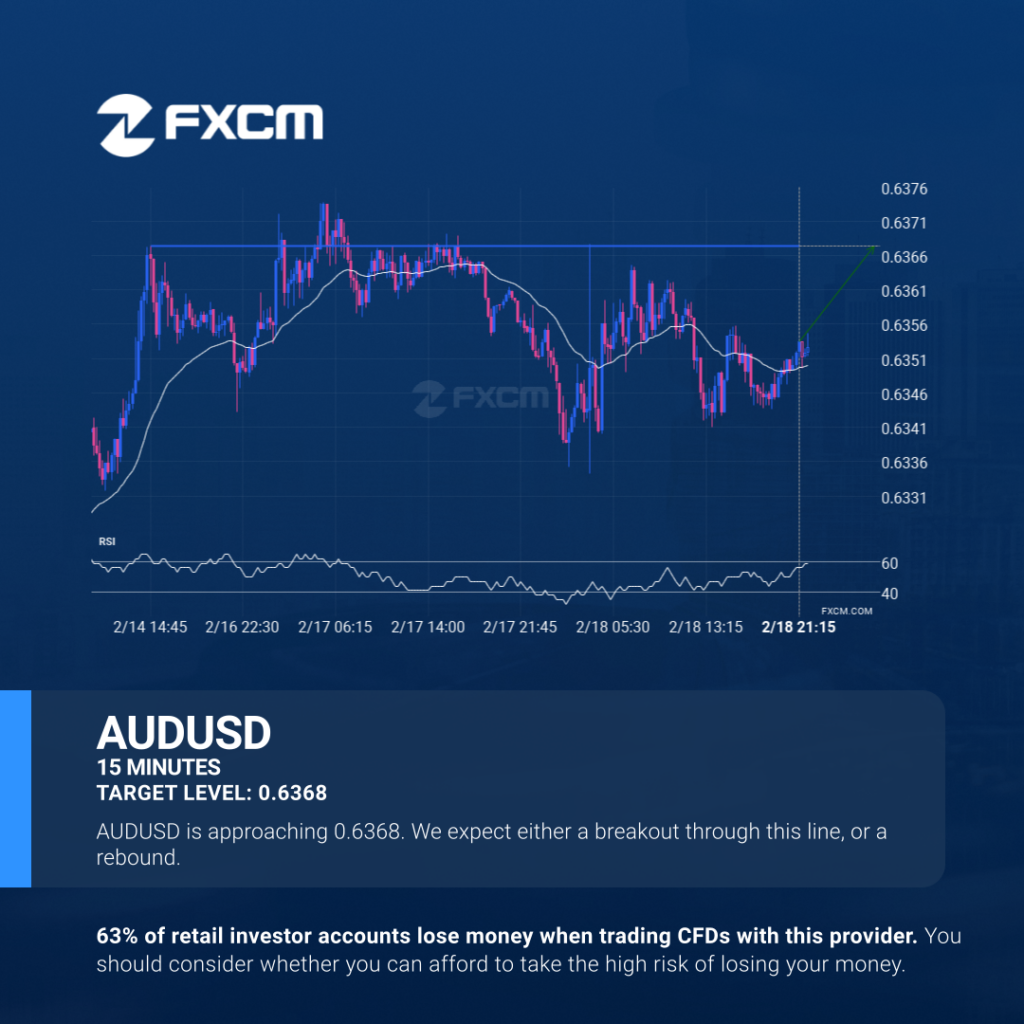
AUDUSD is approaching a resistance line at 0.6368. If it hits the resistance line, it may break through this level to continue the bullish trend, or it may turn around back to current levels. Past performance is not an indicator of future results. 64% of retail investor accounts lose money when trading CFDs with this […]
AUDUSD acercándose a nivel de resistencia
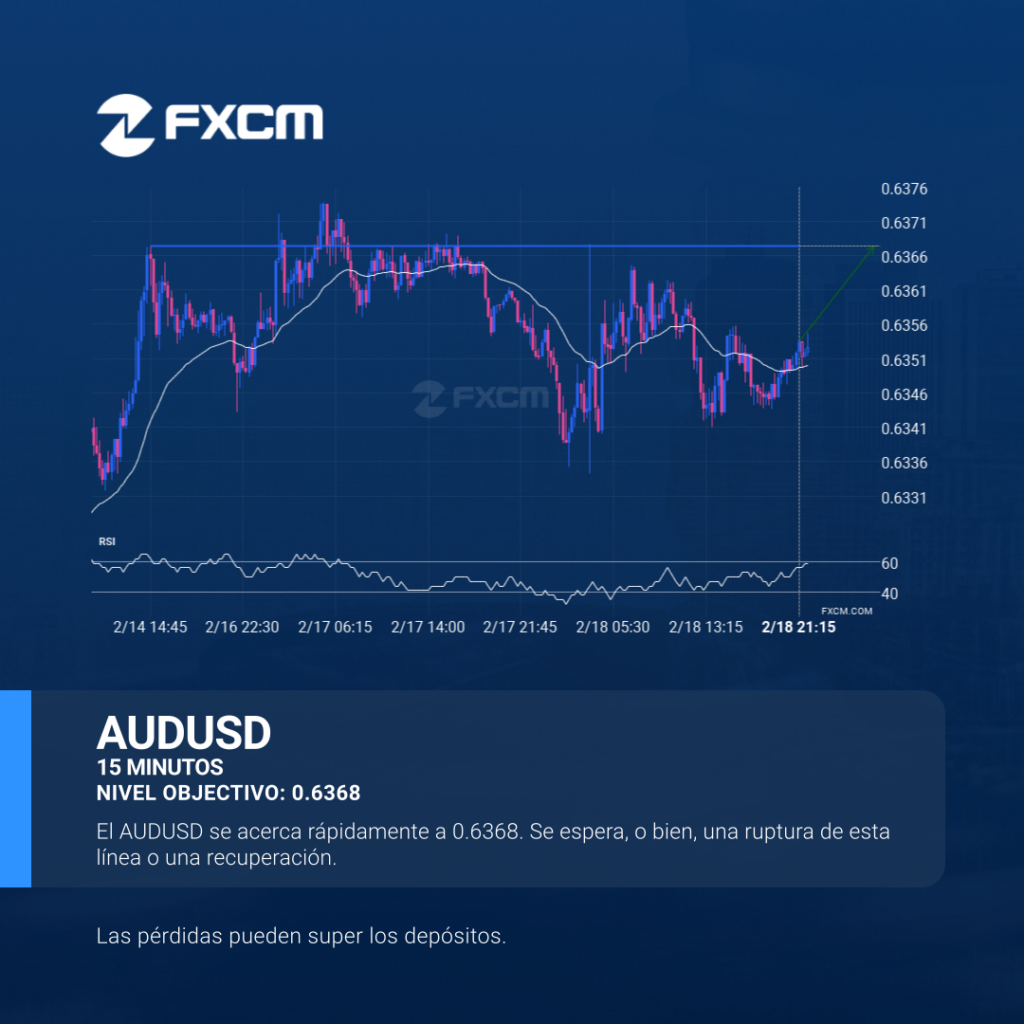
AUDUSD se está acercando a una línea de resistencia en 0.6368. Si llega a la línea de resistencia, puede atravesar este nivel para continuar con la tendencia alcista, o puede girarse y volver a los niveles actuales. El rendimiento pasado no es indicativo de resultados futuros. Las pérdidas pueden exceder los fondos depositados.
Will ESP35 have enough momentum to break support?
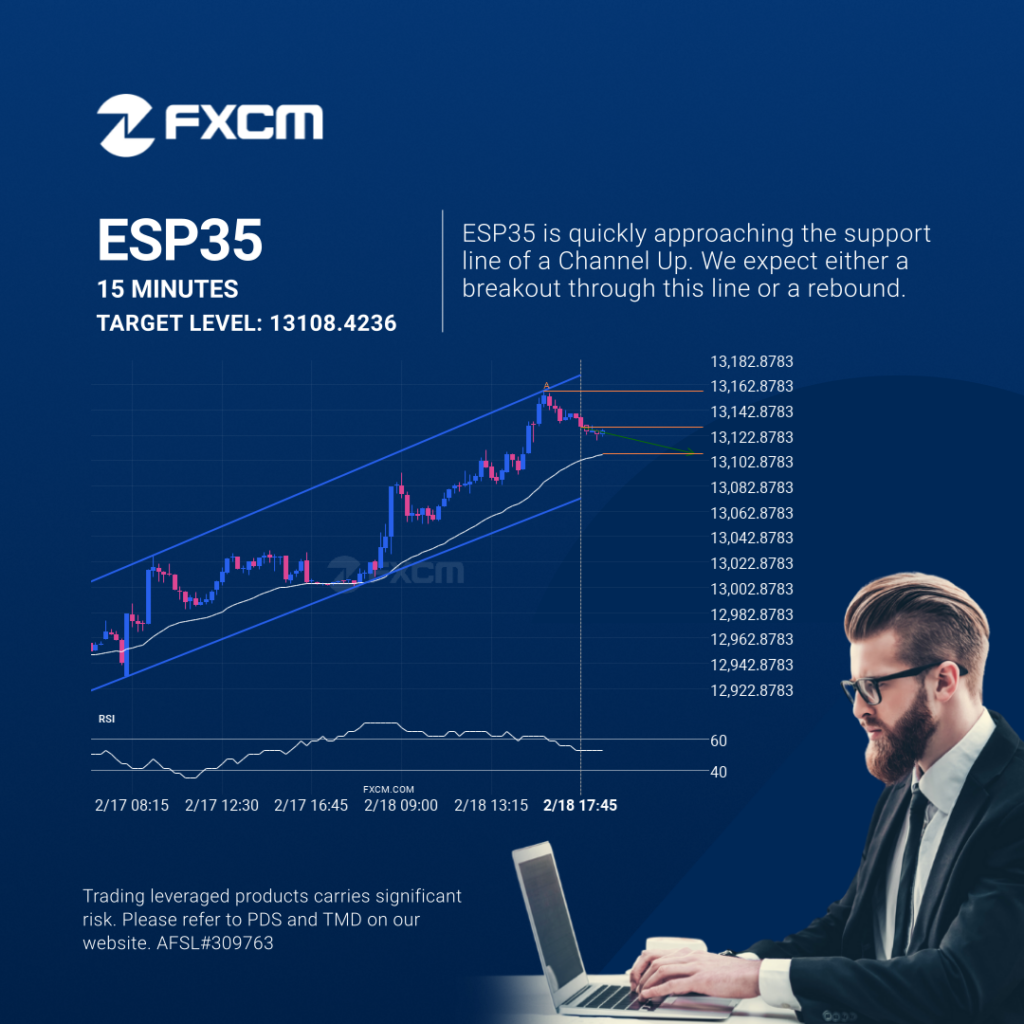
ESP35 is heading towards the support line of a Channel Up and could reach this point within the next 6 hours. It has tested this line numerous times in the past, and this time could be no different from the past, ending in a rebound instead of a breakout. If the breakout doesn’t happen, we […]
AUDUSD approaching resistance level
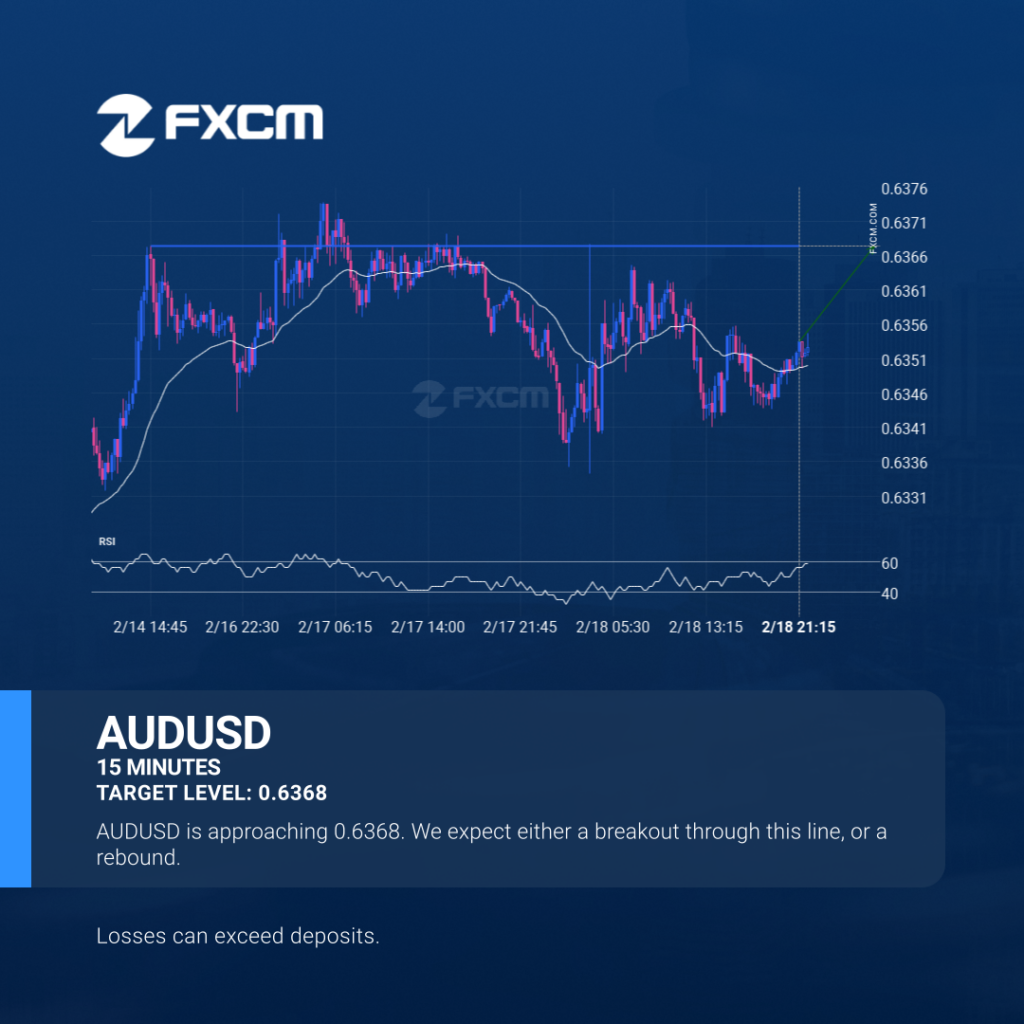
AUDUSD is approaching a resistance line at 0.6368. If it hits the resistance line, it may break through this level to continue the bullish trend, or it may turn around back to current levels. Past performance is not an indicator of future results. Losses can exceed deposits.
AUDUSD approaching resistance level

AUDUSD is approaching a resistance line at 0.6368. If it hits the resistance line, it may break through this level to continue the bullish trend, or it may turn around back to current levels. Past performance is not an indicator of future results. Trading leveraged products carries significant risk. Please refer to PDS and TMD […]