Should we expect a bullish trend on AUDUSD?
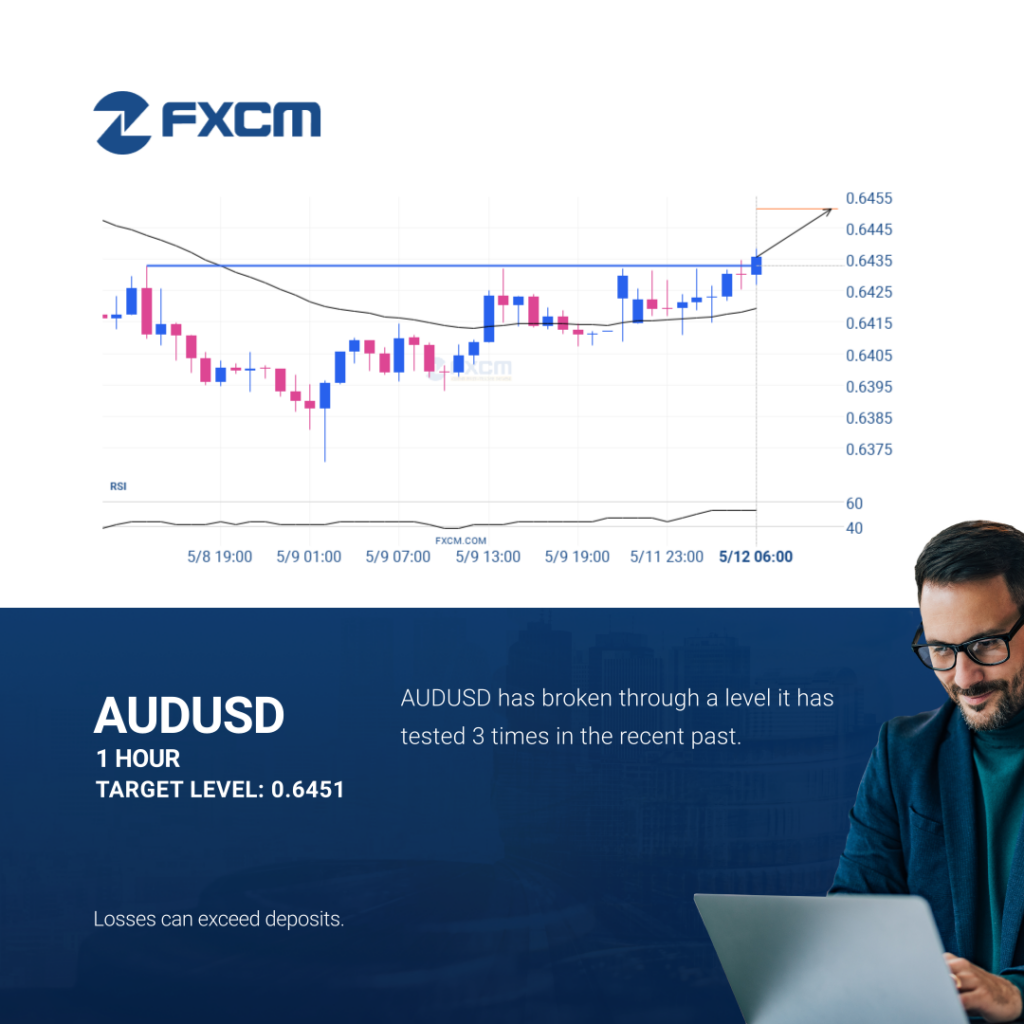
AUDUSD has broken through 0.6433 which it has tested numerous times in the past. We have seen it retrace from this price in the past. If this new trend persists, AUDUSD may be heading towards 0.6451 within the next 9 hours. Past performance is not an indicator of future results. Losses can exceed deposits.
¿Deberíamos esperar una ruptura o una recuperación del HKG33?
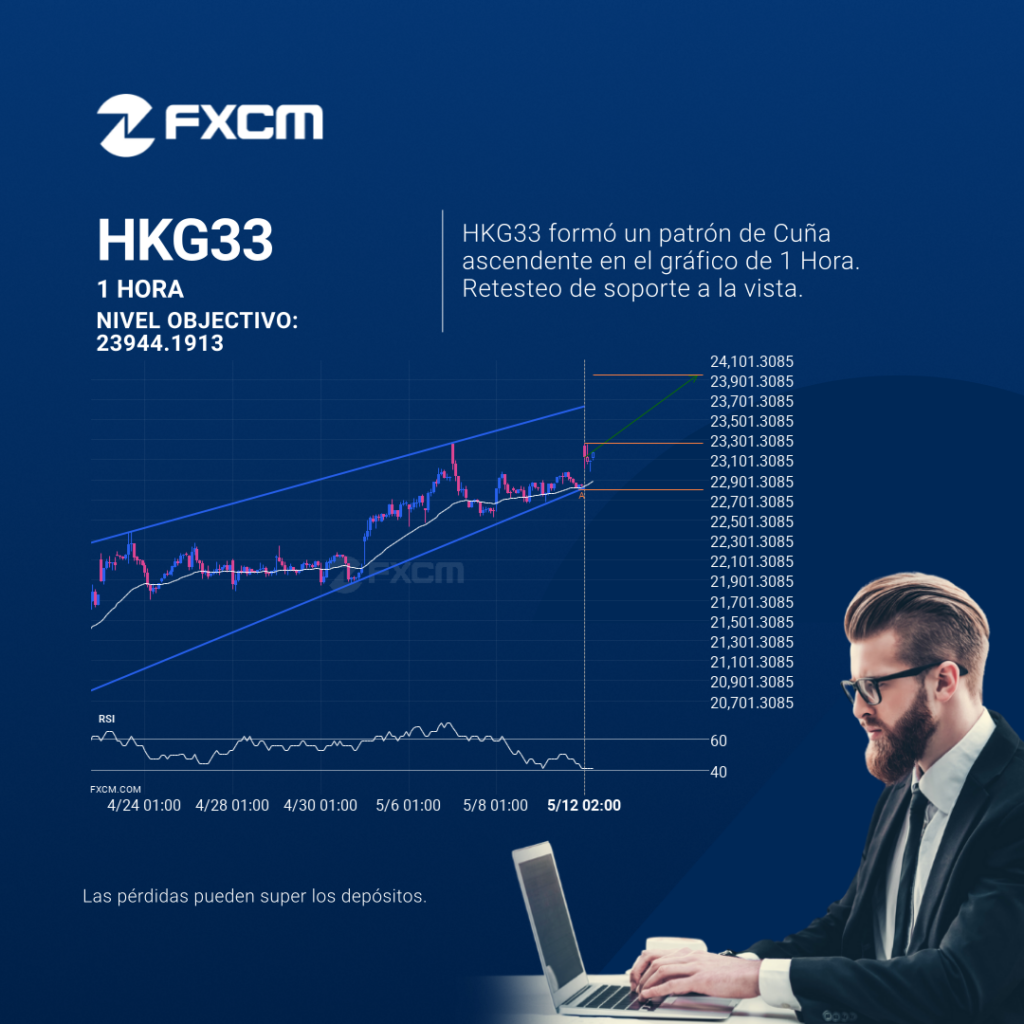
HKG33 se identificó alrededor de 23261.42 después de haber rebotado recientemente en un nivel de soporte en el intervalo temporal de 1 Hora. En última instancia, la acción del precio del activo ha formado un patrón de Cuña ascendente. Esta presión puede aumentar las posibilidades de una fuerte rotura. El movimiento proyectado potencialmente llevará el […]
Should we expect a bullish trend on AUDUSD?
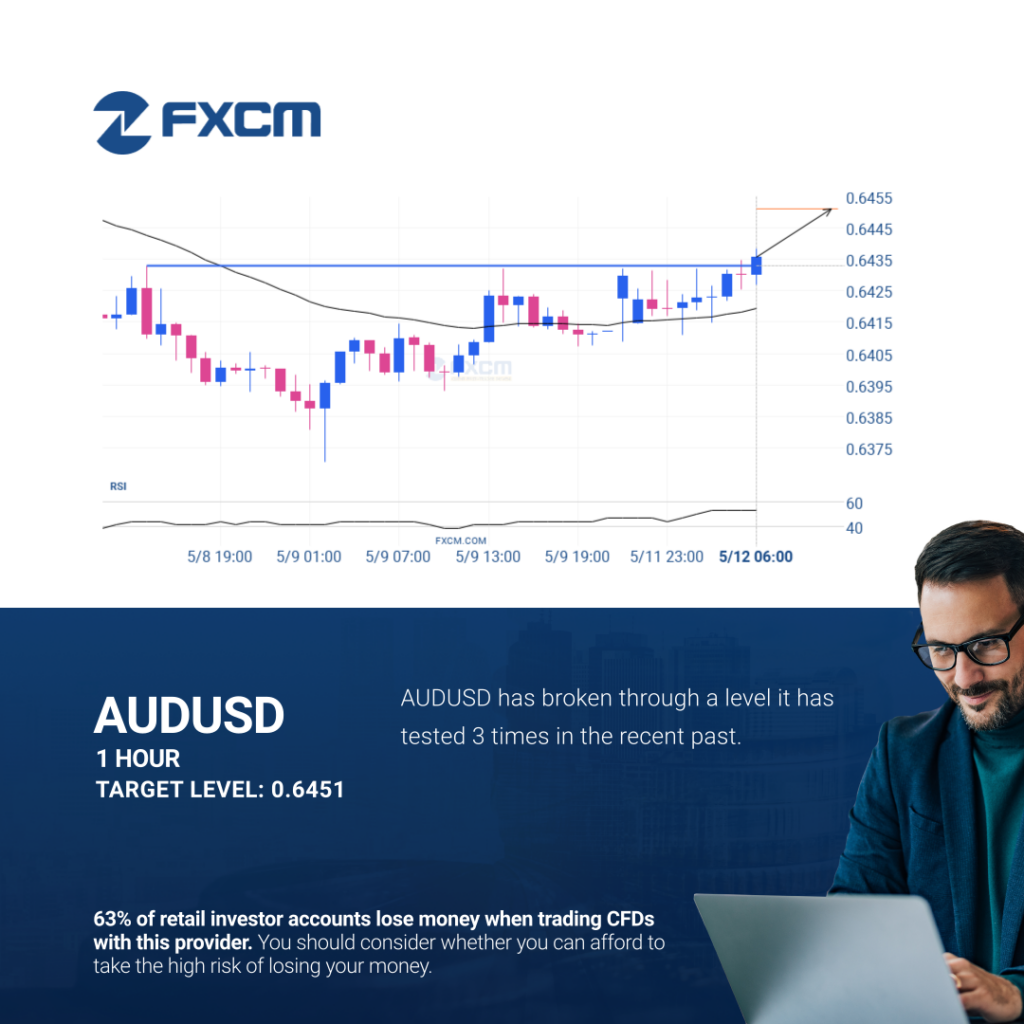
AUDUSD has broken through 0.6433 which it has tested numerous times in the past. We have seen it retrace from this price in the past. If this new trend persists, AUDUSD may be heading towards 0.6451 within the next 9 hours. Past performance is not an indicator of future results. Trading leveraged products carries significant […]
¿Deberíamos esperar una tendencia alcista en el AUDUSD?

El AUDUSD ha atravesado 0.6433, que ha probado ya varias veces en el pasado. Ya hemos visto un retroceso de esta posición en numerosas ocasiones. Si esta nueva tendencia persiste, AUDUSD podría dirigirse al nivel 0.6451 dentro de las próximas 9 horas. El rendimiento pasado no es indicativo de resultados futuros. Las pérdidas pueden exceder […]
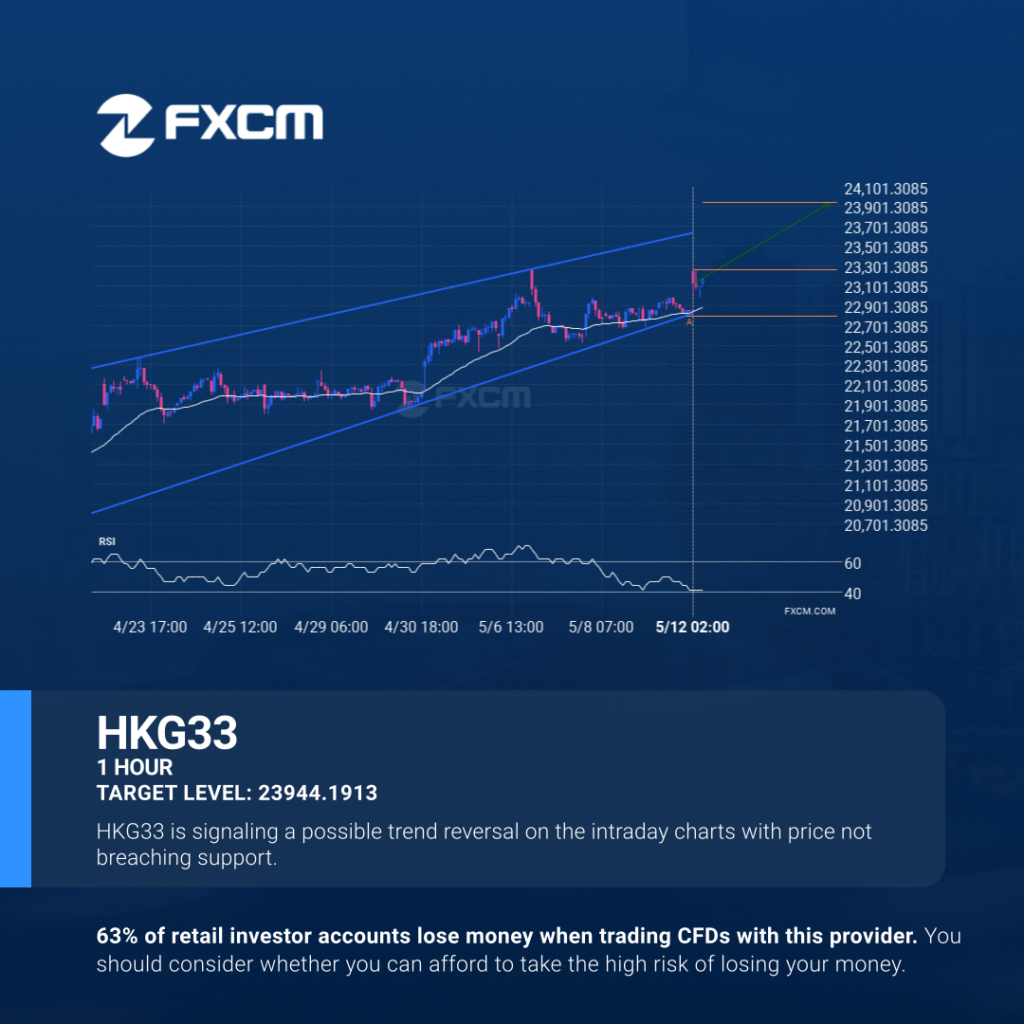
Should we expect a breakout or a rebound on HKG33?
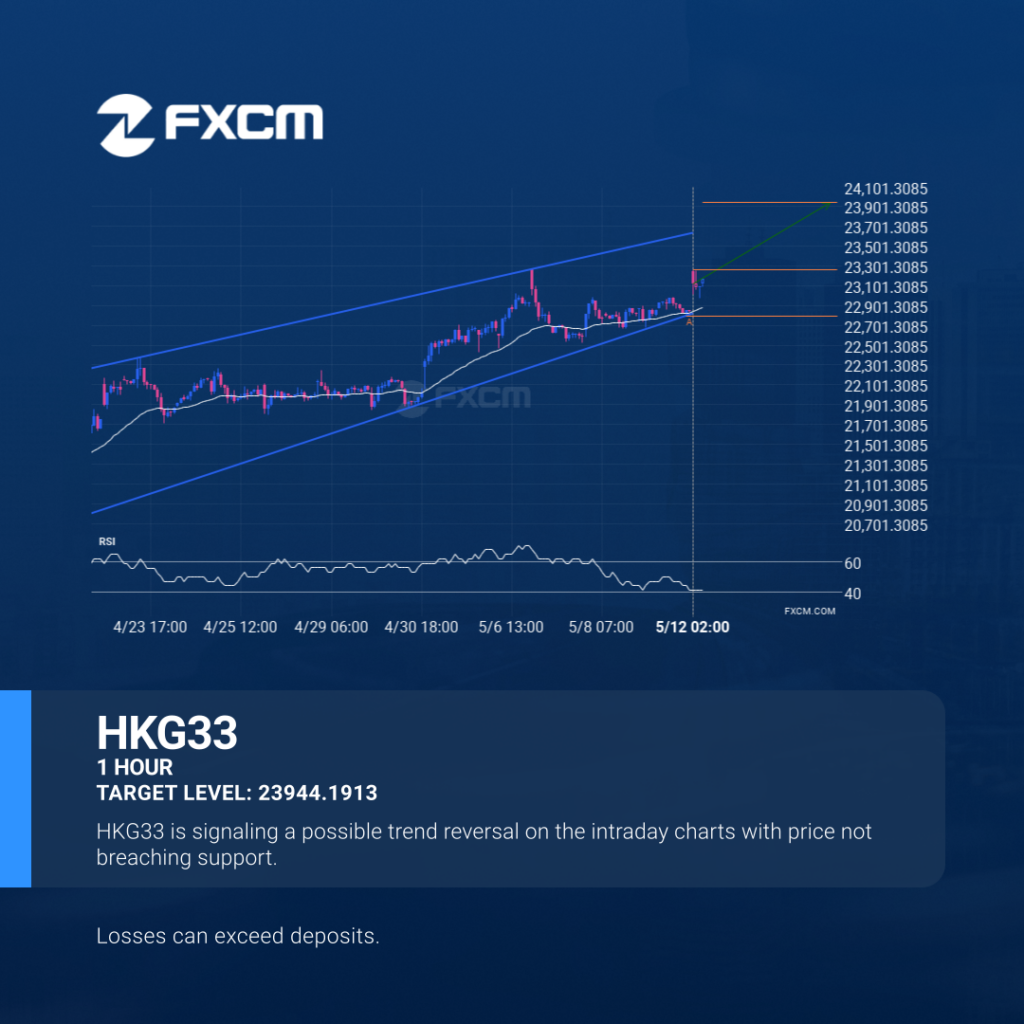
Emerging Rising Wedge detected on HKG33 – the pattern is an emerging one and has not yet broken through support, but the price is expected to move up over the next few hours. The price at the time the pattern was found was 23261.42 and it is expected to move to 23944.1913. Past performance is […]
Should we expect a breakout or a rebound on HKG33?
Emerging Rising Wedge detected on HKG33 – the pattern is an emerging one and has not yet broken through support, but the price is expected to move up over the next few hours. The price at the time the pattern was found was 23261.42 and it is expected to move to 23944.1913. Past performance is […]
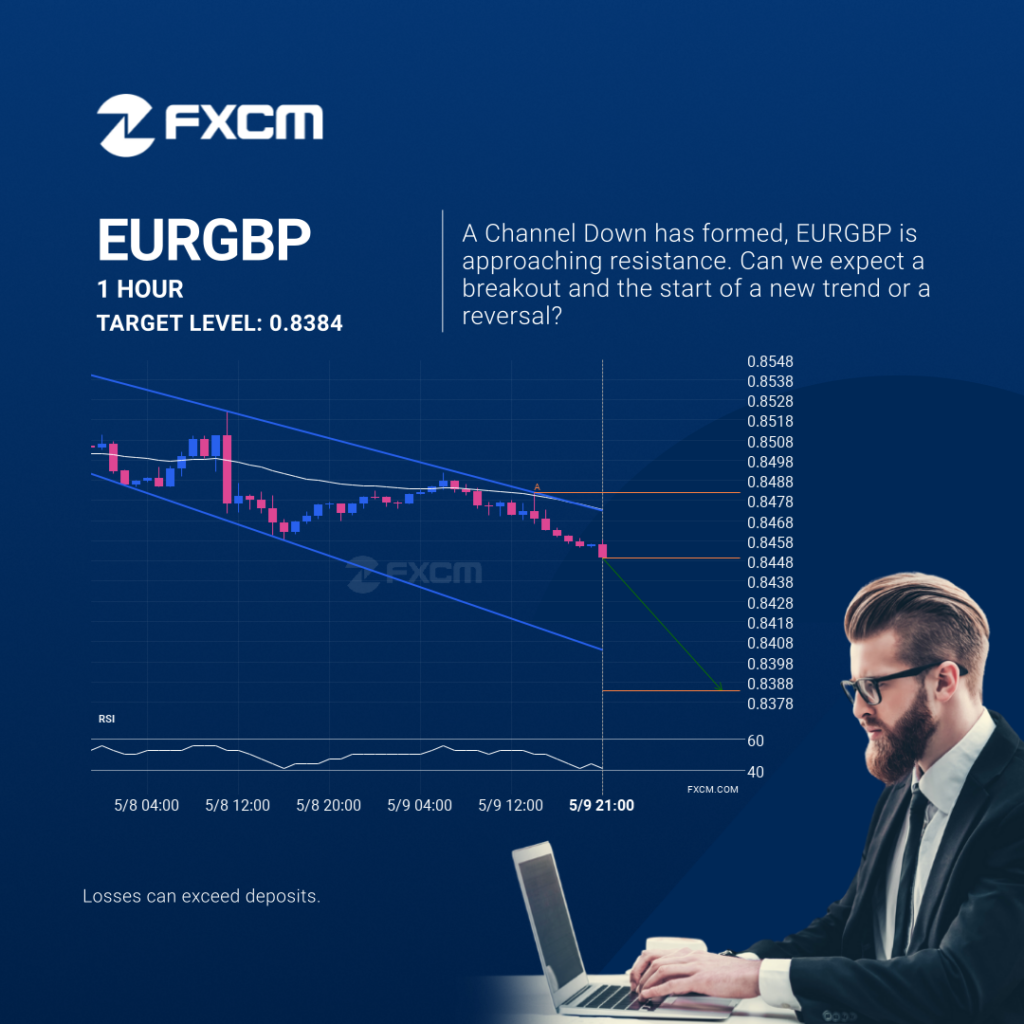
Will EURGBP have enough momentum to break support?
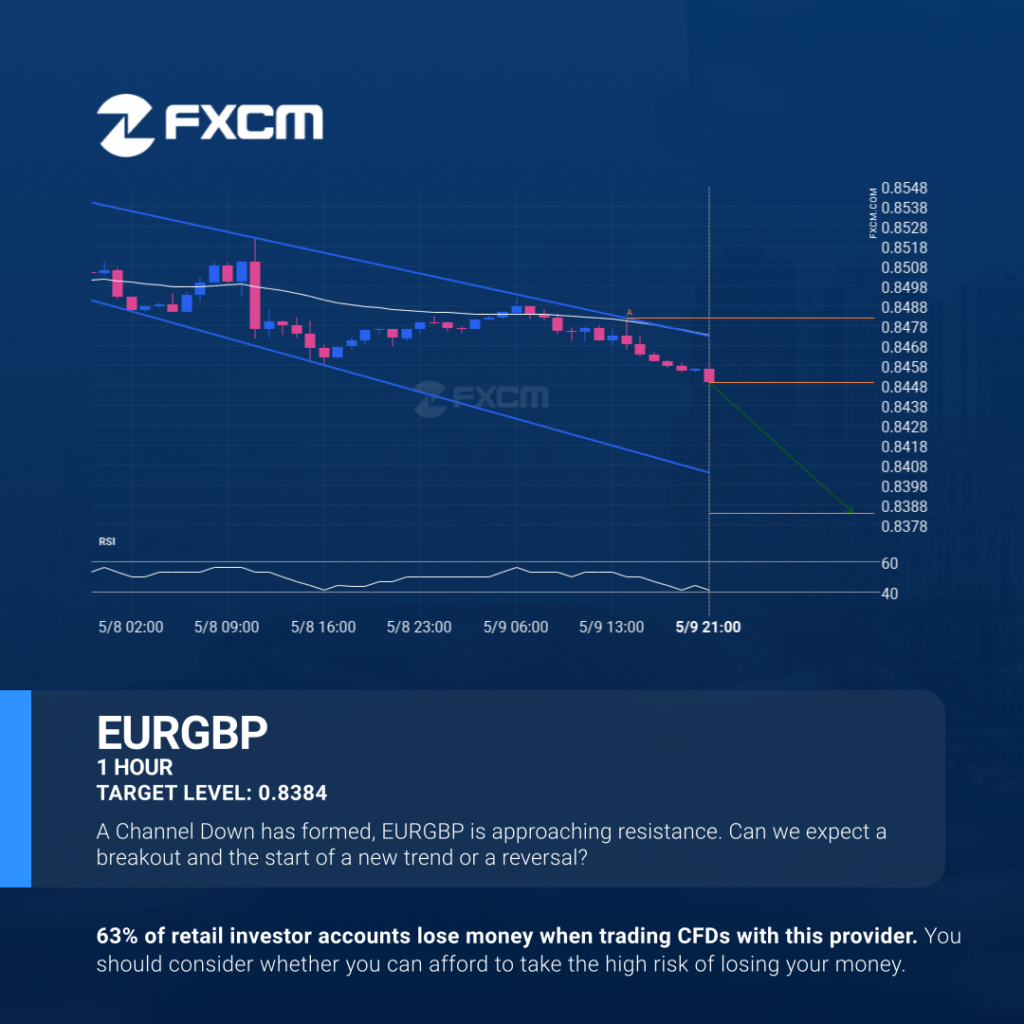
EURGBP is trapped in a Channel Down formation, implying that a breakout is Imminent. This is a great trade-setup for both trend and swing traders. It is now approaching a resistance line that has been tested in the past. Divergence opportunists may be very optimistic about a possible breakout and this may be the start […]
Will EURGBP have enough momentum to break support?

EURGBP is trapped in a Channel Down formation, implying that a breakout is Imminent. This is a great trade-setup for both trend and swing traders. It is now approaching a resistance line that has been tested in the past. Divergence opportunists may be very optimistic about a possible breakout and this may be the start […]
¿Tendrá el EURGBP suficiente impulso como para irrumpir el soporte?
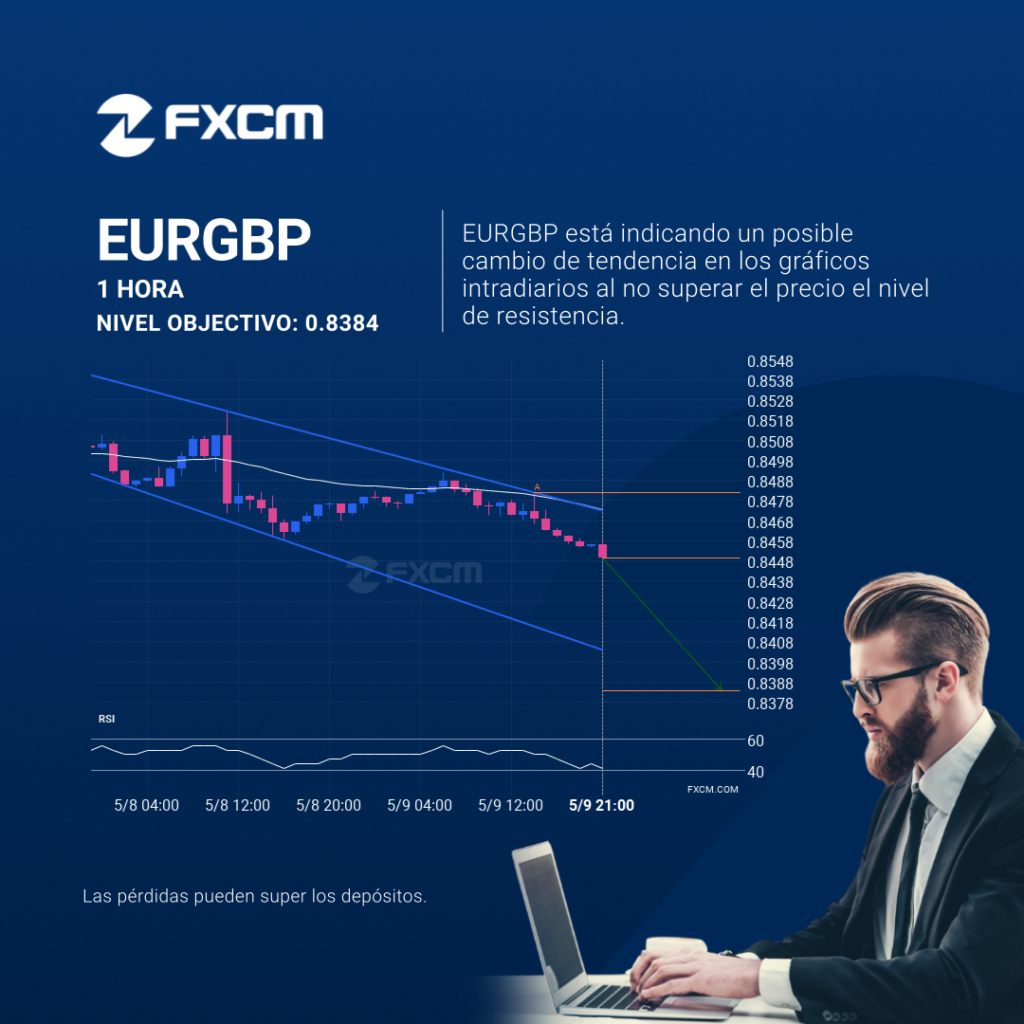
El patrón de Canal bajista emergente en su ola final se identificó en el gráfico de 1 Hora de EURGBP. Después de un fuerte movimiento bajista, encontramos que EURGBP se dirige hacia la línea del triángulo superior con una posible resistencia en 0.8384. Si resulta que el nivel de soporte aguanta, el patrón de Canal […]