A possible start of a bearish trend on ESP35
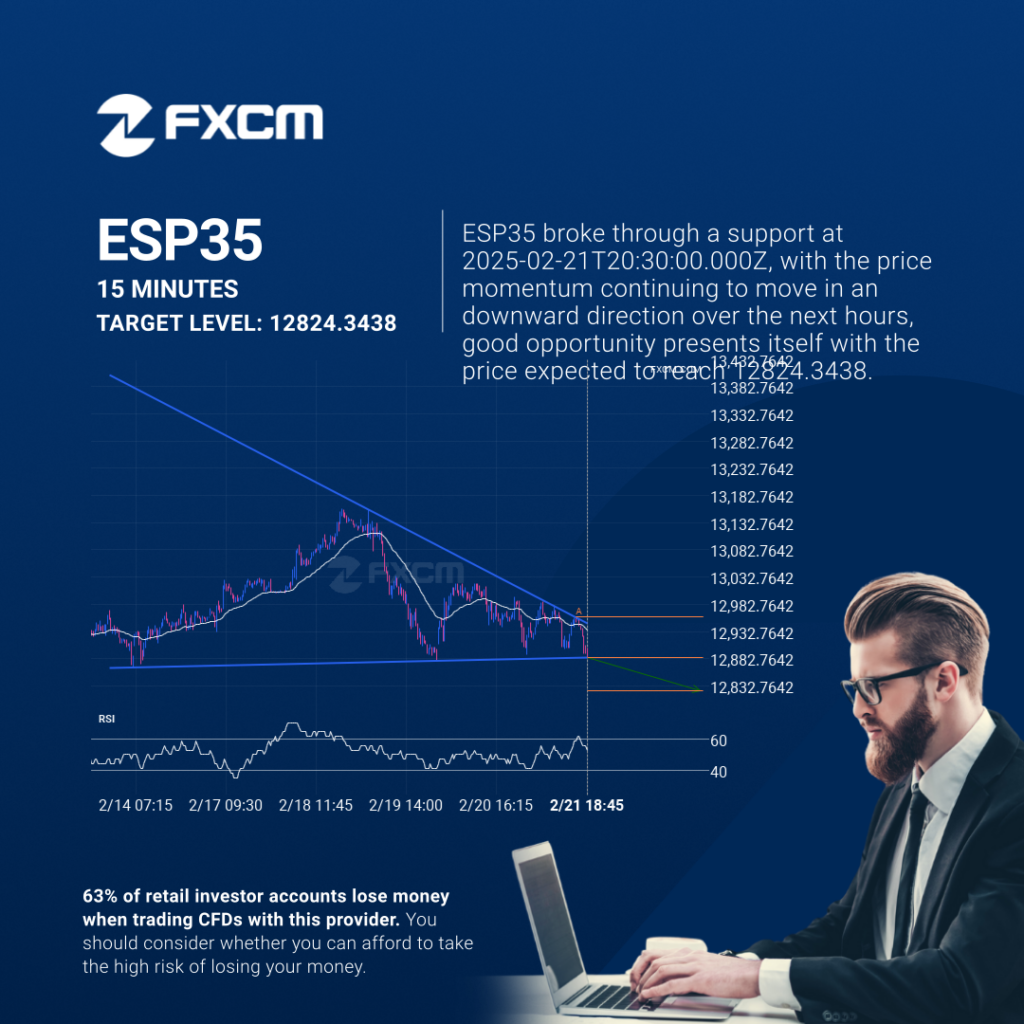
The breakout of ESP35 through the support line of a Descending Triangle could be a sign of the road ahead. If this breakout persists, we may see the price of ESP35 testing 12824.3438 within the next 2 days. Past performance is not an indicator of future results. 63% of retail investor accounts lose money when […]
A possible start of a bearish trend on ESP35
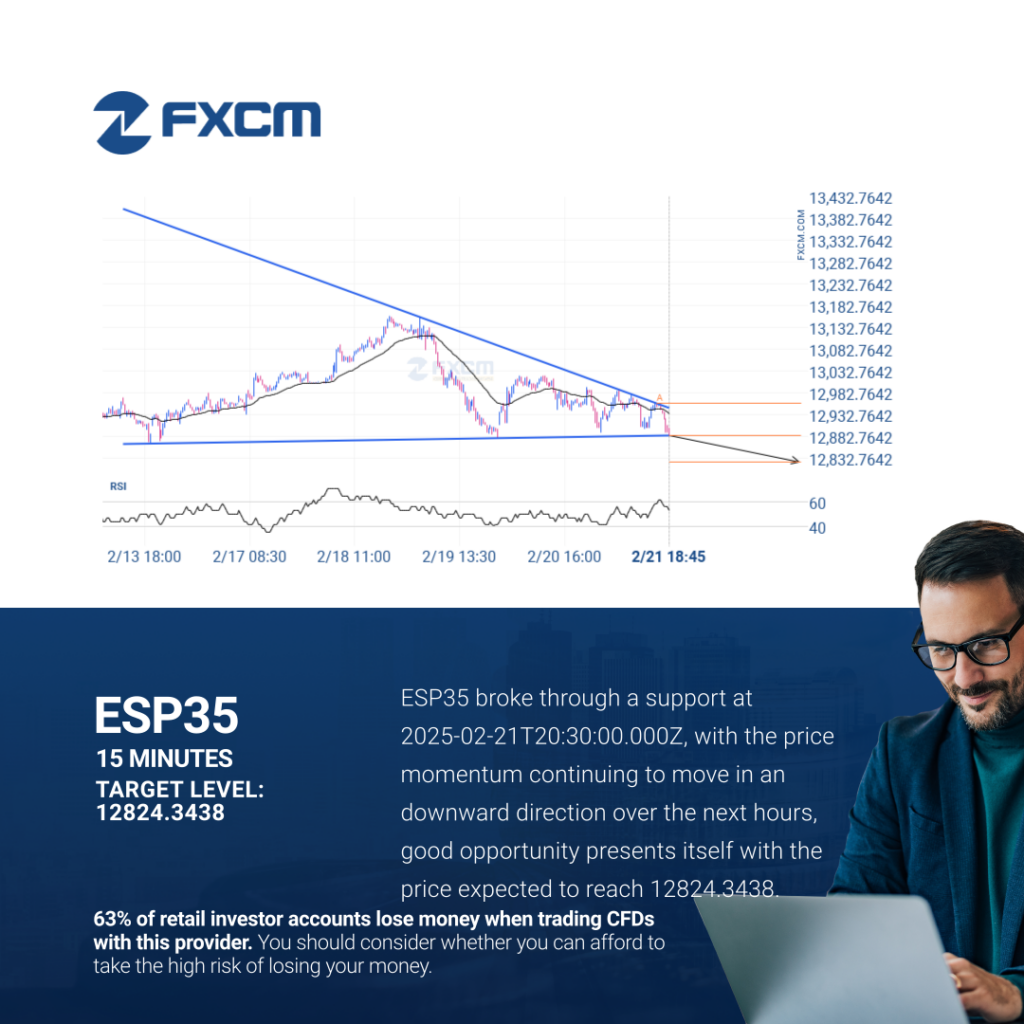
The breakout of ESP35 through the support line of a Descending Triangle could be a sign of the road ahead. If this breakout persists, we may see the price of ESP35 testing 12824.3438 within the next 2 days. Past performance is not an indicator of future results. Trading leveraged products carries significant risk. Please refer […]
GBPUSD – Continuation Chart Pattern – Rising Wedge
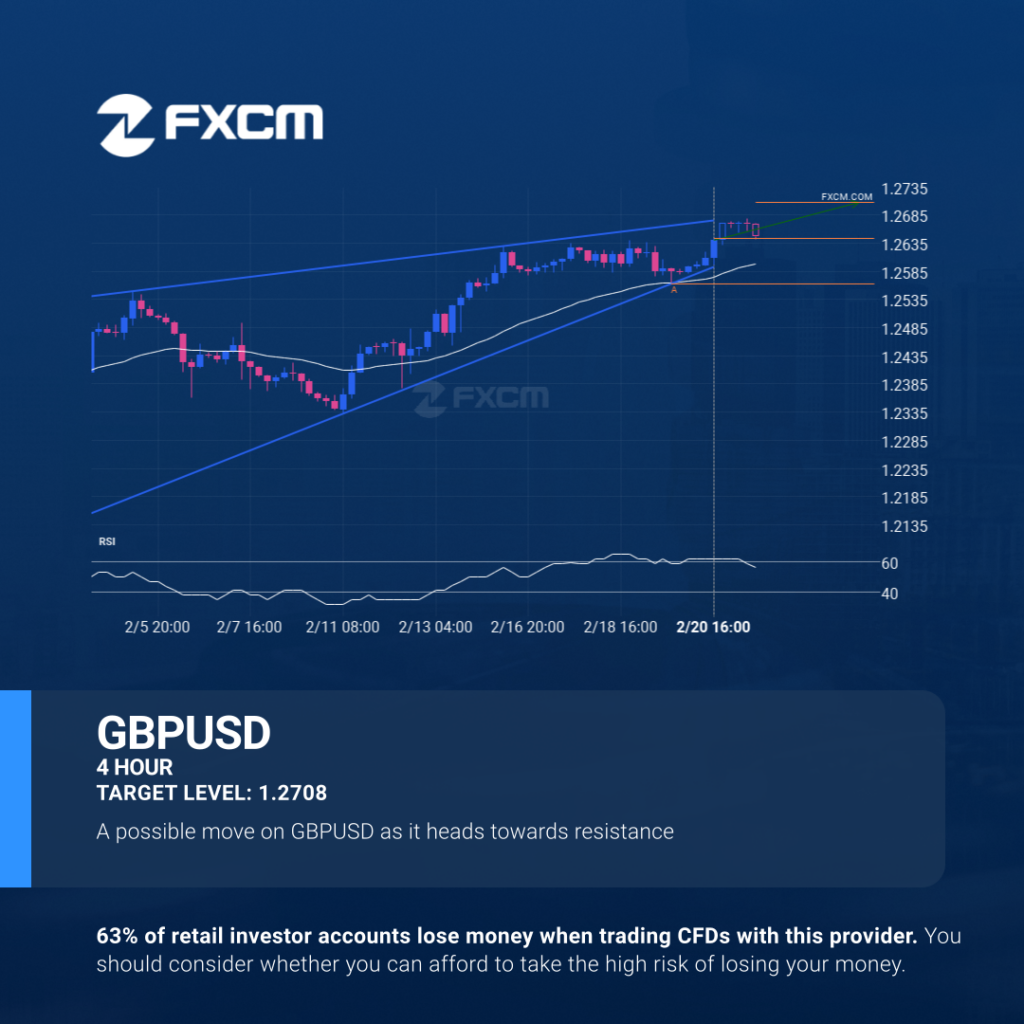
Emerging Rising Wedge detected on GBPUSD – the pattern is an emerging one and has not yet broken through support, but the price is expected to move up over the next few hours. The price at the time the pattern was found was 1.26437 and it is expected to move to 1.2708. Past performance is […]
GBPUSD – Continuation Chart Pattern – Rising Wedge
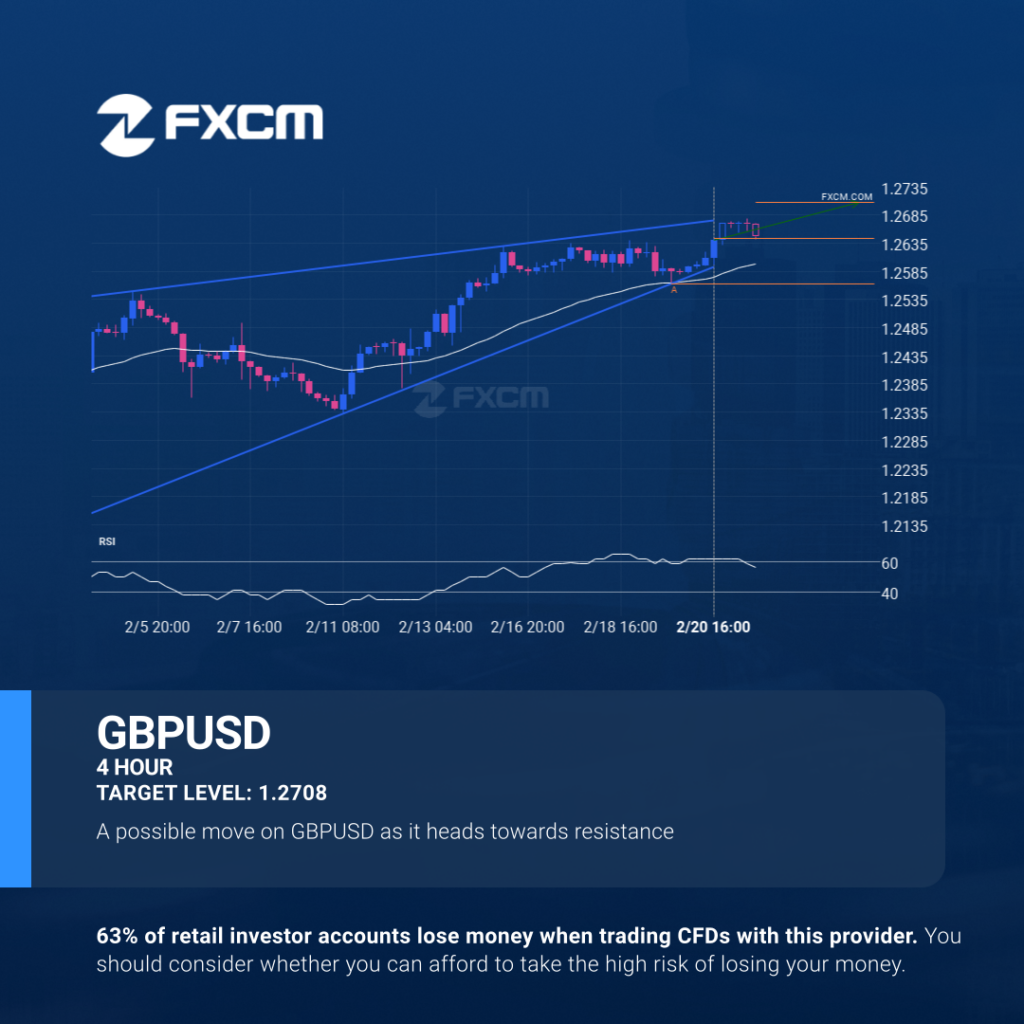
Emerging Rising Wedge detected on GBPUSD – the pattern is an emerging one and has not yet broken through support, but the price is expected to move up over the next few hours. The price at the time the pattern was found was 1.26437 and it is expected to move to 1.2708. Past performance is […]
GBPUSD – Continuation Chart Pattern – Rising Wedge
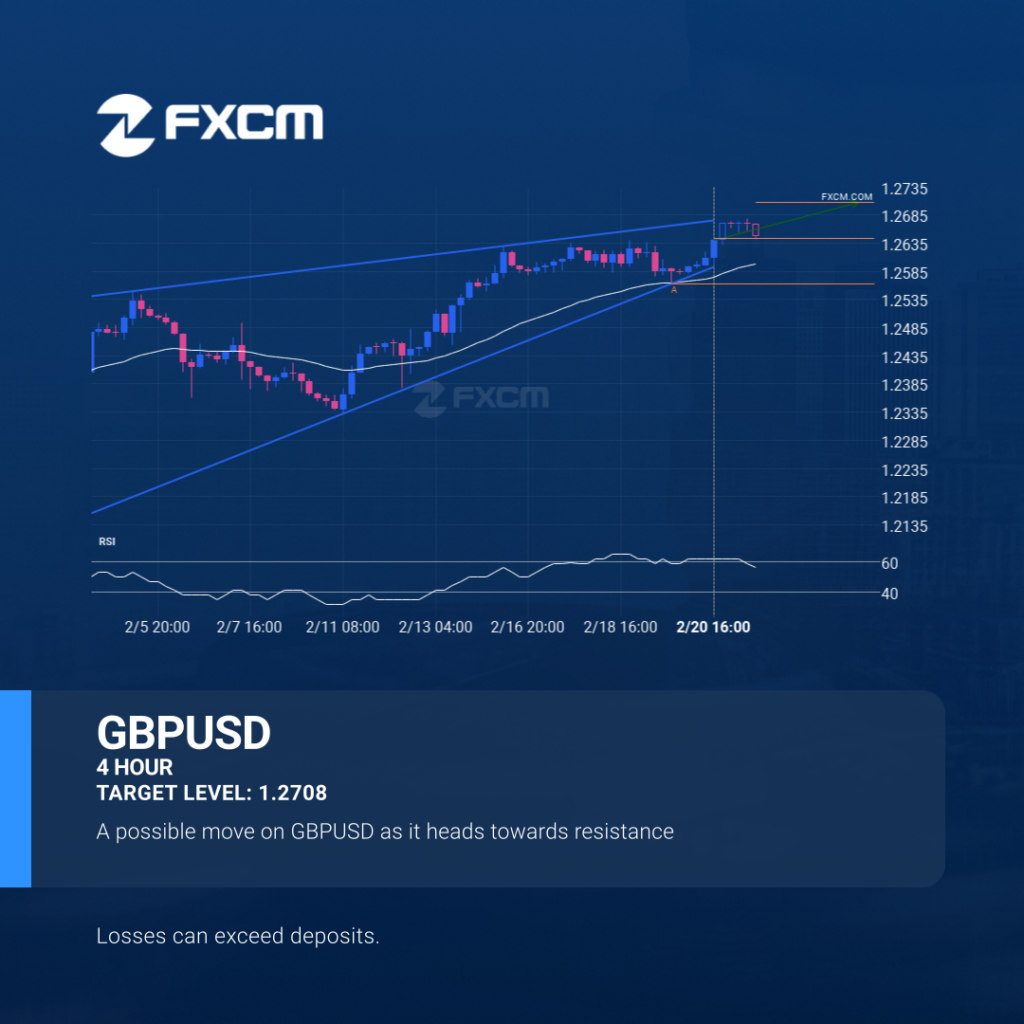
Emerging Rising Wedge detected on GBPUSD – the pattern is an emerging one and has not yet broken through support, but the price is expected to move up over the next few hours. The price at the time the pattern was found was 1.26437 and it is expected to move to 1.2708. Past performance is […]
GBPUSD – Continuation Chart Pattern – Rising Wedge

Emerging Rising Wedge detected on GBPUSD – the pattern is an emerging one and has not yet broken through support, but the price is expected to move up over the next few hours. The price at the time the pattern was found was 1.26437 and it is expected to move to 1.2708. Past performance is […]
HKG33 – Continuation Chart Pattern – Channel Up
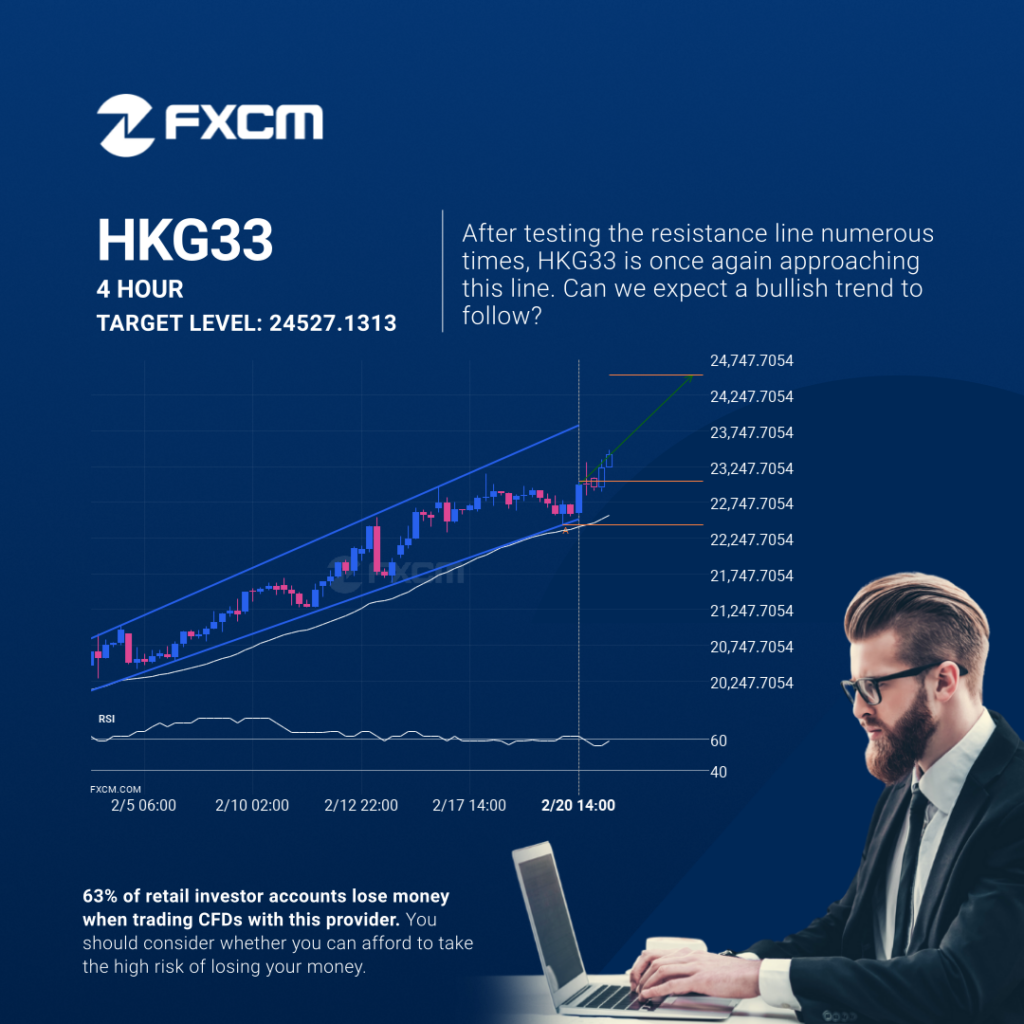
HKG33 is moving towards a resistance line. Because we have seen it retrace from this line before, we could see either a break through this line, or a rebound back to current levels. It has touched this line numerous times in the last 18 days and may test it again within the next 3 days. […]
GBPUSD – Continuation Patrón de gráfico – Cuña ascendente
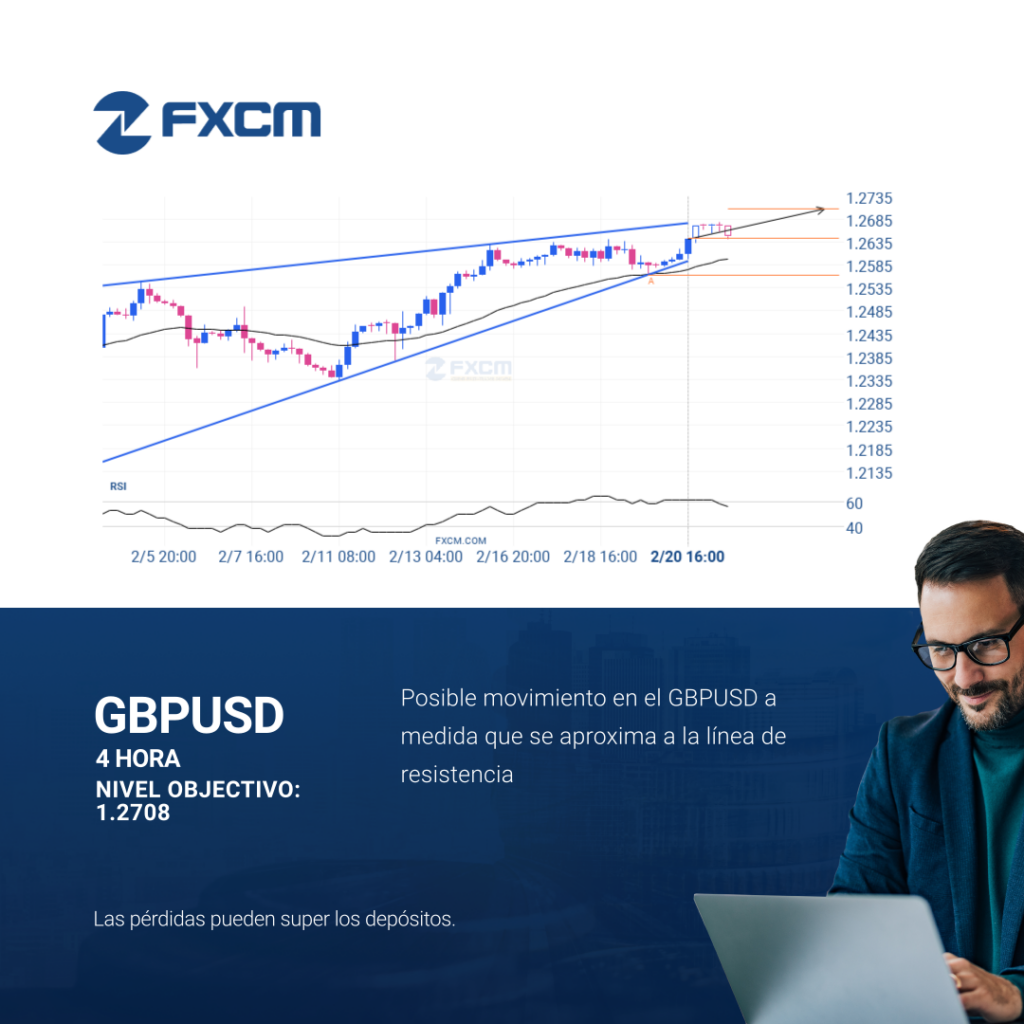
GBPUSD se identificó alrededor de 1.26437 después de haber rebotado recientemente en un nivel de soporte en el intervalo temporal de 4 Hora. En última instancia, la acción del precio del activo ha formado un patrón de Cuña ascendente. Esta presión puede aumentar las posibilidades de una fuerte rotura. El movimiento proyectado potencialmente llevará el […]
HKG33 – Continuation Chart Pattern – Channel Up
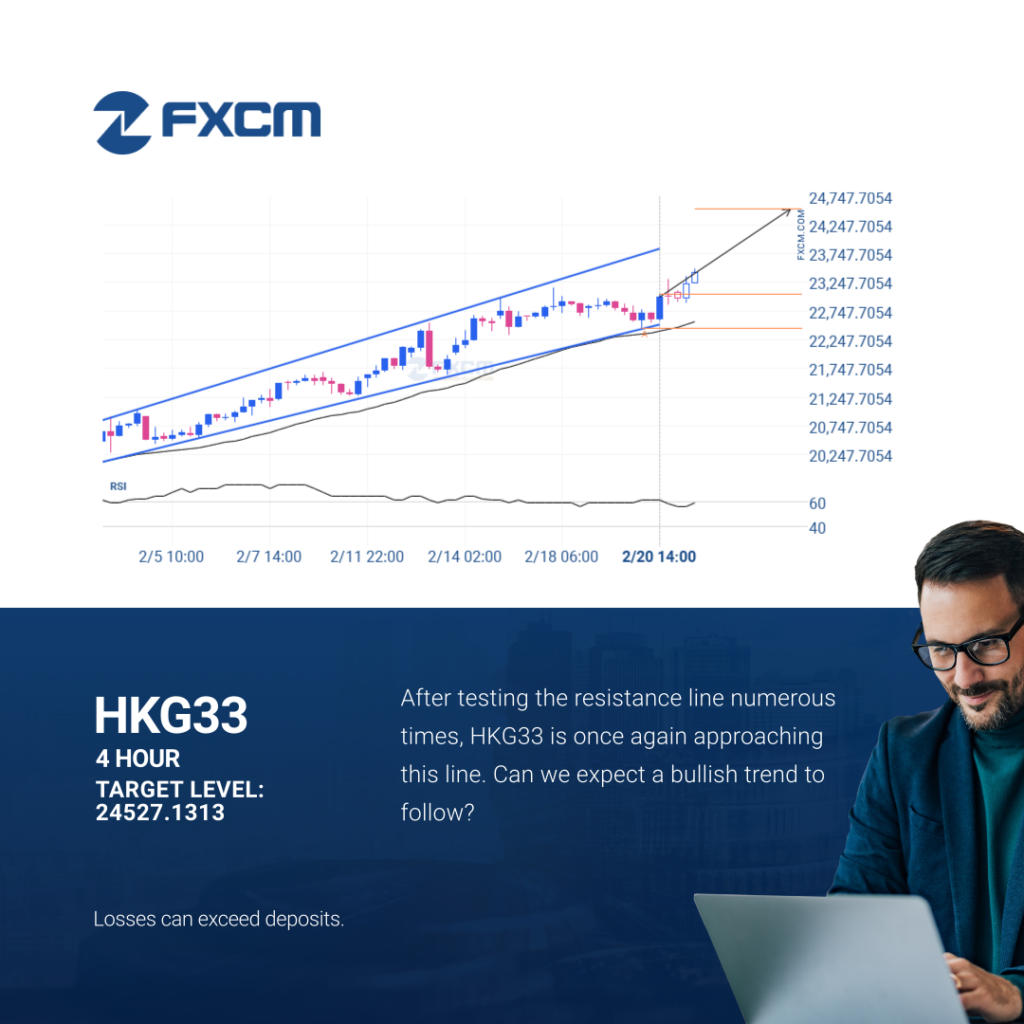
HKG33 is moving towards a resistance line. Because we have seen it retrace from this line before, we could see either a break through this line, or a rebound back to current levels. It has touched this line numerous times in the last 18 days and may test it again within the next 3 days. […]
HKG33 – Continuation Patrón de gráfico – Canal alcista
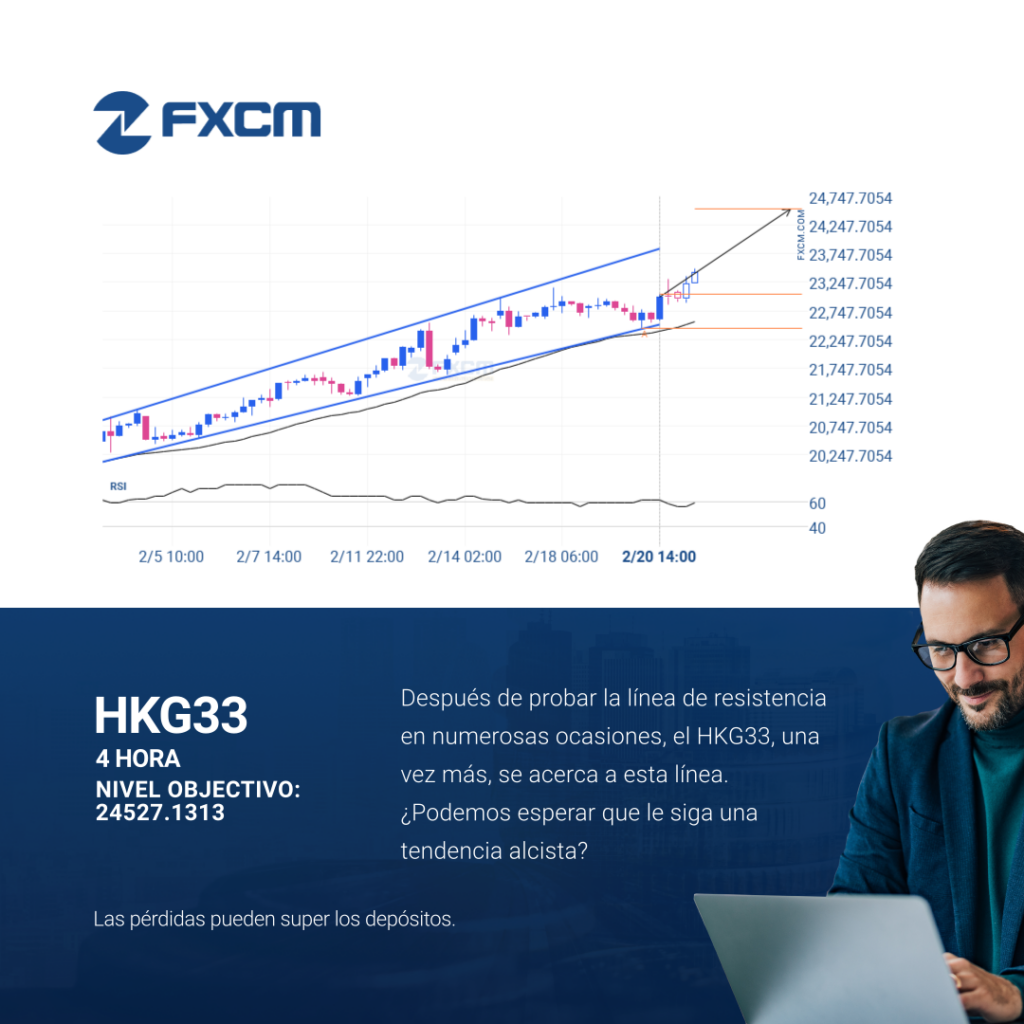
El HKG33 avanza hacia una línea de resistencia. Como le hemos visto retroceder desde esta línea anteriormente, podríamos presenciar, o bien, una ruptura a través de esta línea o una recuperación a los niveles actuales. Ha llegado a esta línea en numerosas ocasiones en los últimos 18 días y puede probarla de nuevo en las […]