AUDUSD – se acerca a la línea de precio psicológico
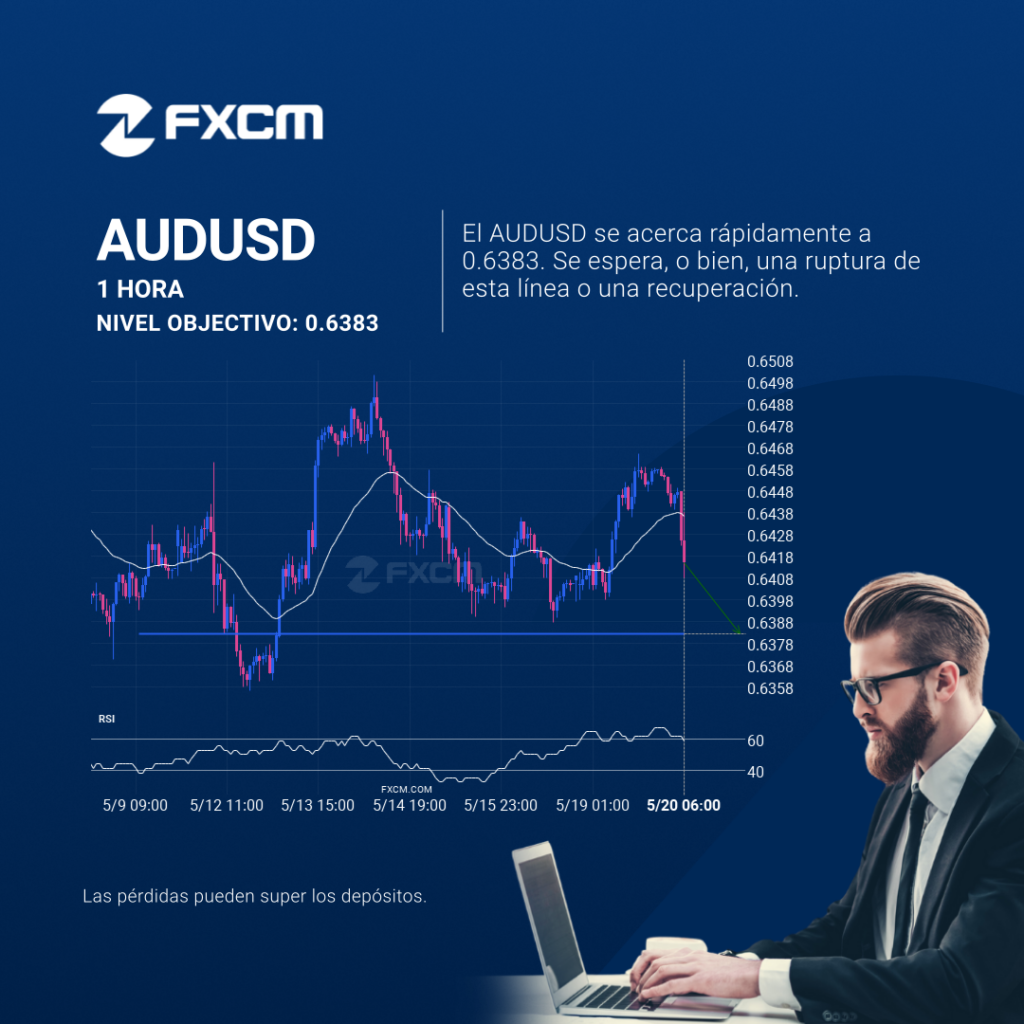
AUDUSD se está acercando a una línea de soporte en 0.6383. Si llega a la línea de soporte, puede atravesar este nivel para continuar con la tendencia bajista, o puede girarse y volver a los niveles actuales. El rendimiento pasado no es indicativo de resultados futuros. Las pérdidas pueden exceder los fondos depositados.
AUDUSD – getting close to psychological price line
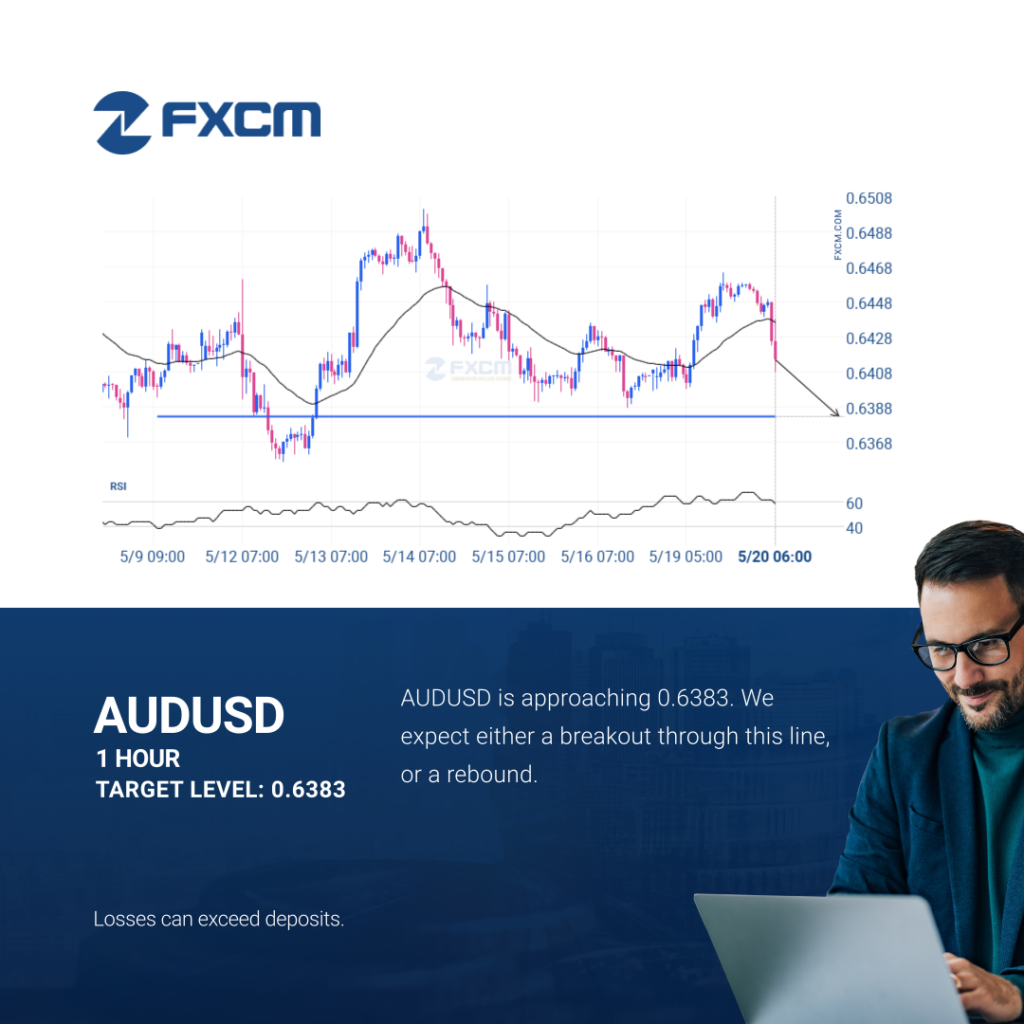
AUDUSD is approaching a support line at 0.6383. If it hits the support line, it may break through this level to continue the bearish trend, or it may turn around back to current levels. Past performance is not an indicator of future results. Losses can exceed deposits.
AUDUSD – getting close to psychological price line
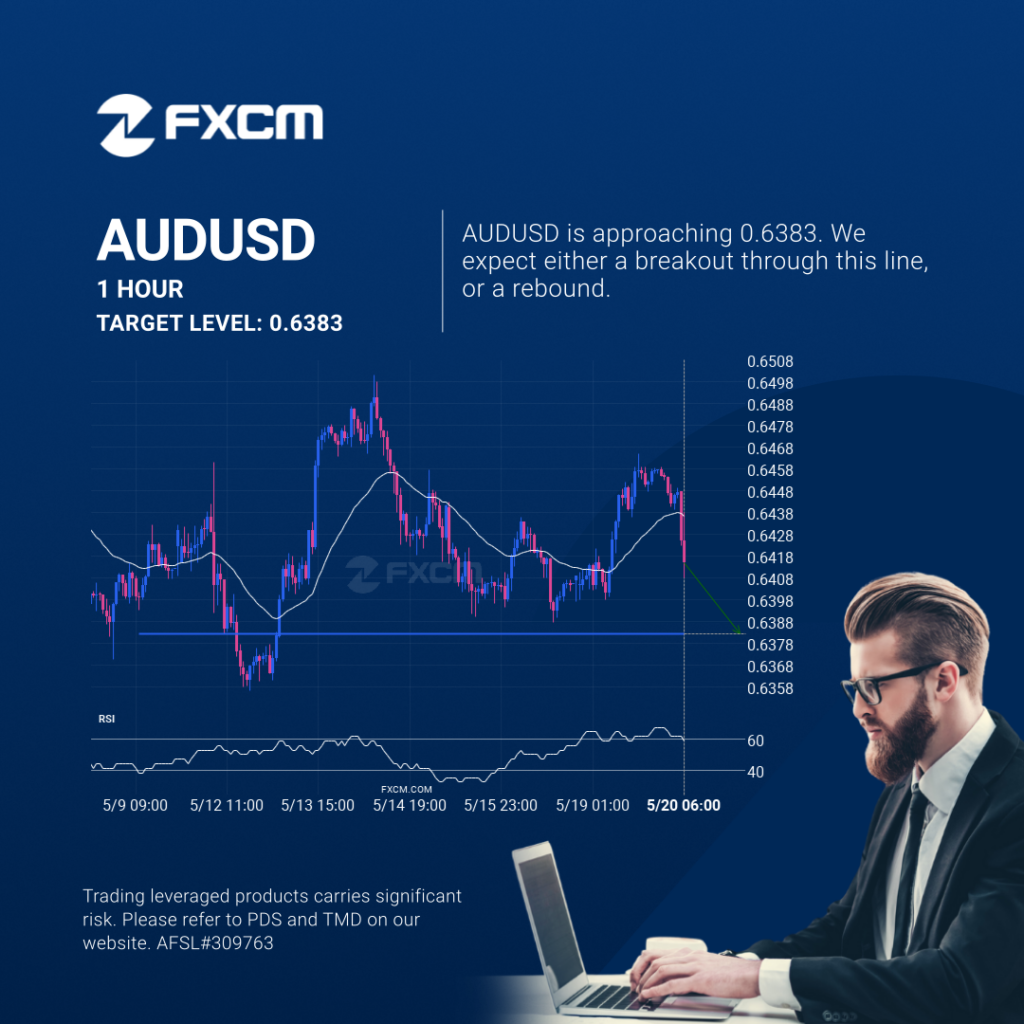
AUDUSD is approaching a support line at 0.6383. If it hits the support line, it may break through this level to continue the bearish trend, or it may turn around back to current levels. Past performance is not an indicator of future results. Trading leveraged products carries significant risk. Please refer to PDS and TMD […]
Should we expect a breakout or a rebound on HKG33?
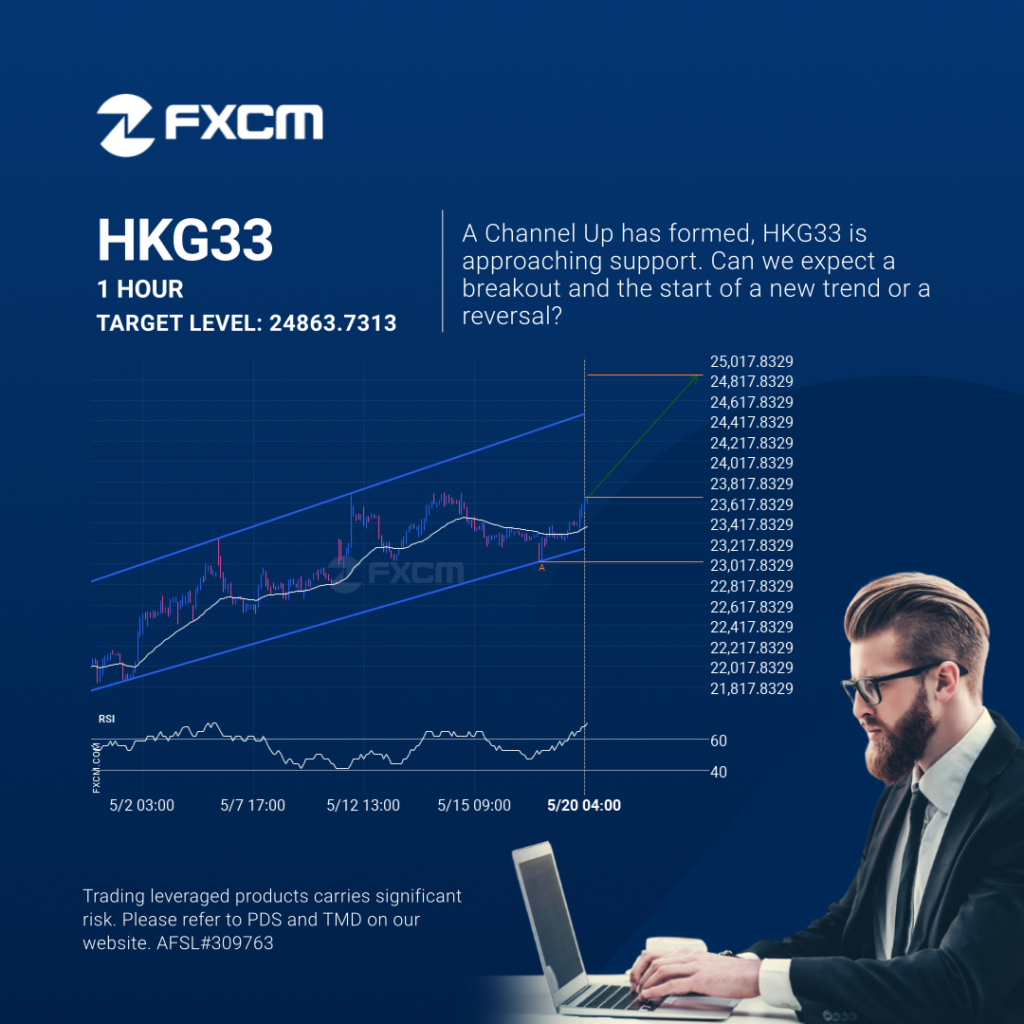
HKG33 was identified at around 23666.25 having recently rebounded of the support on the 1 hour data interval. Ultimately, the price action of the stock has formed a Channel Up pattern. This squeeze may increases the chances of a strong breakout. The projected movement will potentially take the price to around the 24863.7313 level. Past […]
Where is XAUUSD moving to?
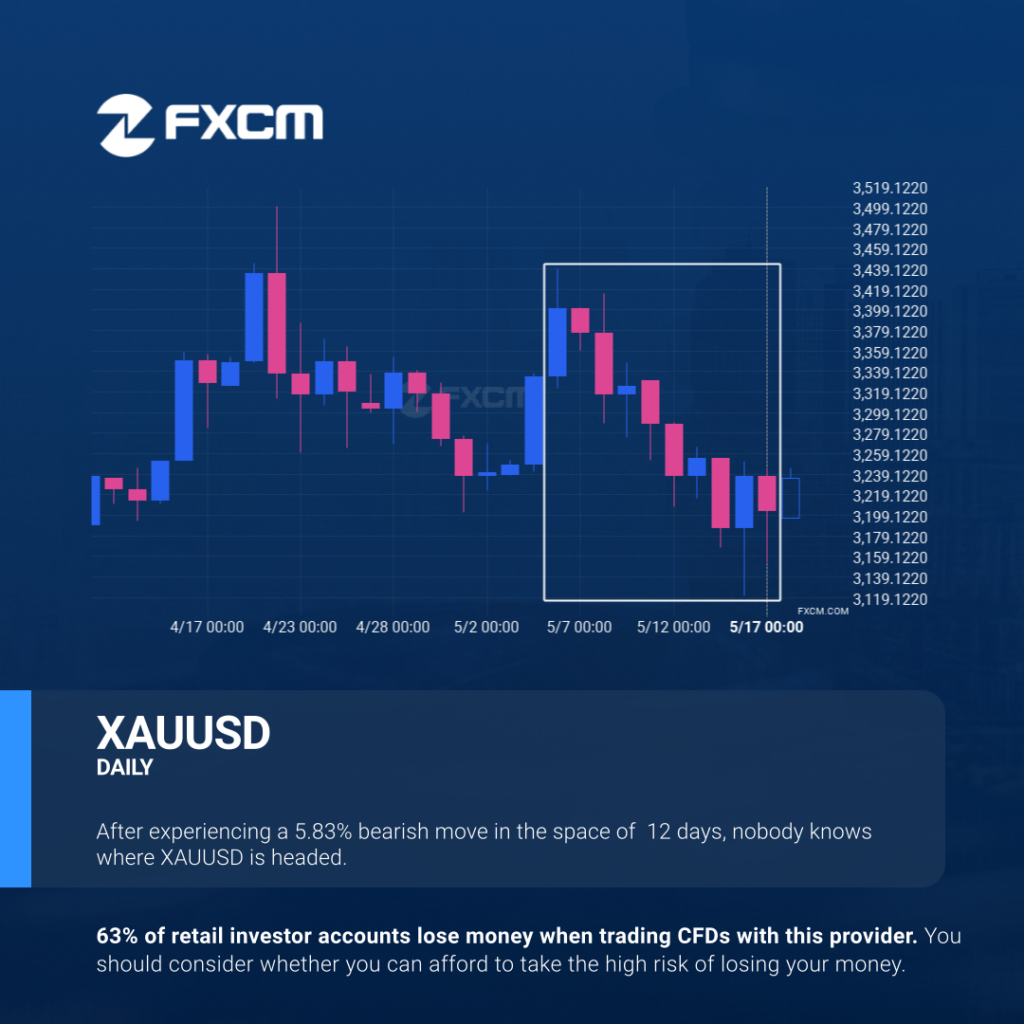
XAUUSD experienced an extremely large move that lasted 12. This movement is in the 5.0 percentile and is uncommon. It is not unusual to witness a pullback after such a big movement. Past performance is not an indicator of future results. Trading leveraged products carries significant risk. Please refer to PDS and TMD on our […]
Where is XAUUSD moving to?
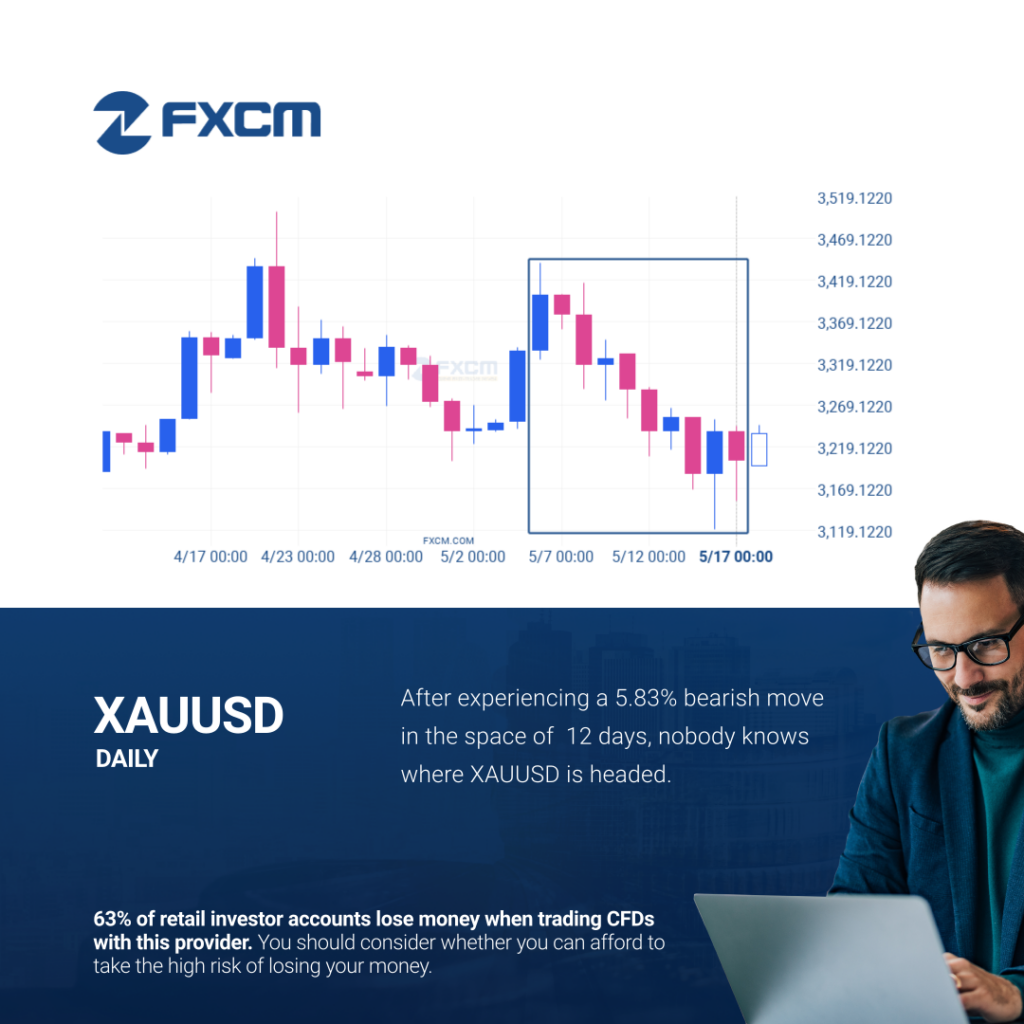
XAUUSD experienced an extremely large move that lasted 12. This movement is in the 5.0 percentile and is uncommon. It is not unusual to witness a pullback after such a big movement. Past performance is not an indicator of future results. Trading leveraged products carries significant risk. Please refer to PDS and TMD on our […]
A potential bullish movement on ESP35
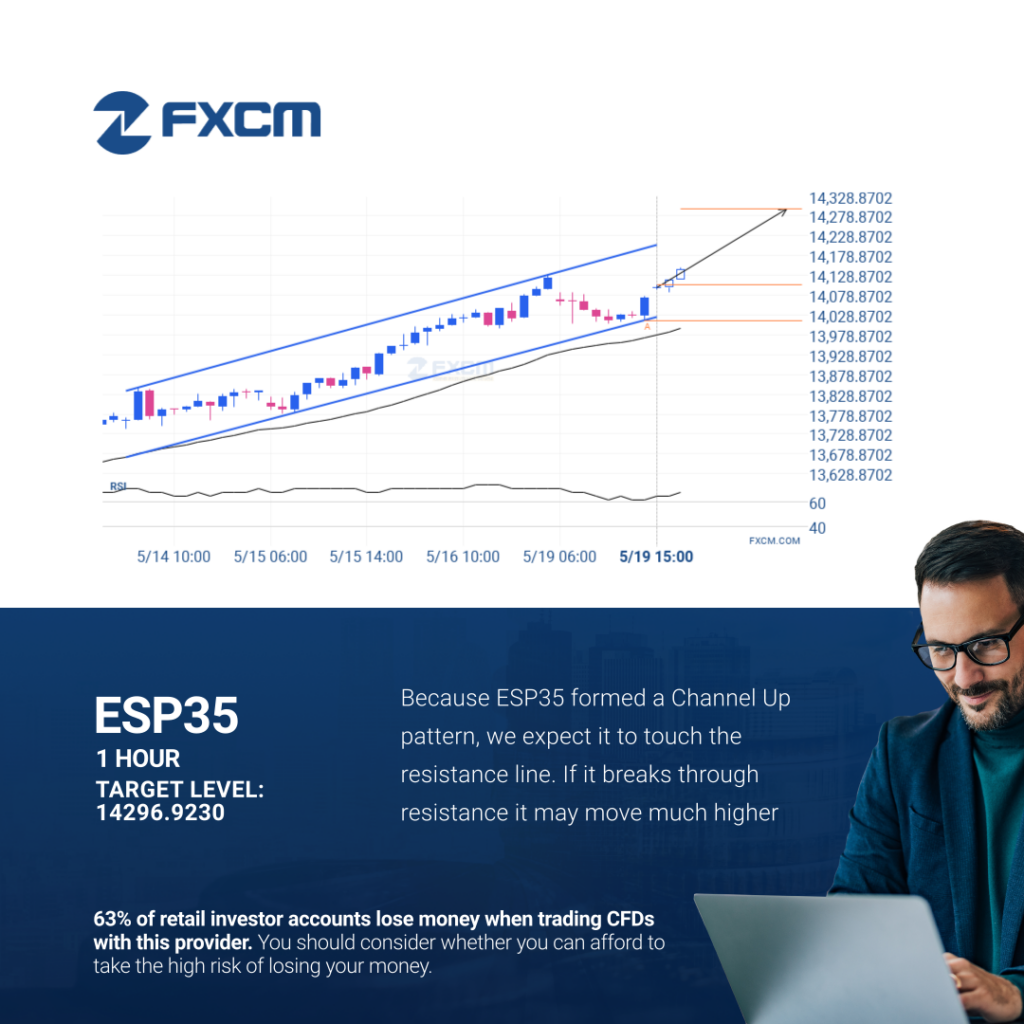
An emerging Channel Up has been detected on ESP35 on the 1 hour chart. There is a possible move towards 14296.9230 next few candles. Once reaching support it may continue its bullish run or reverse back to current price levels. Past performance is not an indicator of future results. Trading leveraged products carries significant risk. […]
Posible ruptura del nivel de resistencia en el BTCUSD

Se detectó un patrón de Canal alcista emergente en BTCUSD en el gráfico de 4 Hora. Hay un posible movimiento hacia 108070.0738 en las próximas velas. Una vez que alcance el nivel de soporte, puede continuar su movimiento alcista o retroceder a los niveles de precios actuales. El rendimiento pasado no es indicativo de resultados […]
¿Hacia dónde se dirige el XAUUSD?
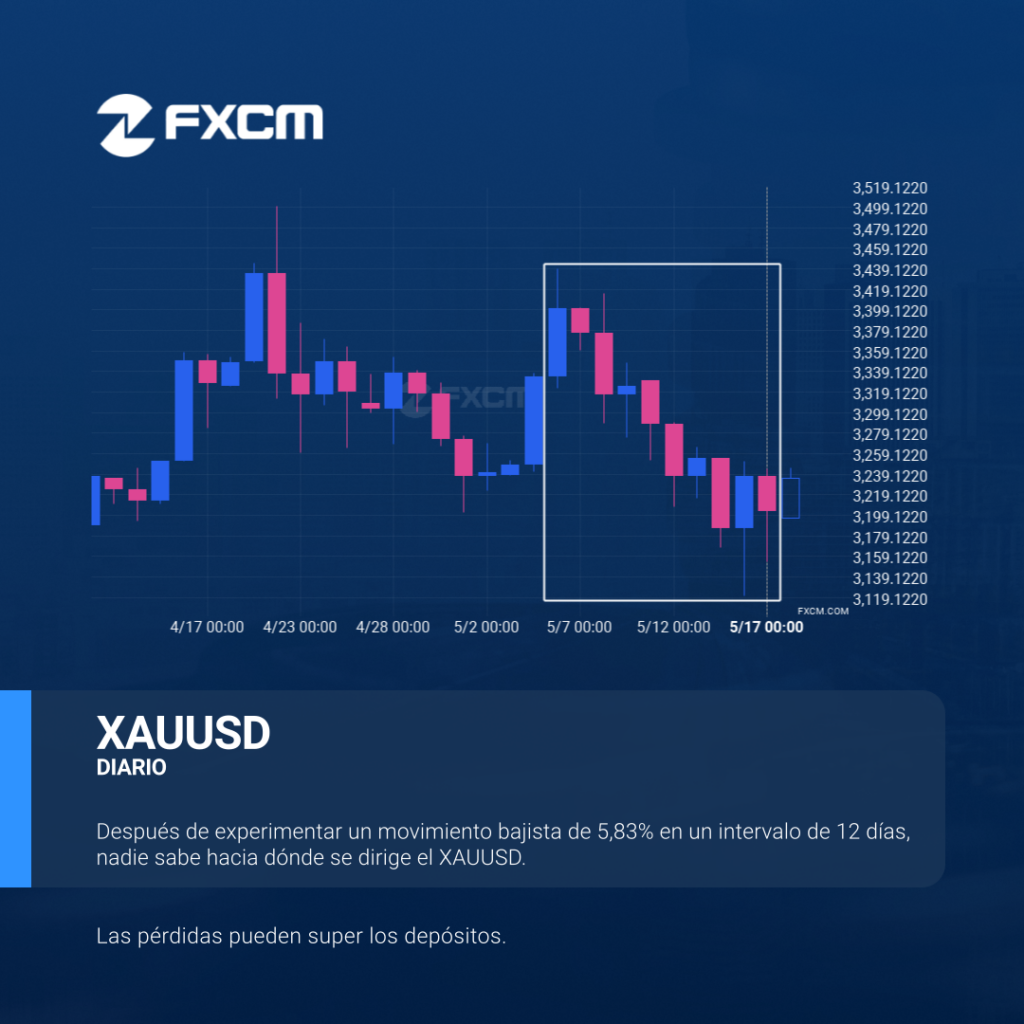
XAUUSD experimentó un movimiento extremadamente grande que duró 12. Este movimiento está en el percentil 5.0 y es poco común. No es inusual presenciar un retroceso después de un movimiento tan grande. El rendimiento pasado no es indicativo de resultados futuros. Las pérdidas pueden exceder los fondos depositados.