AUDUSD breakout through resistance
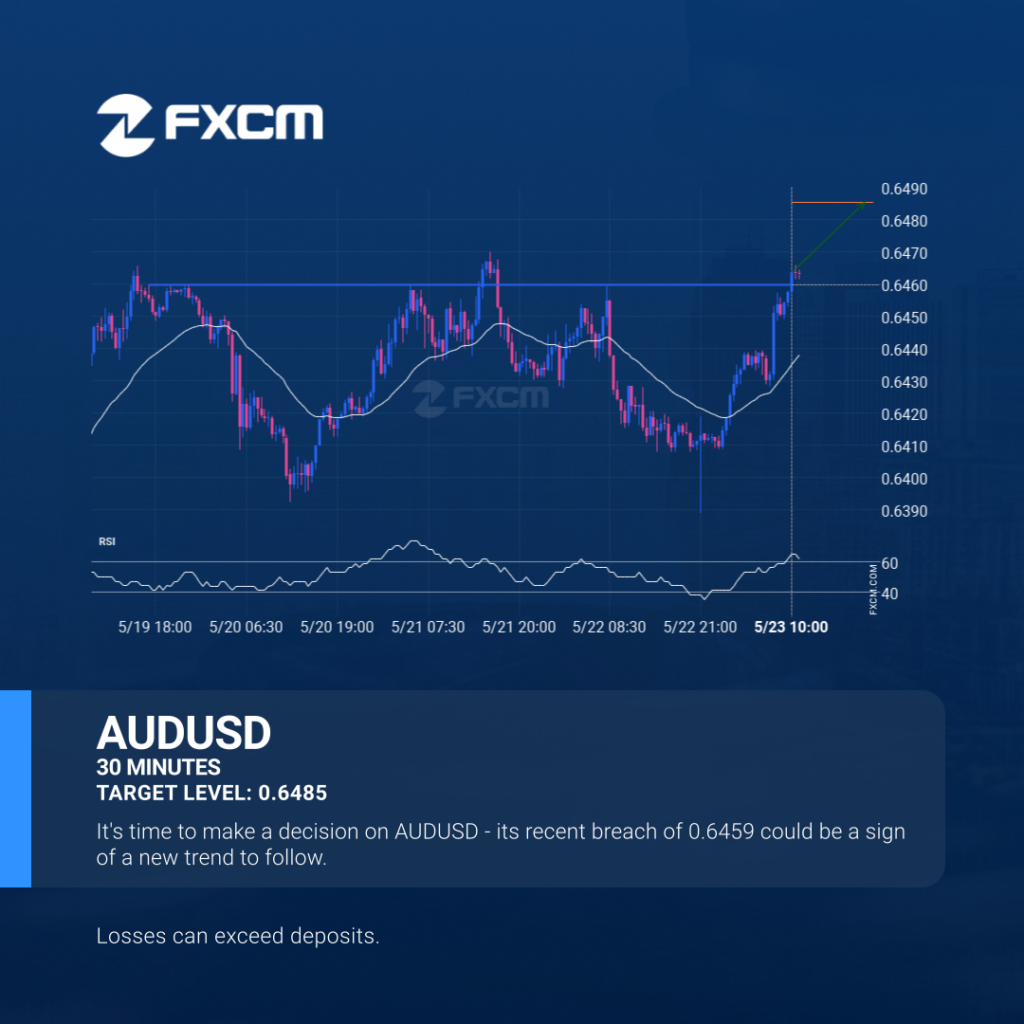
A strong resistance level has been breached at 0.6459 on the 30 Minutes AUDUSD chart. Technical Analysis theory forecasts a movement to 0.6485 in the next 21 hours. Past performance is not an indicator of future results. Losses can exceed deposits.
Rotura de AUDUSD a través de nivel de resistencia
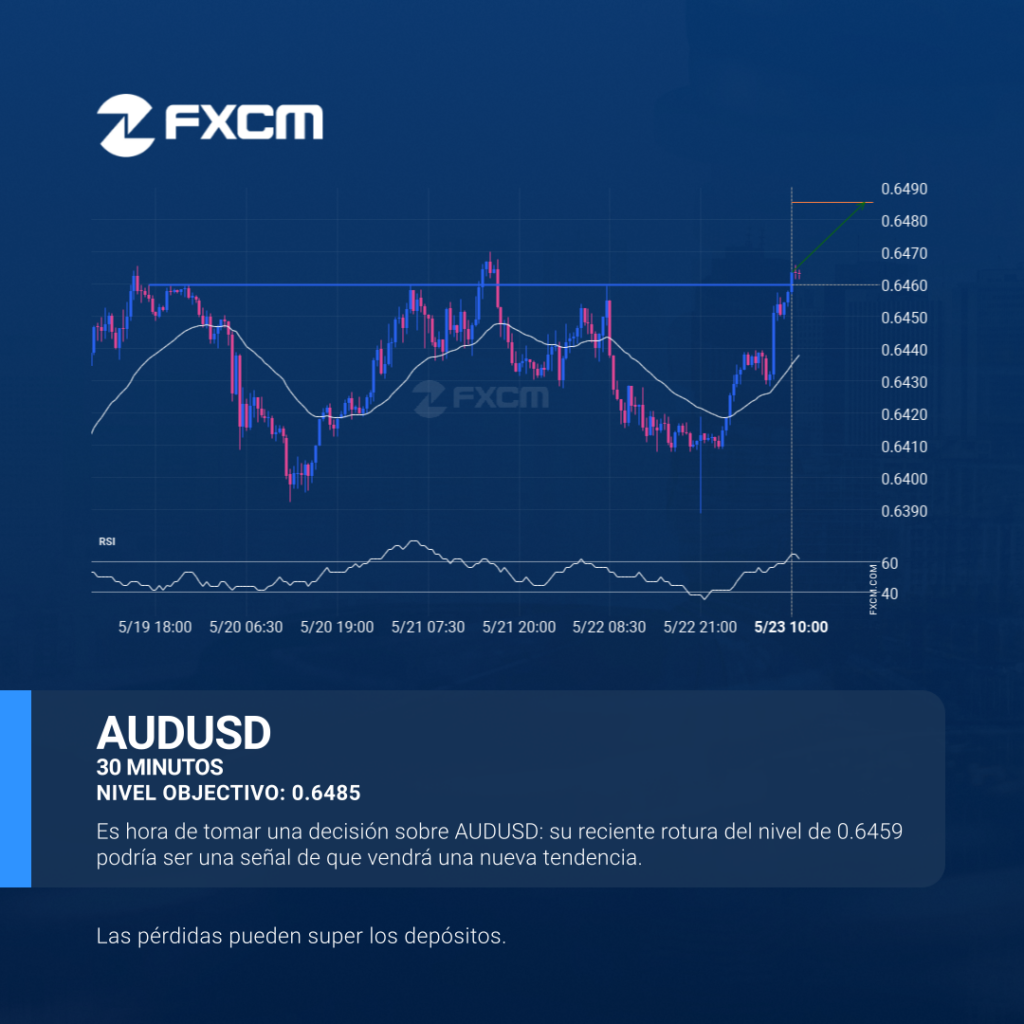
Se ha atravesado un fuerte nivel de resistencia en 0.6459 en el gráfico de 30 Minutos de AUDUSD. La teoría del análisis técnico pronostica un movimiento a 0.6485 en el próximo período de 21 Horas. El rendimiento pasado no es indicativo de resultados futuros. Las pérdidas pueden exceder los fondos depositados.
AUDUSD breakout through resistance
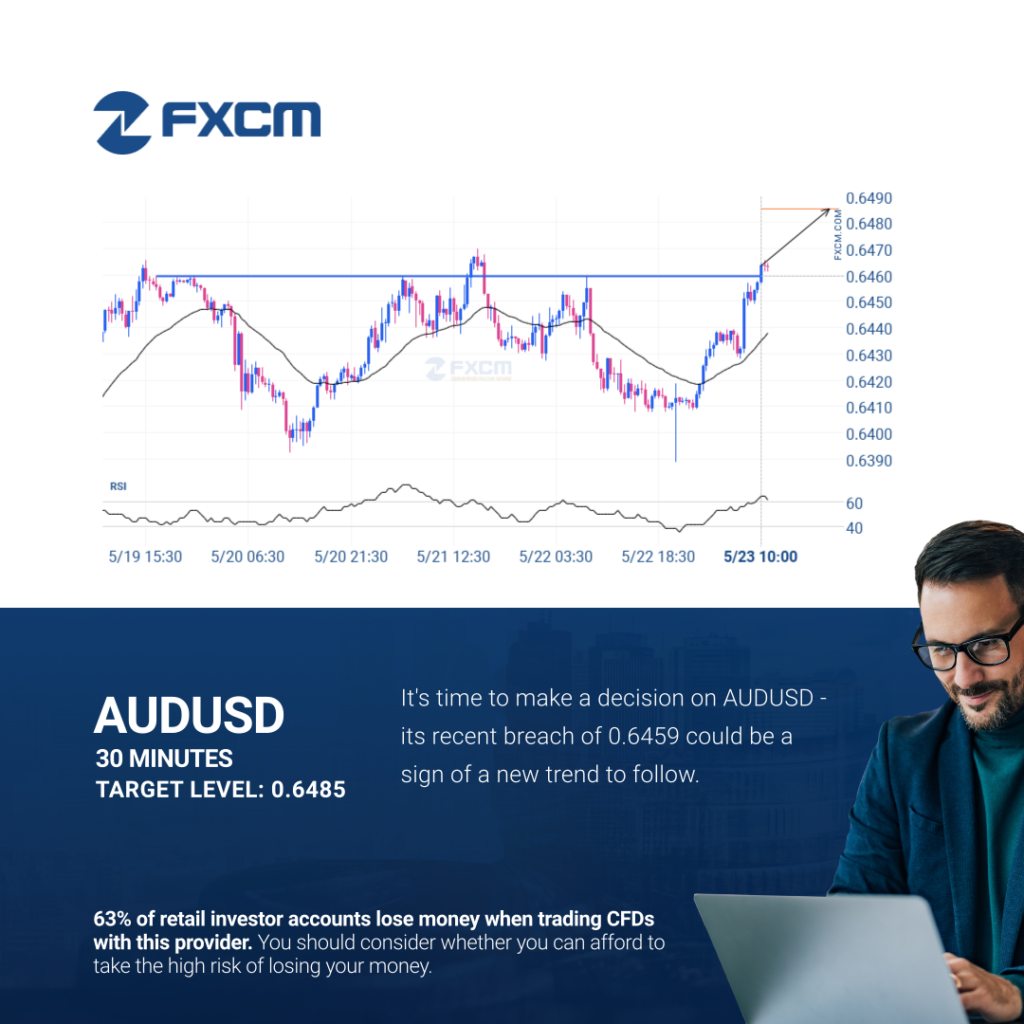
A strong resistance level has been breached at 0.6459 on the 30 Minutes AUDUSD chart. Technical Analysis theory forecasts a movement to 0.6485 in the next 21 hours. Past performance is not an indicator of future results. Trading leveraged products carries significant risk. Please refer to PDS and TMD on our website. AFSL#309763
EURUSD is on the approach
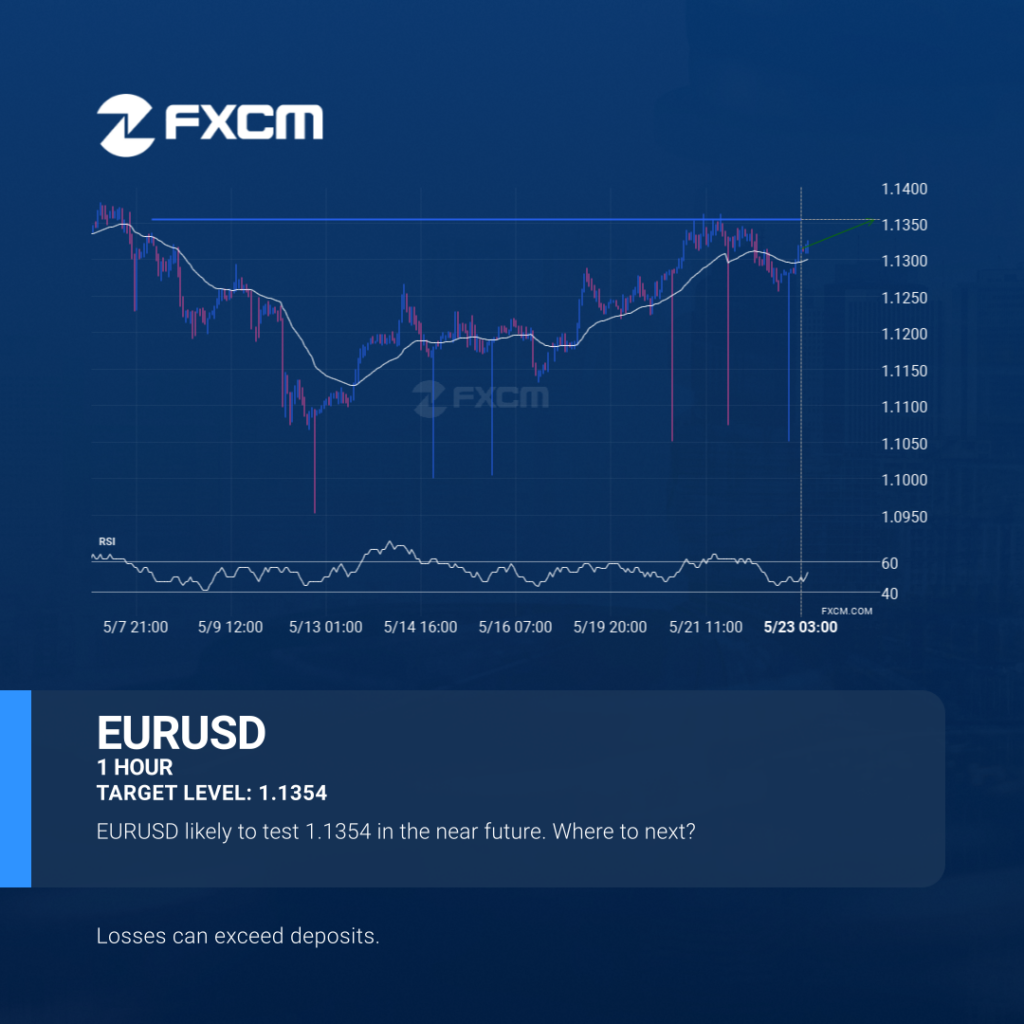
EURUSD is heading towards a line of 1.1354. If this movement continues, the price of EURUSD could test 1.1354 within the next 3 days. But don’t be so quick to trade, it has tested this line numerous times in the past, so this movement could be short-lived and end up rebounding. Past performance is not […]
EURUSD se acerca
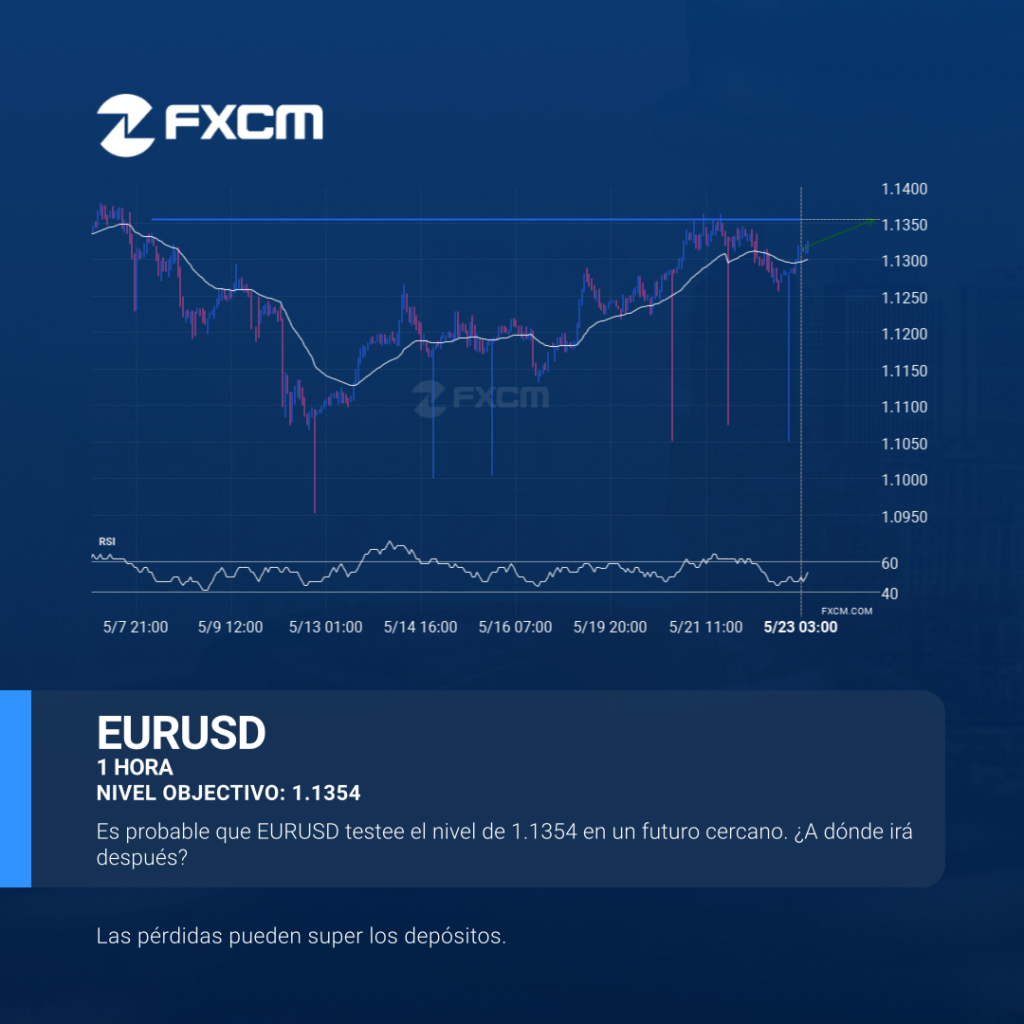
El EURUSD avanza hacia la línea de 1.1354. Si este movimiento se mantiene, el precio del EURUSD podría probar el nivel de 1.1354 en un plazo de 3 días. Pero no se apresure a la hora de operar, porque el par ha probado esta línea en numerosas ocasiones durante el pasado, por lo que este […]
HKG33 trade outlook at 2025-05-22T11:00:00.000Z until 2025-05-22T11:00:00.000Z
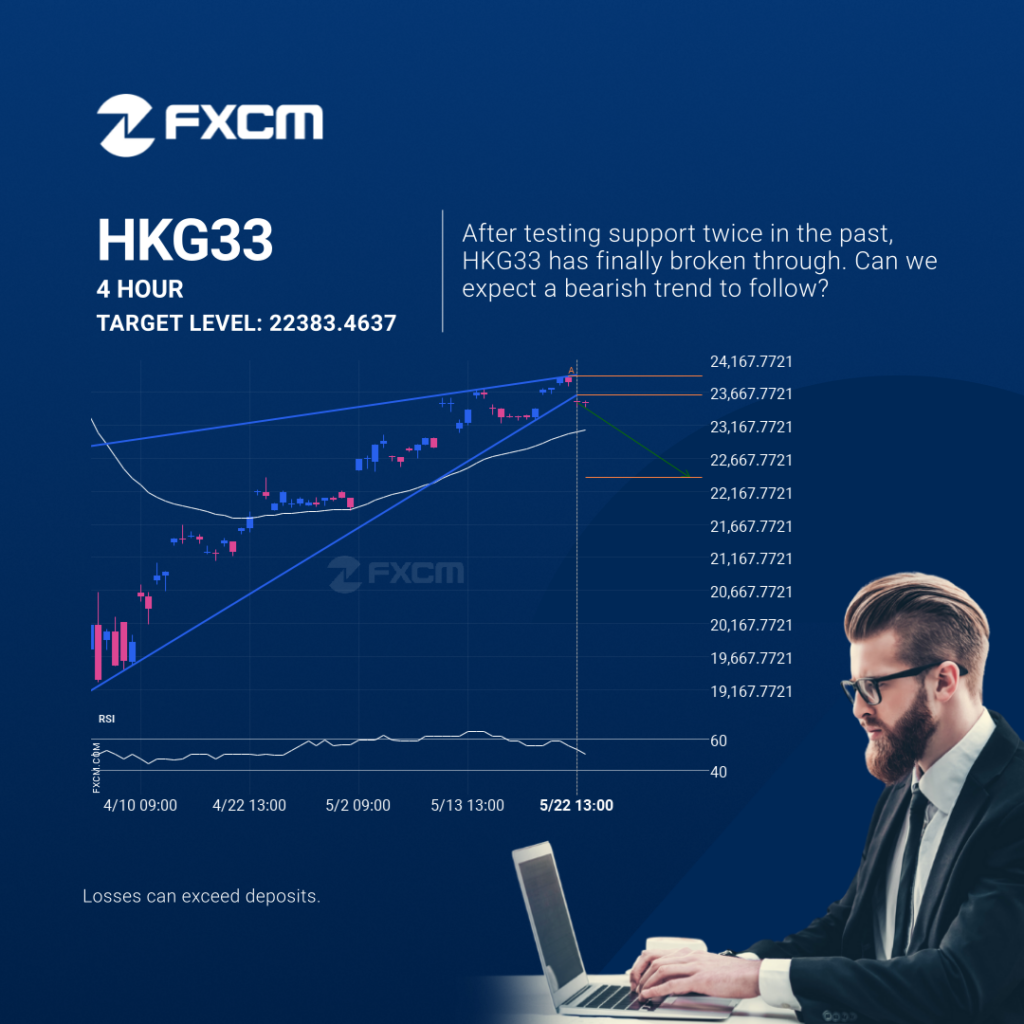
HKG33 has broken through the support line of a Rising Wedge technical chart pattern. Because we have seen it retrace from this line in the past, one should wait for confirmation of the breakout before taking any action. It has touched this line twice in the last 65 days and suggests a possible target level […]
Previsión de trading de HKG33 a las 2025-05-22T11:00:00.000Z hasta las 2025-05-22T11:00:00.000Z
El HKG33 ha atravesado la línea de soporte de un patrón de gráfico técnico con un Cuña ascendente. Como le hemos visto retroceder desde esta posición en el pasado, deberíamos esperar la confirmación de la ruptura antes de actuar. Ha llegado a esta línea dos veces en los últimos 65 días y sugiere un posible […]
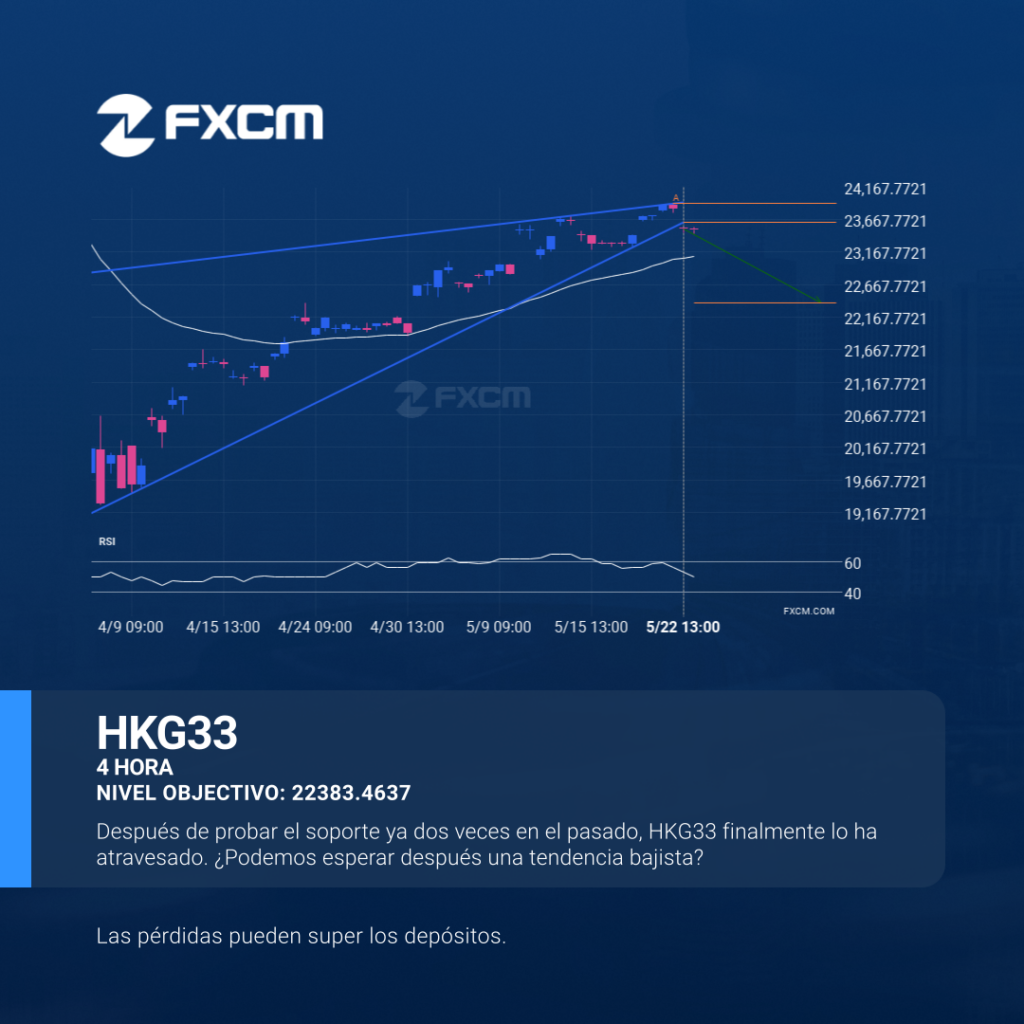
HKG33 trade outlook at 2025-05-22T11:00:00.000Z until 2025-05-22T11:00:00.000Z

HKG33 has broken through the support line of a Rising Wedge technical chart pattern. Because we have seen it retrace from this line in the past, one should wait for confirmation of the breakout before taking any action. It has touched this line twice in the last 65 days and suggests a possible target level […]
XAGUSD approaching support of a Channel Up
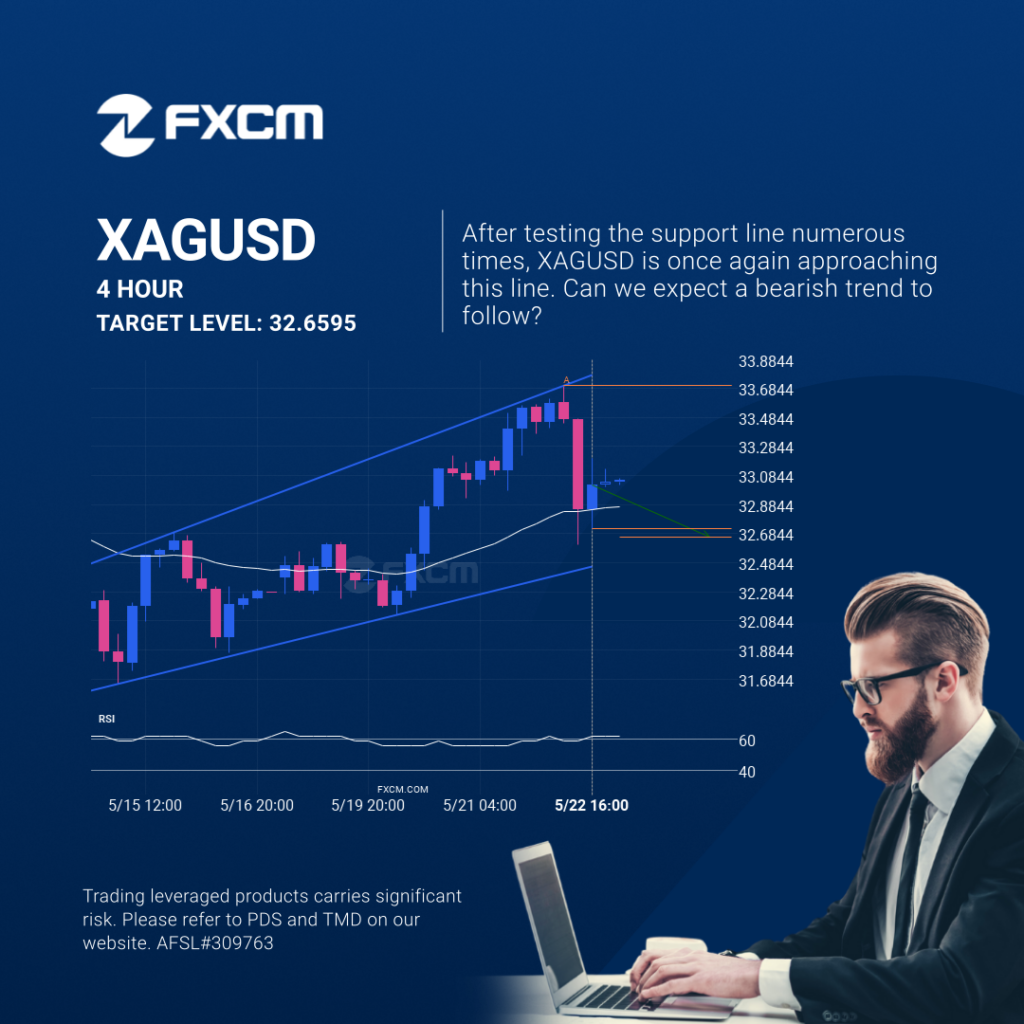
XAGUSD is approaching the support line of a Channel Up. It has touched this line numerous times in the last 10 days. If it tests this line again, it should do so in the next 2 days. Past performance is not an indicator of future results. Trading leveraged products carries significant risk. Please refer to […]
El XAGUSD se aproxima a el soporte de un Canal alcista

El XAGUSD se está acercando a la línea de soporte de un Canal alcista. Ha llegado a esta línea en numerosas ocasiones durante los últimos 10 días. Si vuelve a probarla de nuevo, debería hacerlo en las próximas 2 días. El rendimiento pasado no es indicativo de resultados futuros. Las pérdidas pueden exceder los fondos […]