Un posible impulso final en el BTCUSD
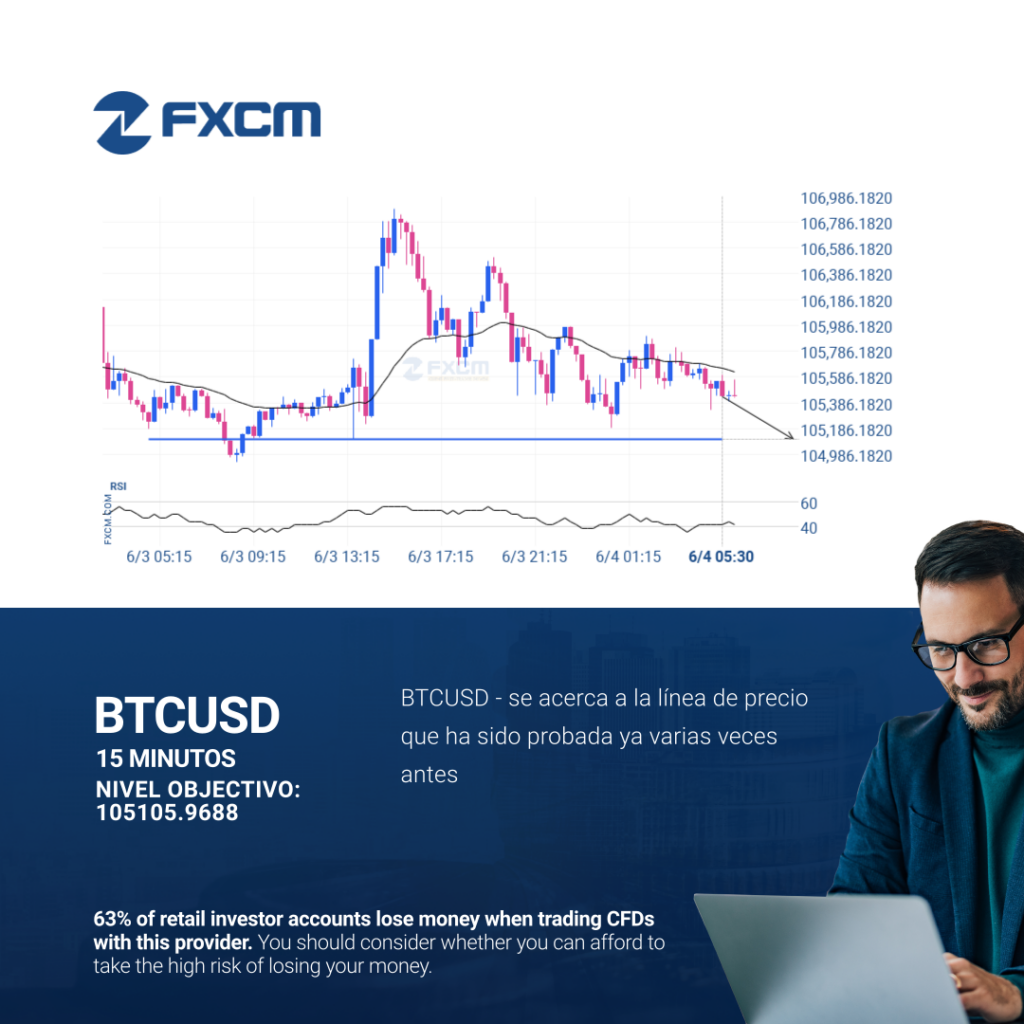
El BTCUSD avanza hacia 105105.9688 y podría alcanzar este punto en un plazo de 5 horas. Ha probado esta línea previamente en numerosas ocasiones y esta vez no tiene porqué ser diferente, terminando con una recuperación en lugar de en una rotura. Si la rotura no ocurre, podríamos observar un retroceso de nuevo a los […]
A final push possible on AUDUSD
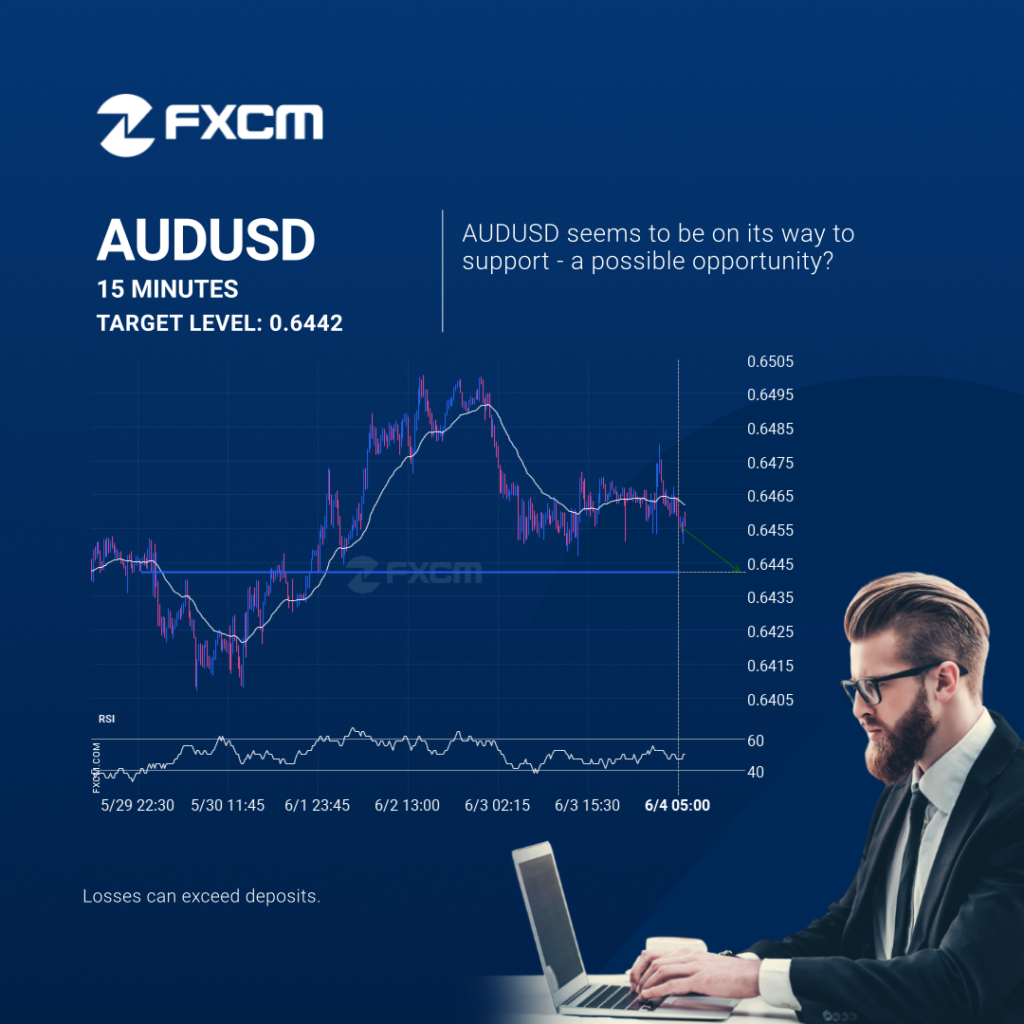
AUDUSD is heading towards 0.6442 and could reach this point within the next 19 hours. It has tested this line numerous times in the past, and this time could be no different, ending in a rebound instead of a breakout. If the breakout doesn’t happen, we could see a retracement back down to current levels. […]
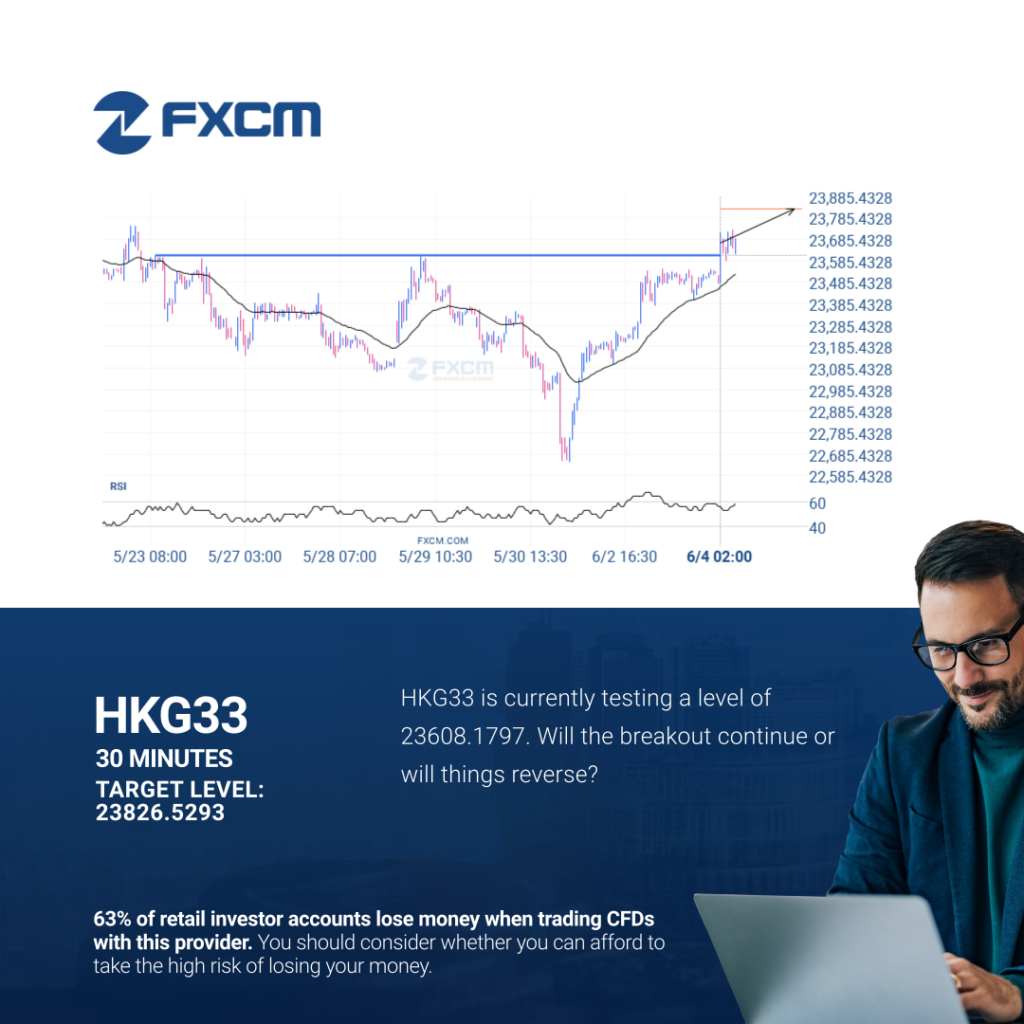
Possible start of a bullish trend as HKG33 breaks resistance
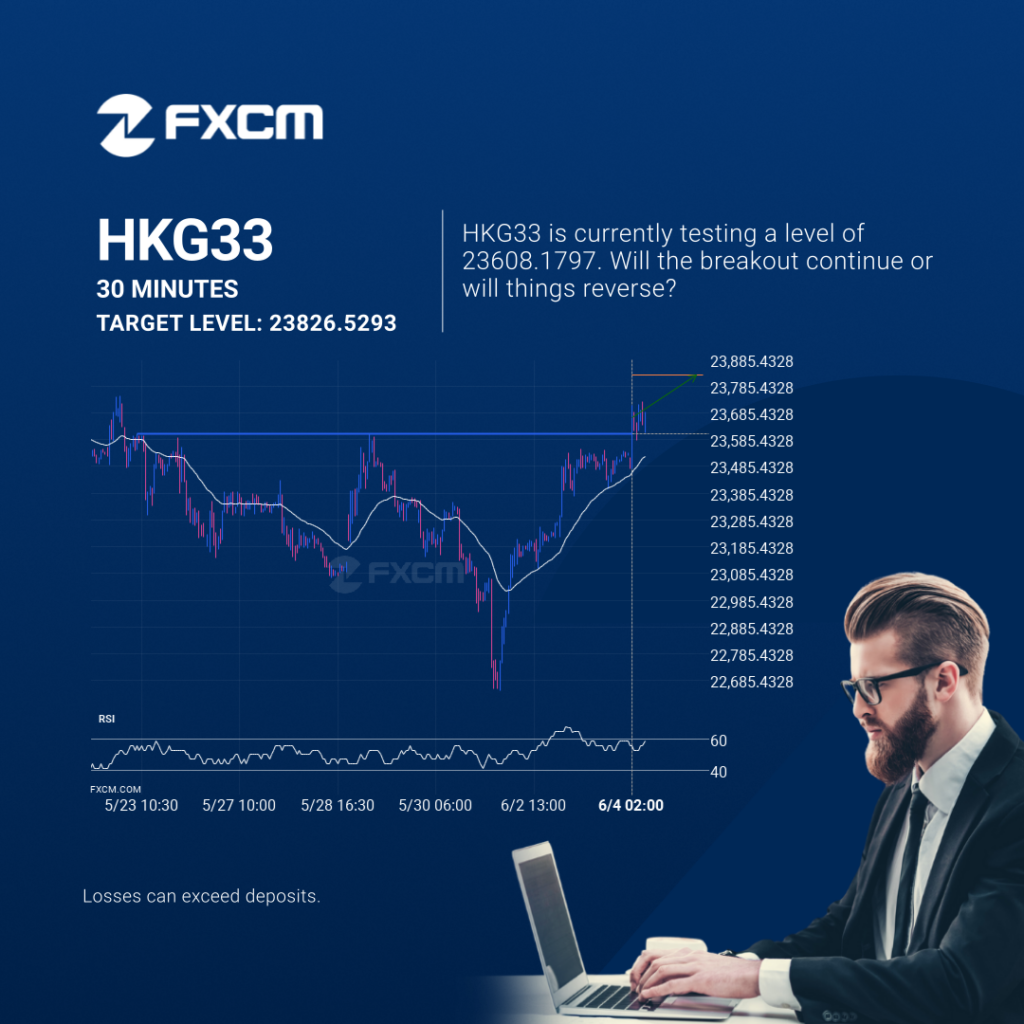
HKG33 has broken through a resistance line. It has touched this line numerous times in the last 12 days. This breakout shows a potential move to 23826.5293 within the next 2 days. Because we have seen it retrace from this level in the past, one should wait for confirmation of the breakout. Past performance is […]
Posible comienzo de una tendencia alcista cuando HKG33 rompa el nivel de resistencia
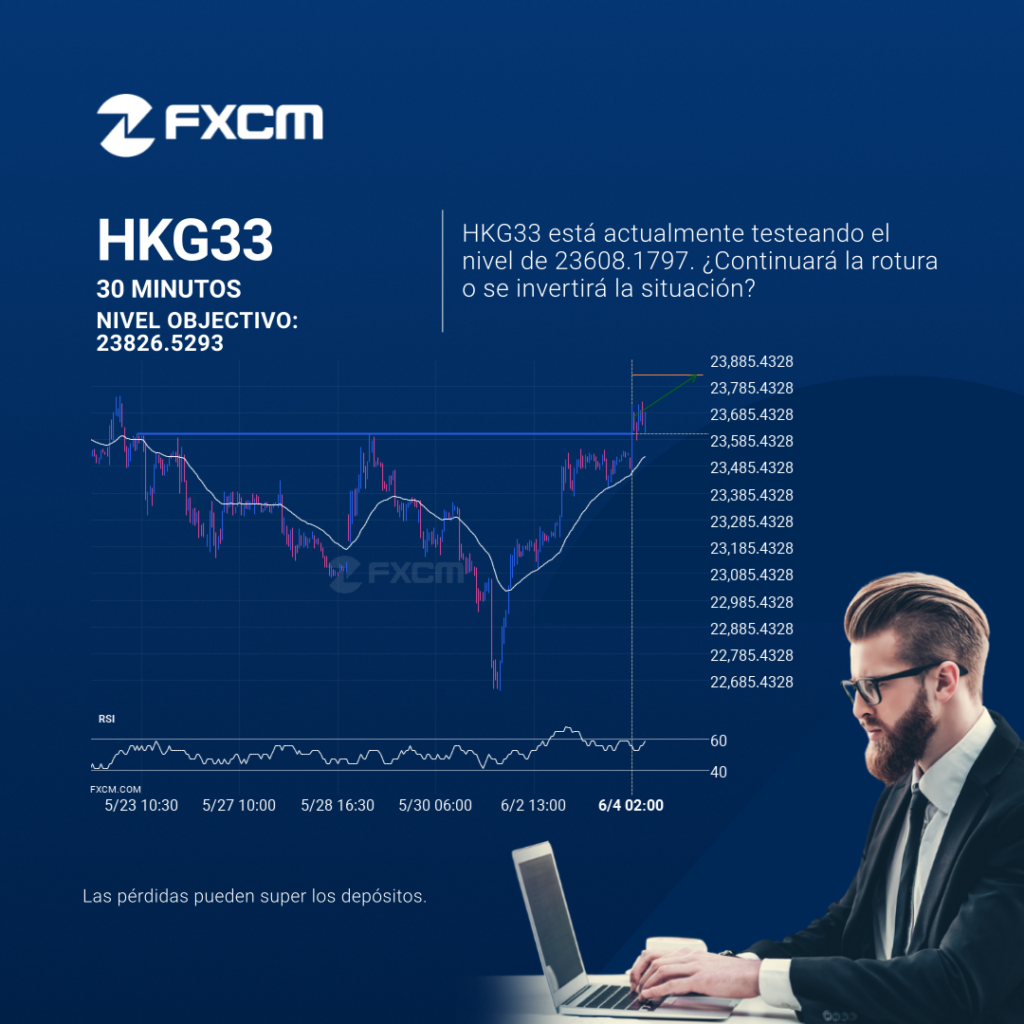
El HKG33 atravesó una línea de resistencia. Ha entrado en contacto con esta línea en numerosas ocasiones en los últimos 12 días. Esta irrupción muestra un movimiento potencial hacia el nivel de 23826.5293 dentro de las próximas 2 días. Ya hemos observado un retroceso desde esta posición en el pasado, por tanto, debemos esperar la […]
Possible start of a bullish trend as HKG33 breaks resistance
HKG33 has broken through a resistance line. It has touched this line numerous times in the last 12 days. This breakout shows a potential move to 23826.5293 within the next 2 days. Because we have seen it retrace from this level in the past, one should wait for confirmation of the breakout. Past performance is […]
EURJPY – Continuation Patrón de gráfico – Cuña ascendente
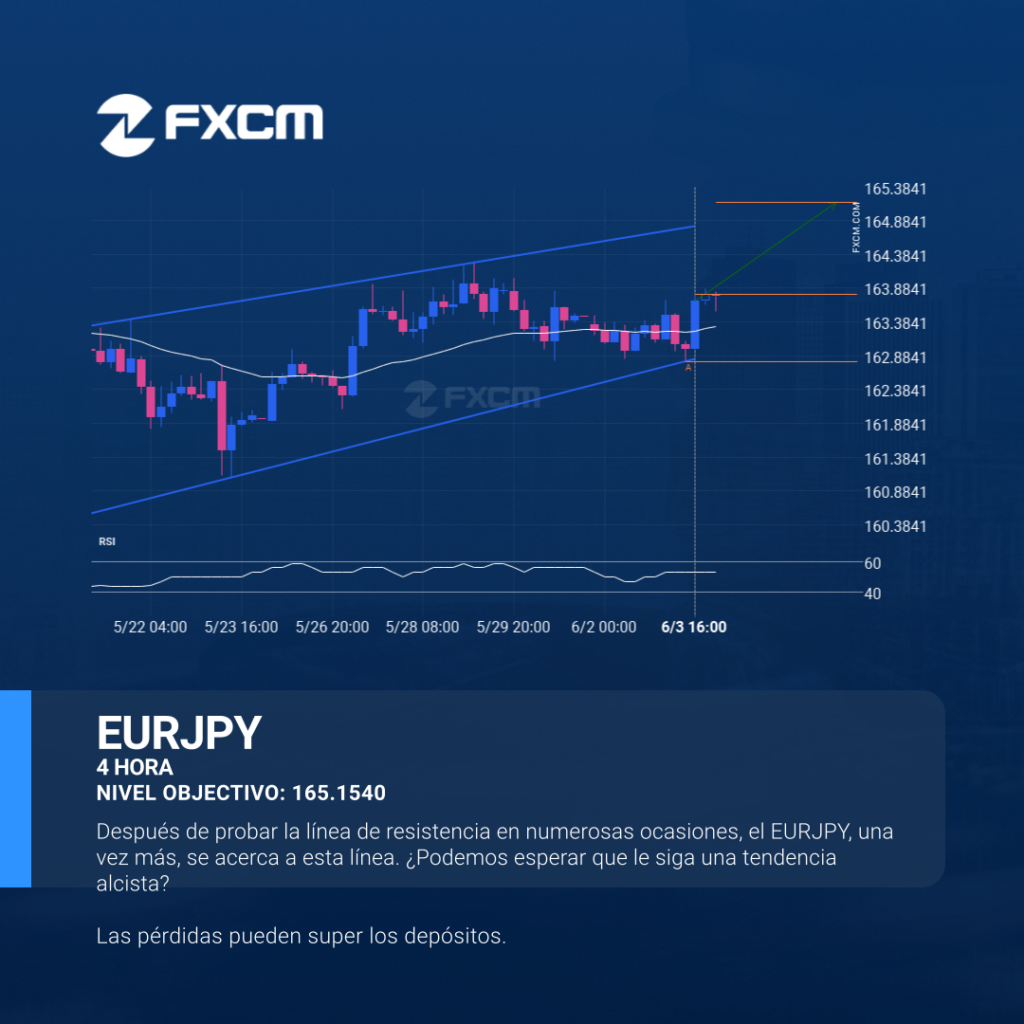
El movimiento del EURJPY hacia la línea de resistencia de un Cuña ascendente es otra prueba más de la línea que ha alcanzado en numerosas ocasiones durante el pasado. Esta prueba de la línea podría ocurrir en las próximas 3 días, pero no sabemos si dará como resultado una ruptura a través de esta línea […]
EURJPY – Continuation Chart Pattern – Rising Wedge
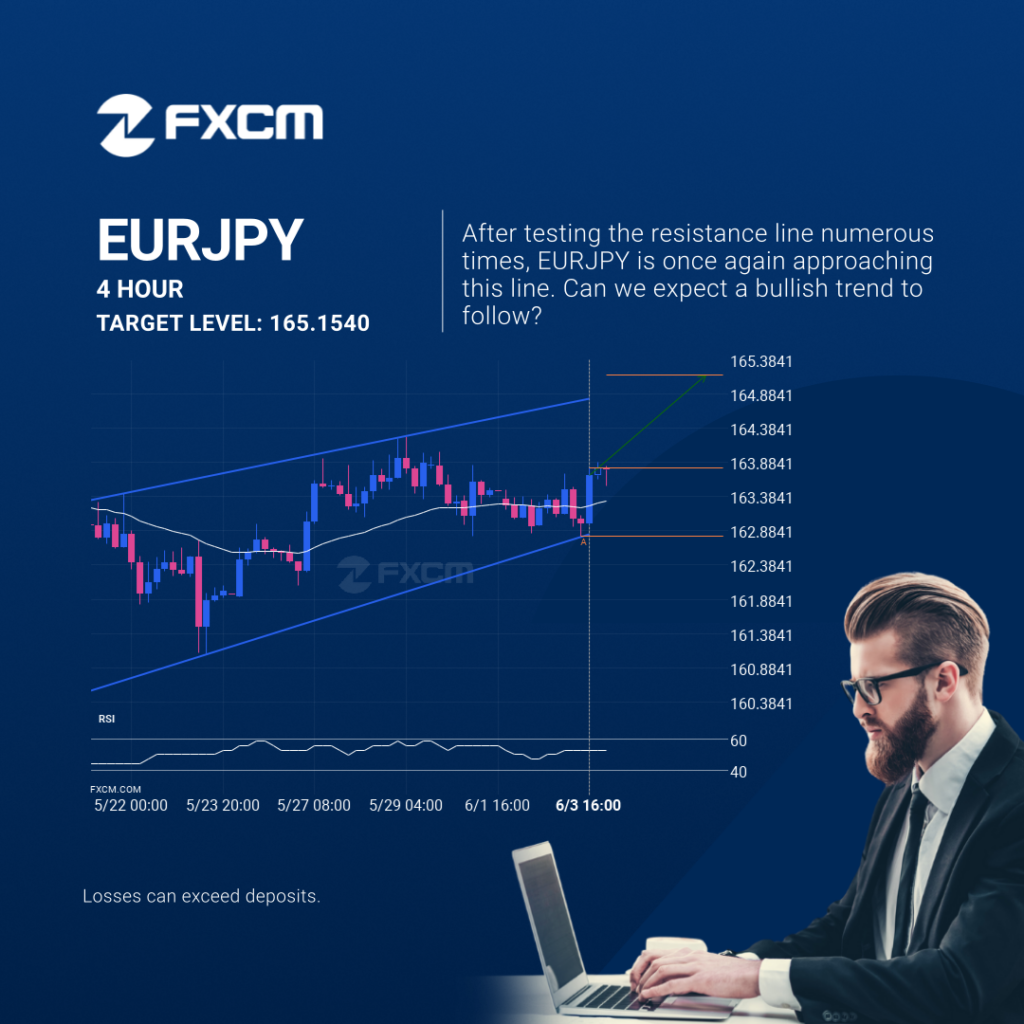
The movement of EURJPY towards the resistance line of a Rising Wedge is yet another test of the line it reached numerous times in the past. This line test could happen in the next 3 days, but it is uncertain whether it will result in a breakout through this line, or simply rebound back to […]
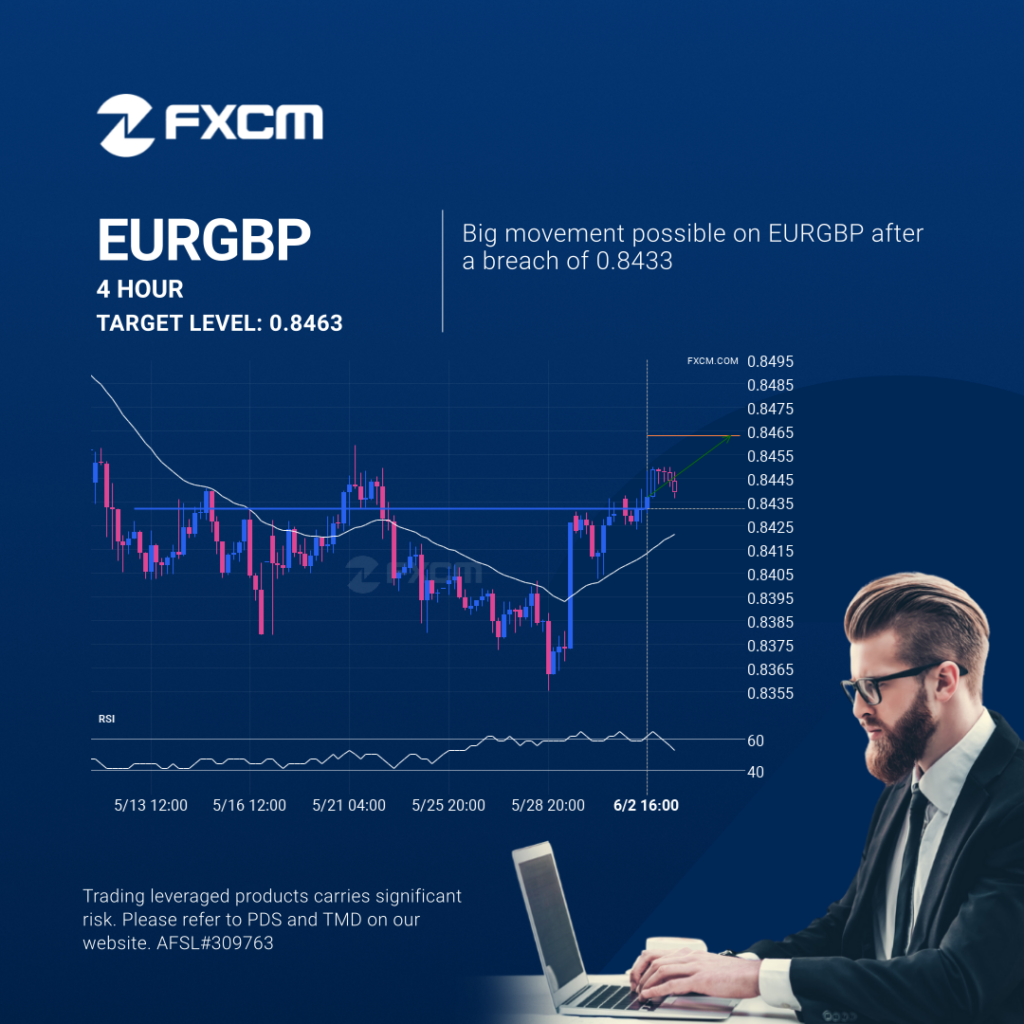
Should we expect a bullish trend on EURGBP?
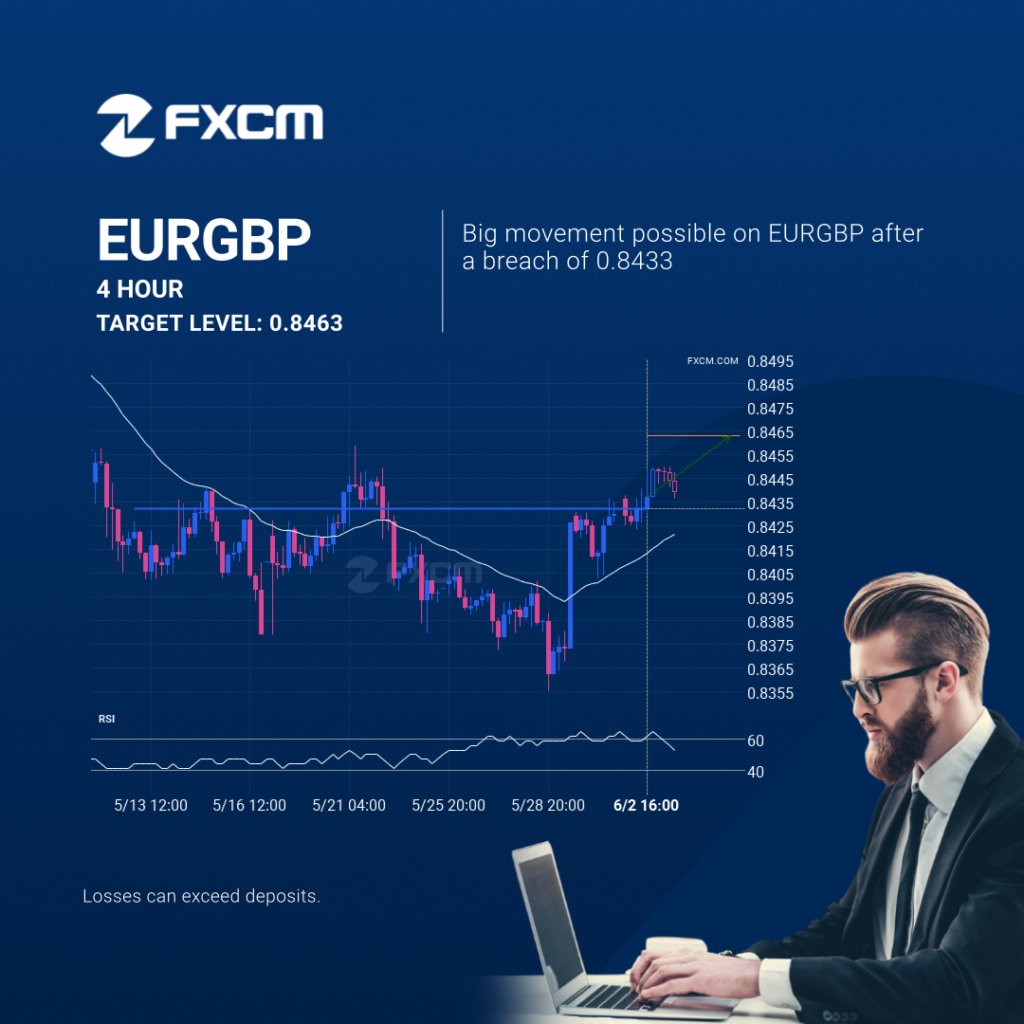
The breakout of EURGBP through the 0.8433 price line is a breach of an important psychological price that is has tested numerous in the past. If this breakout persists, EURGBP could test 0.8463 within the next 3 days. One should always be cautious before placing a trade, wait for confirmation of the breakout. Past performance […]
Should we expect a bullish trend on EURGBP?
The breakout of EURGBP through the 0.8433 price line is a breach of an important psychological price that is has tested numerous in the past. If this breakout persists, EURGBP could test 0.8463 within the next 3 days. One should always be cautious before placing a trade, wait for confirmation of the breakout. Past performance […]