Big movement possible on HKG33
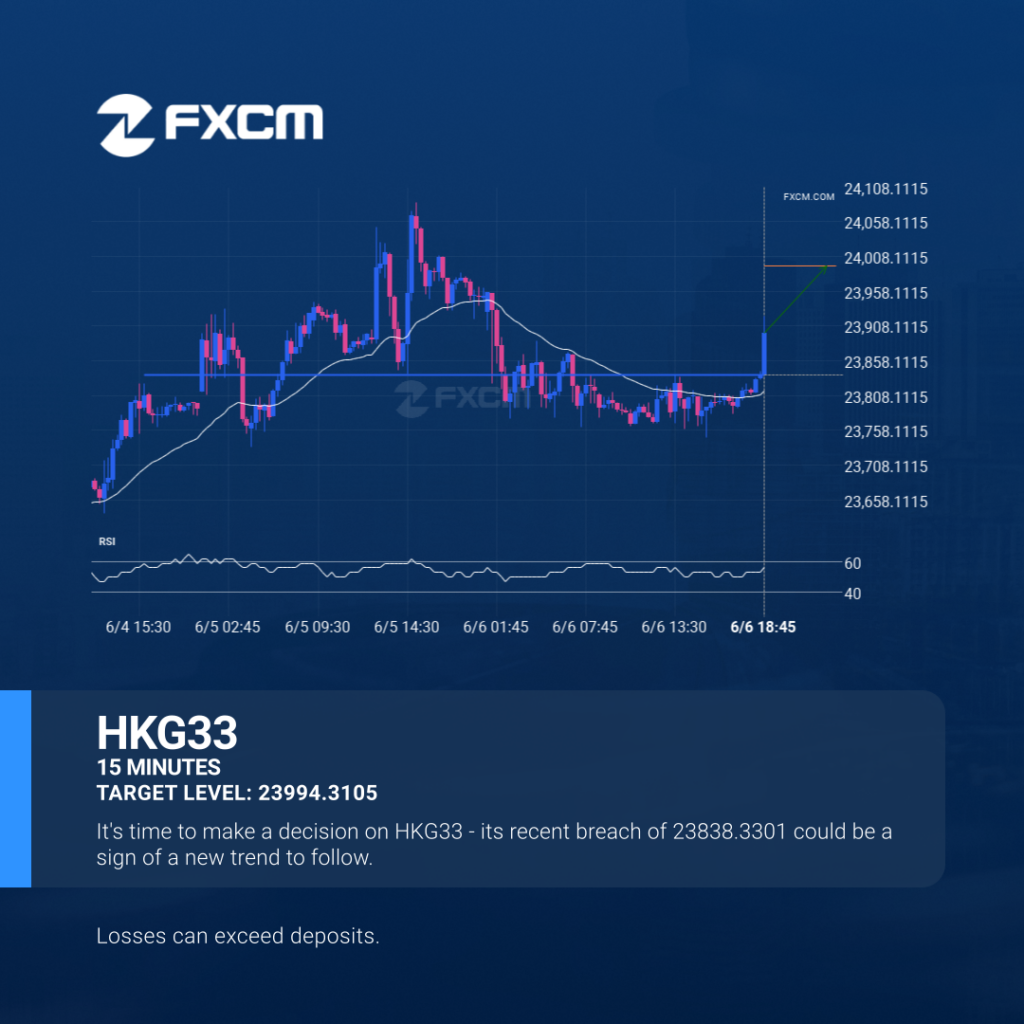
The price of HKG33 in heading in the direction of 23994.3105. Despite the recent breakout through 23838.3301 it is possible that it will struggle to gain momentum to the forecast price and move back in the other direction. This has happened many times in the past so watch for a possible bounce back. Past performance […]
¿Deberíamos esperar una irrupción o una recuperación del BTCUSD?
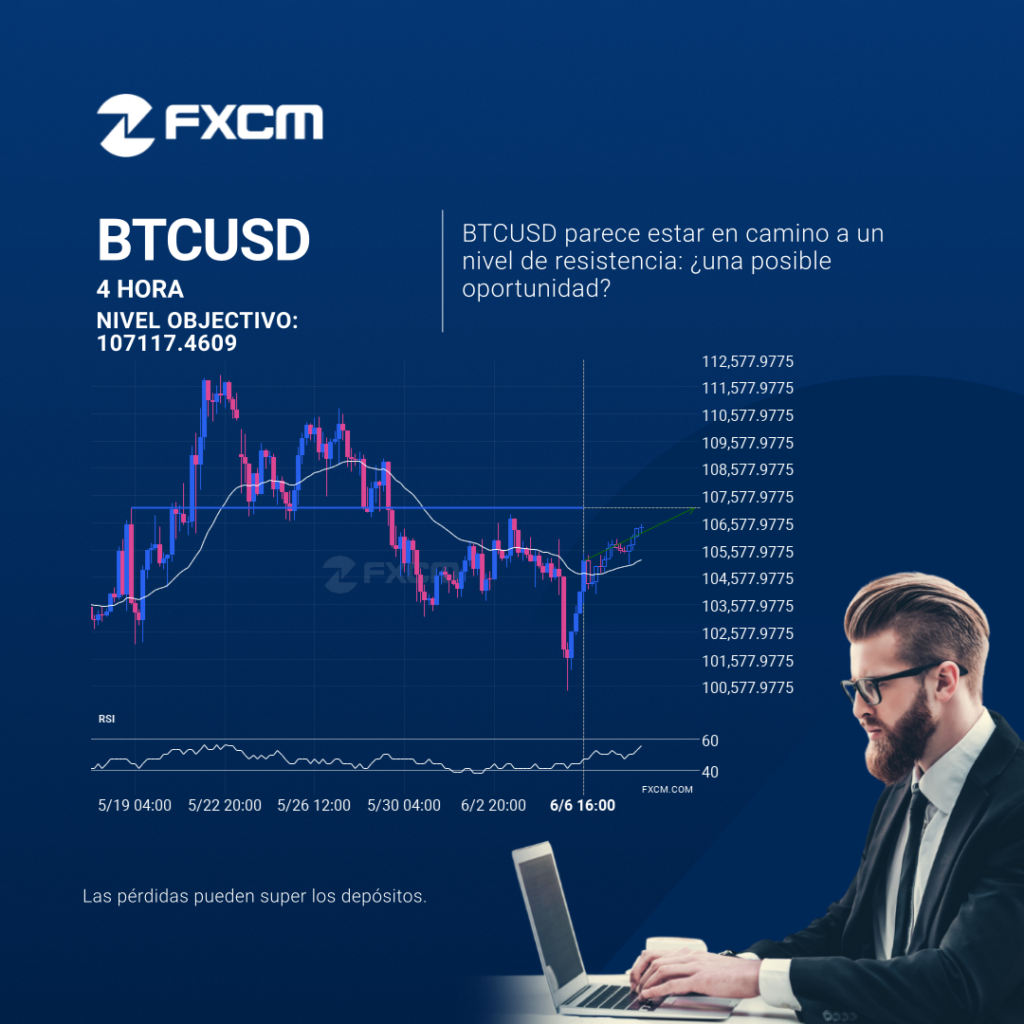
El movimiento del BTCUSD hacia la línea de precio 107117.4609 es otra prueba más de la línea que ha alcanzado en numerosas ocasiones durante el pasado. Podríamos esperar que esta prueba ocurra en las próximas 3 días, pero no sabemos si dará como resultado una irrupción a través de esta línea o simplemente una recuperación […]
Should we expect a bearish trend on NZDUSD?
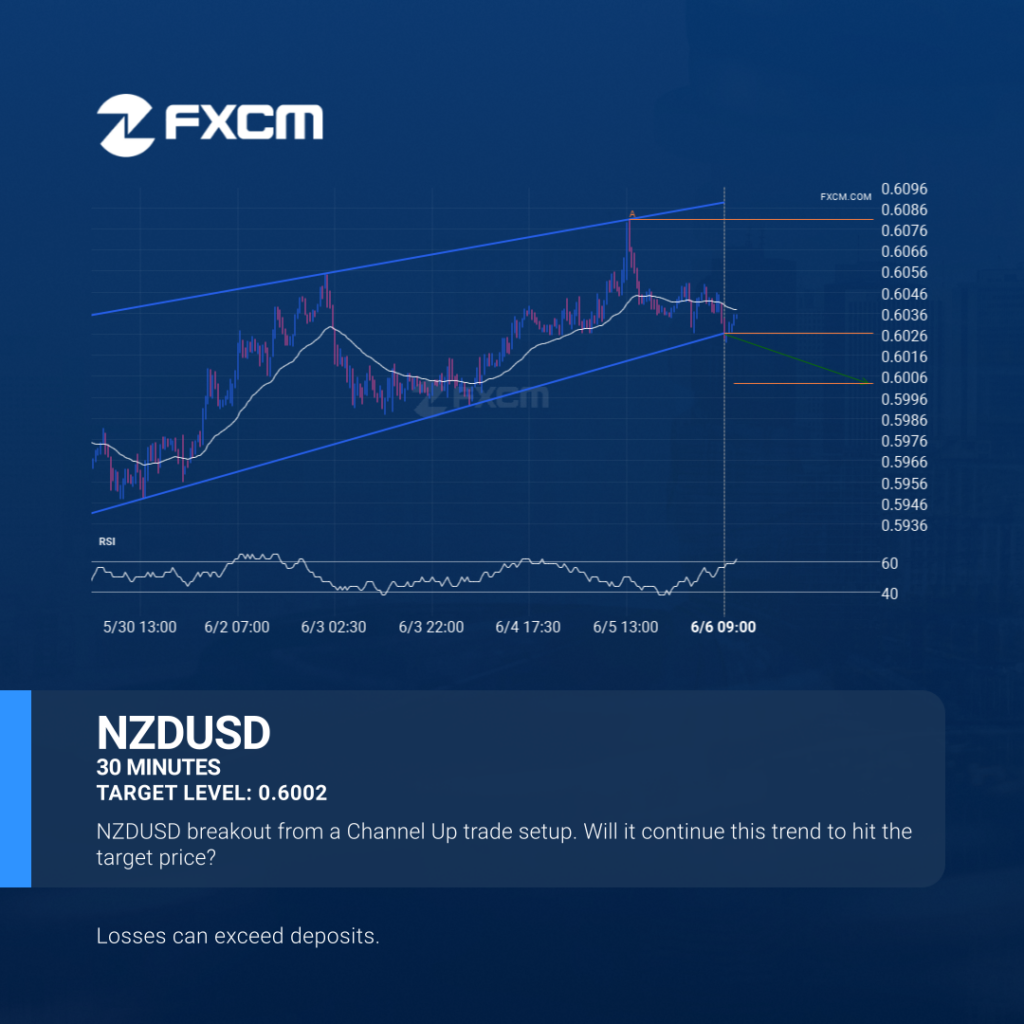
NZDUSD has broken through a support line of a Channel Up chart pattern. If this breakout holds true, we may see the price of NZDUSD testing 0.6002 within the next 2 days. But don’t be so quick to trade, it has tested this line in the past, so you should confirm the breakout before taking […]
¿Se espera una tendencia bajista para el NZDUSD?
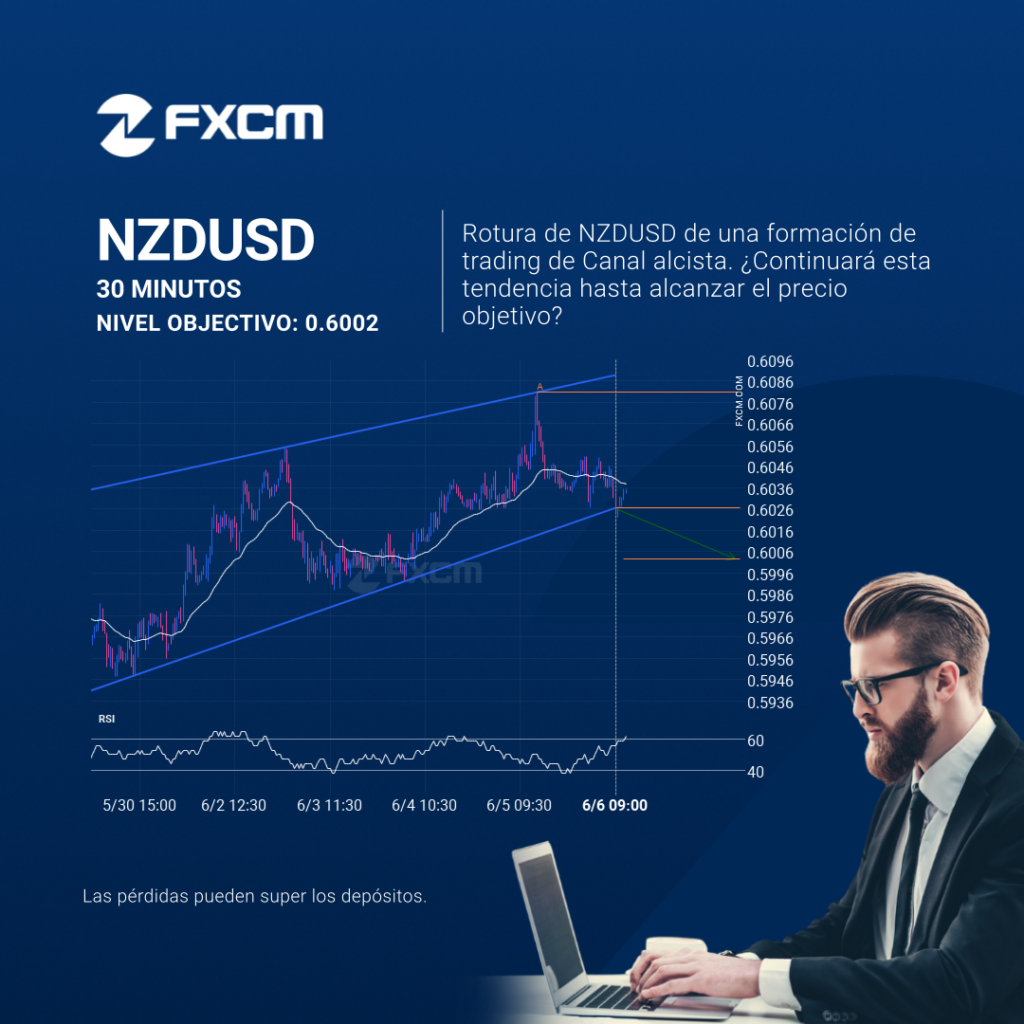
El NZDUSD ha atravesado una línea de soporte de un patrón de gráfico que corresponde a un Canal alcista. Si esta irrupción se mantiene, podríamos ver el precio del NZDUSD probando el nivel de 0.6002 dentro de las próximas 2 días. Pero no se apresure si desea operar, porque ya ha probado esta línea en […]
Should we expect a bearish trend on NZDUSD?
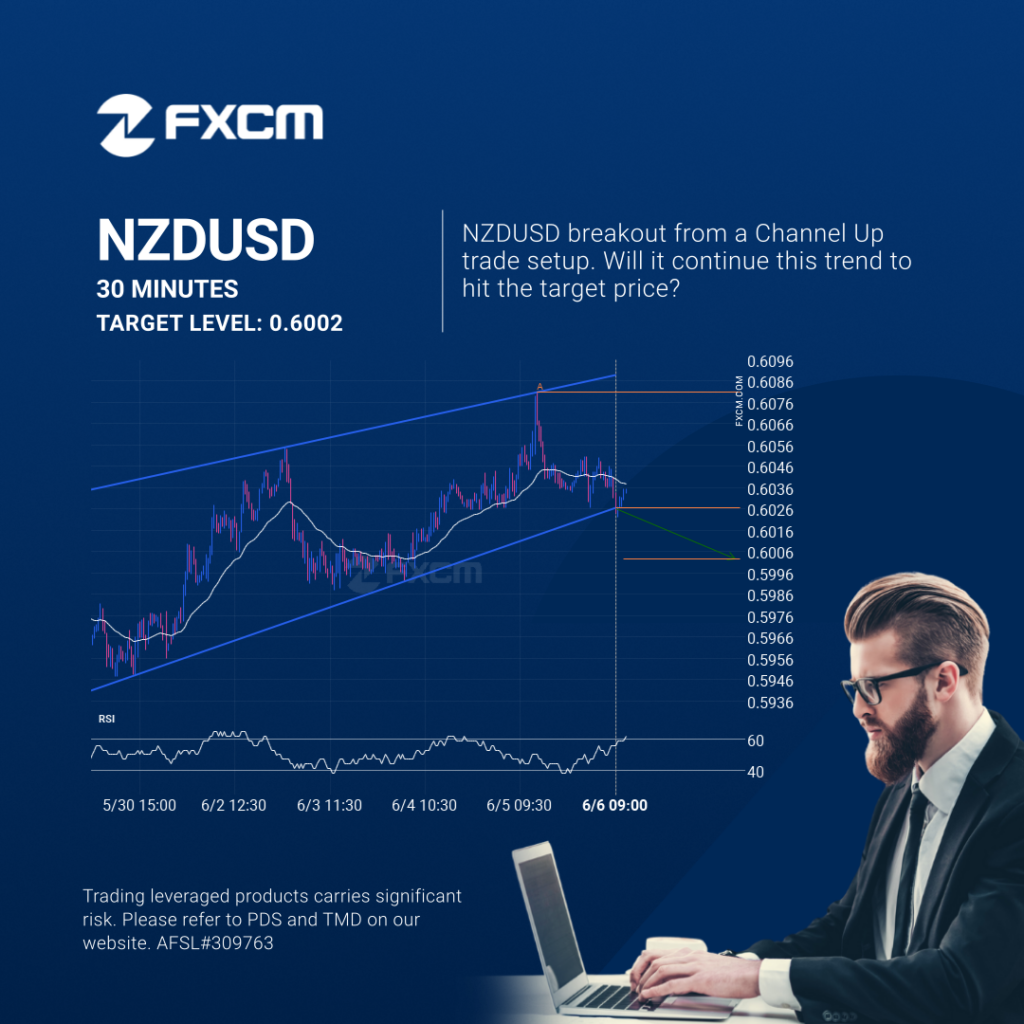
NZDUSD has broken through a support line of a Channel Up chart pattern. If this breakout holds true, we may see the price of NZDUSD testing 0.6002 within the next 2 days. But don’t be so quick to trade, it has tested this line in the past, so you should confirm the breakout before taking […]
Posible comienzo de una tendencia alcista cuando EURCHF rompa el nivel de resistencia

El EURCHF atravesó la línea de resistencia. Como ya lo hemos visto retroceder desde esta posición en el pasado, deberíamos esperar la confirmación de la ruptura antes de operar. Ha llegado a esta línea en numerosas ocasiones en los últimos 21 días, lo cual sugiere un posible nivel objetivo alrededor de 0.9422 dentro de las […]
Possible start of a bullish trend as EURCHF breaks resistance
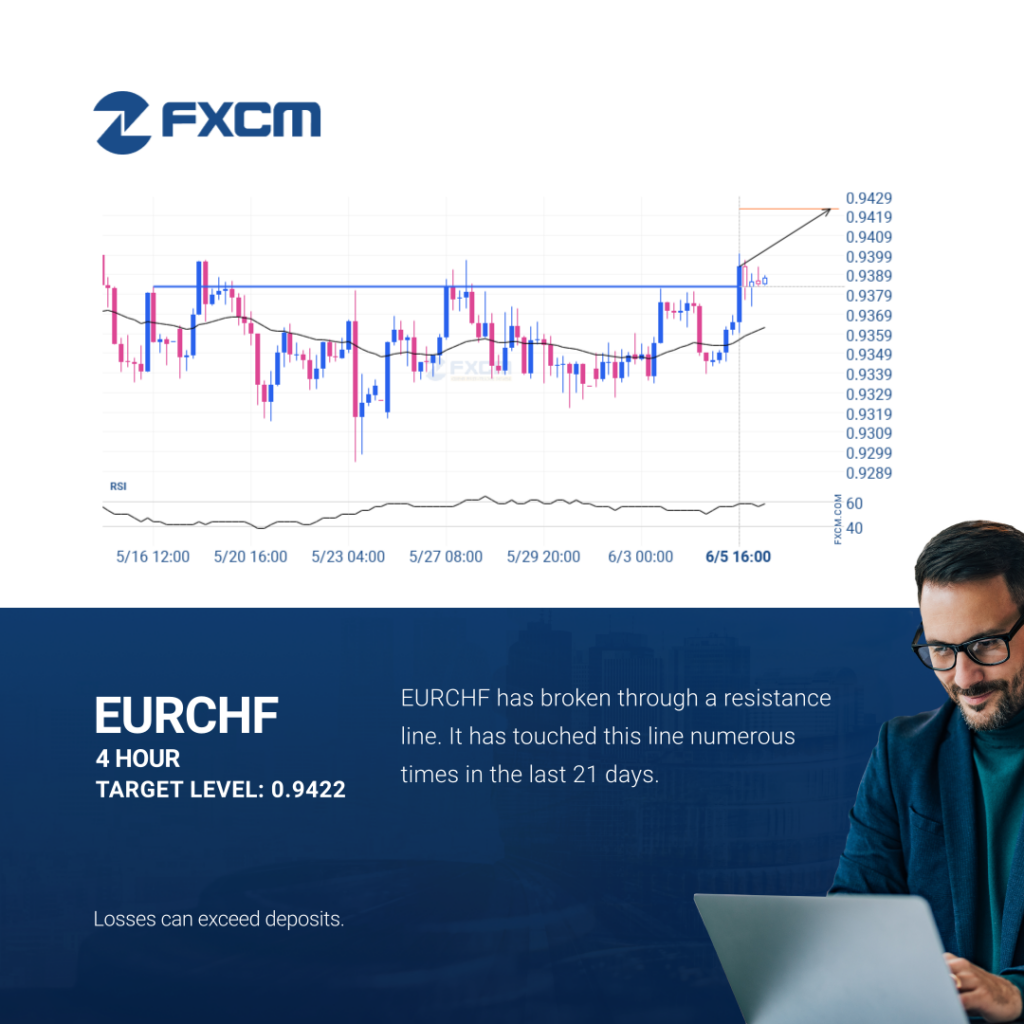
EURCHF has broken through a resistance line. Because we have seen it retrace from this price in the past, one should wait for confirmation of the breakout before trading. It has touched this line numerous times in the last 21 days and suggests a possible target level to be around 0.9422 within the next 4 […]
EURGBP – Continuation Chart Pattern – Channel Up
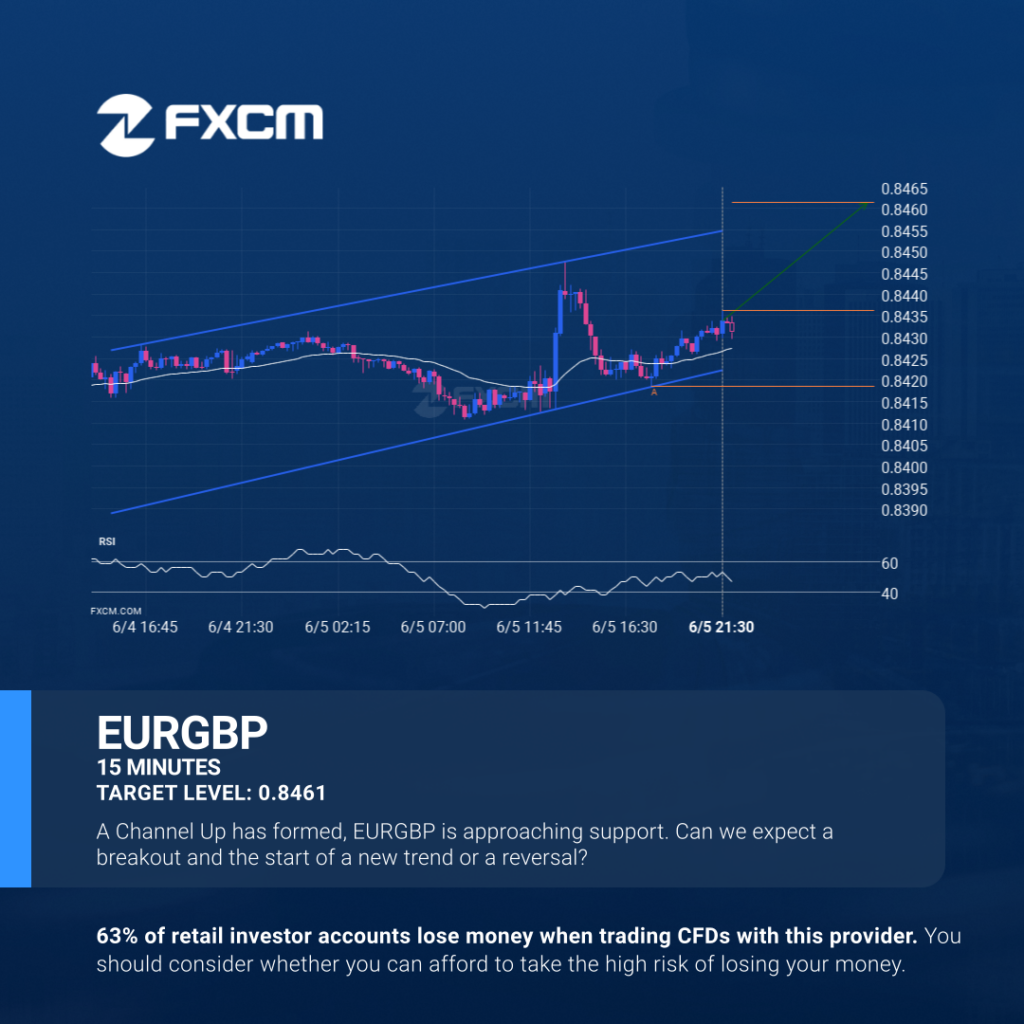
EURGBP is heading towards the resistance line of a Channel Up. If this movement continues, the price of EURGBP could test 0.8461 within the next 9 hours. It has tested this line numerous times in the past, so this movement could be short-lived and end up rebounding just like it did in the past. Past […]
BTCUSD va en camino hacia abajo
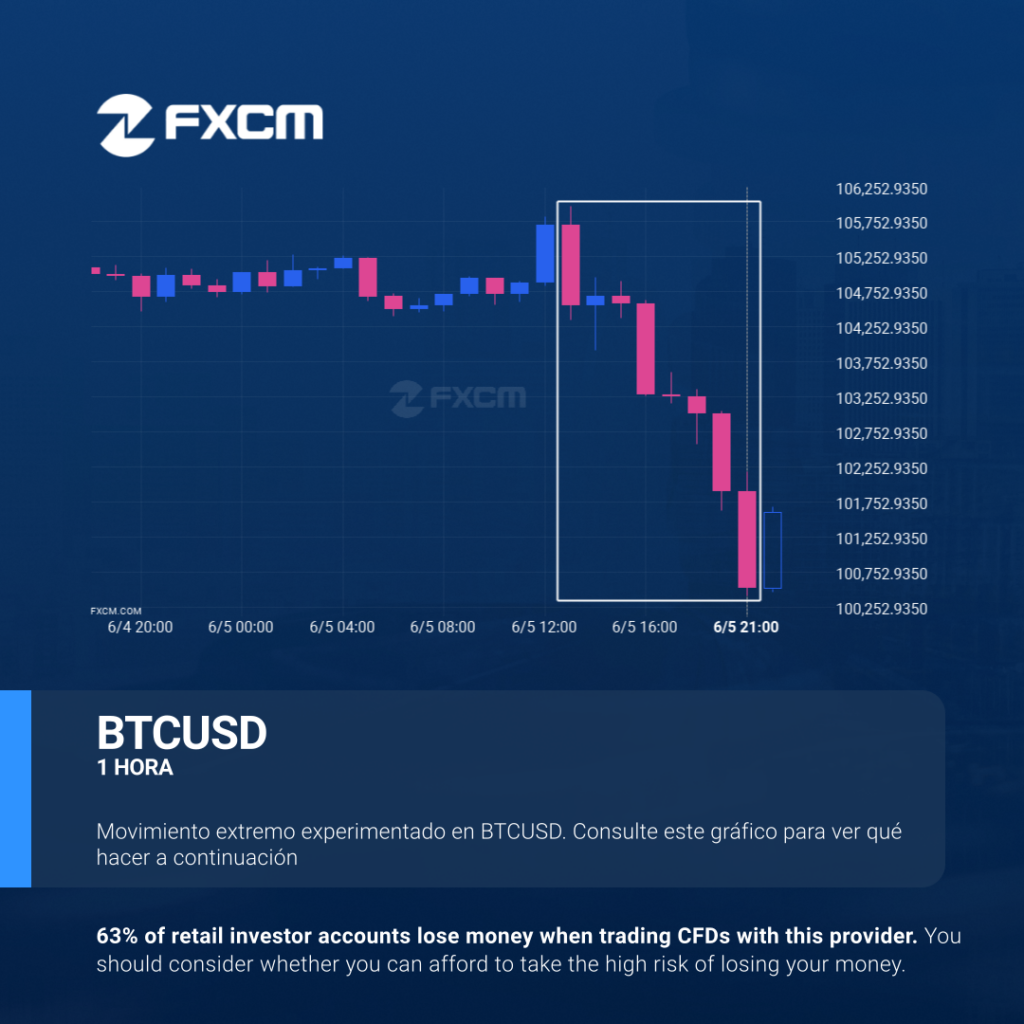
BTCUSD llegó a 100522.79 después de un movimiento del 3,86% que ha durado 8 horas. El rendimiento pasado no es indicativo de resultados futuros. Las pérdidas pueden exceder los fondos depositados.
EURGBP – Continuation Patrón de gráfico – Canal alcista
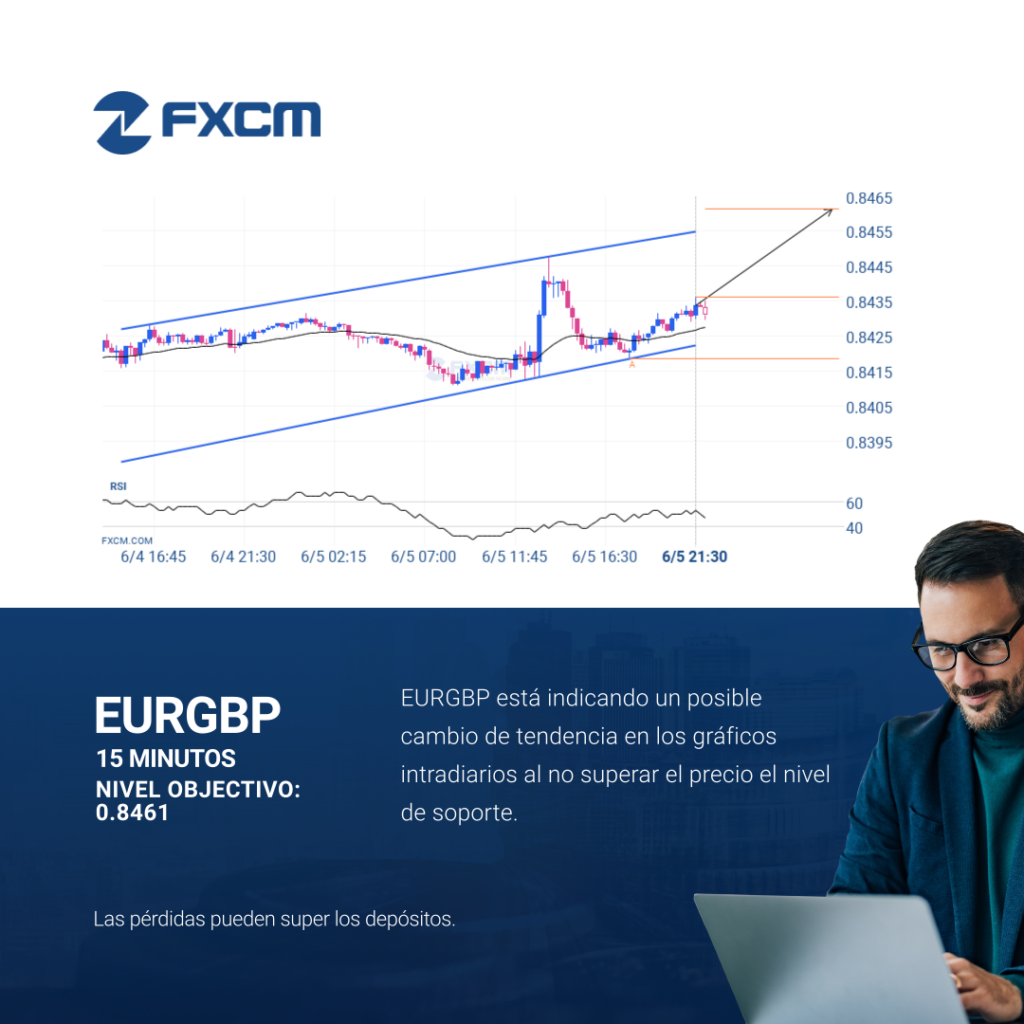
El EURGBP se dirige a la línea de resistencia de un Canal alcista. Si este movimiento se mantiene, el precio de EURGBP podría probar el nivel de 0.8461 en las próximas 9 horas. Ya ha probado esta línea en numerosas ocasiones, por lo que este movimiento podría durar poco y terminar recuperándose, igual que ha […]