AUDUSD approaching resistance of a Rising Wedge
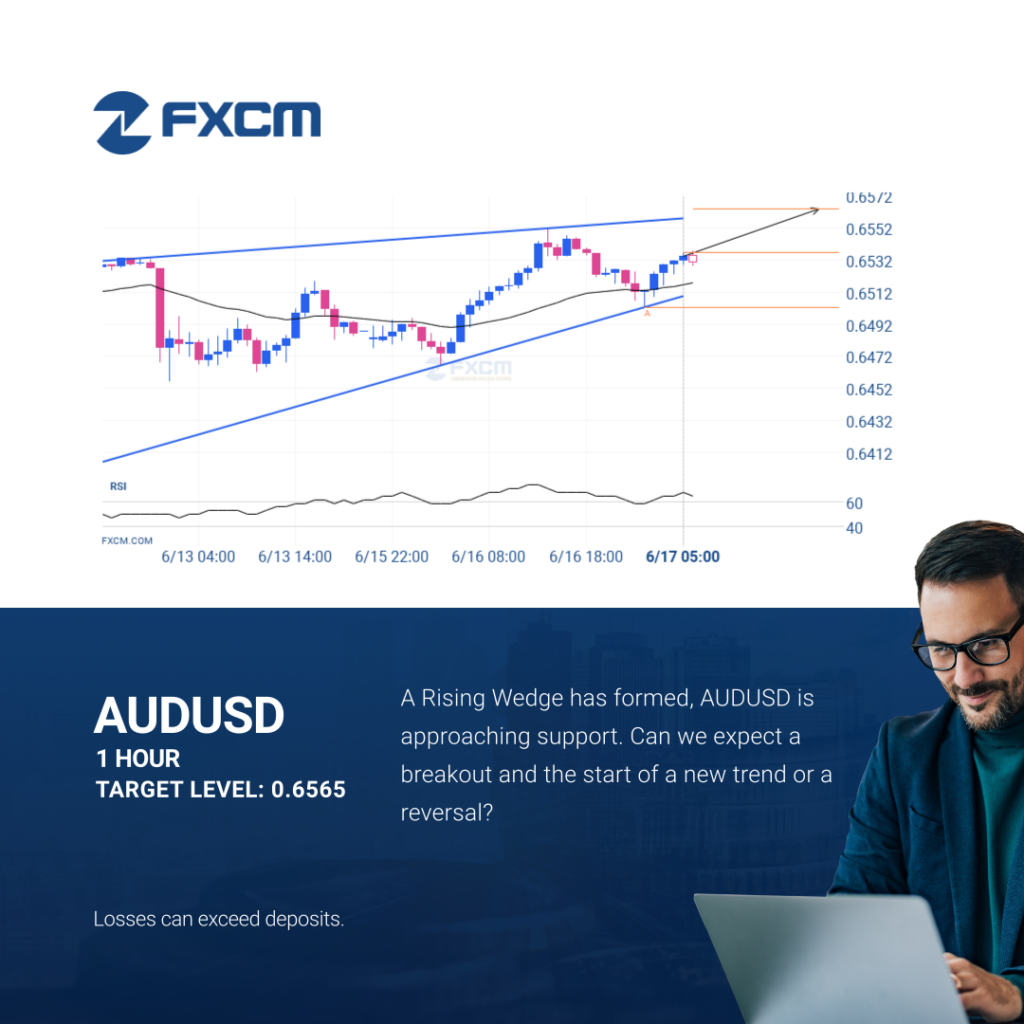
AUDUSD is approaching the resistance line of a Rising Wedge. It has touched this line numerous times in the last 5 days. If it tests this line again, it should do so in the next 17 hours. Past performance is not an indicator of future results. Losses can exceed deposits.
AUDUSD approaching resistance of a Rising Wedge
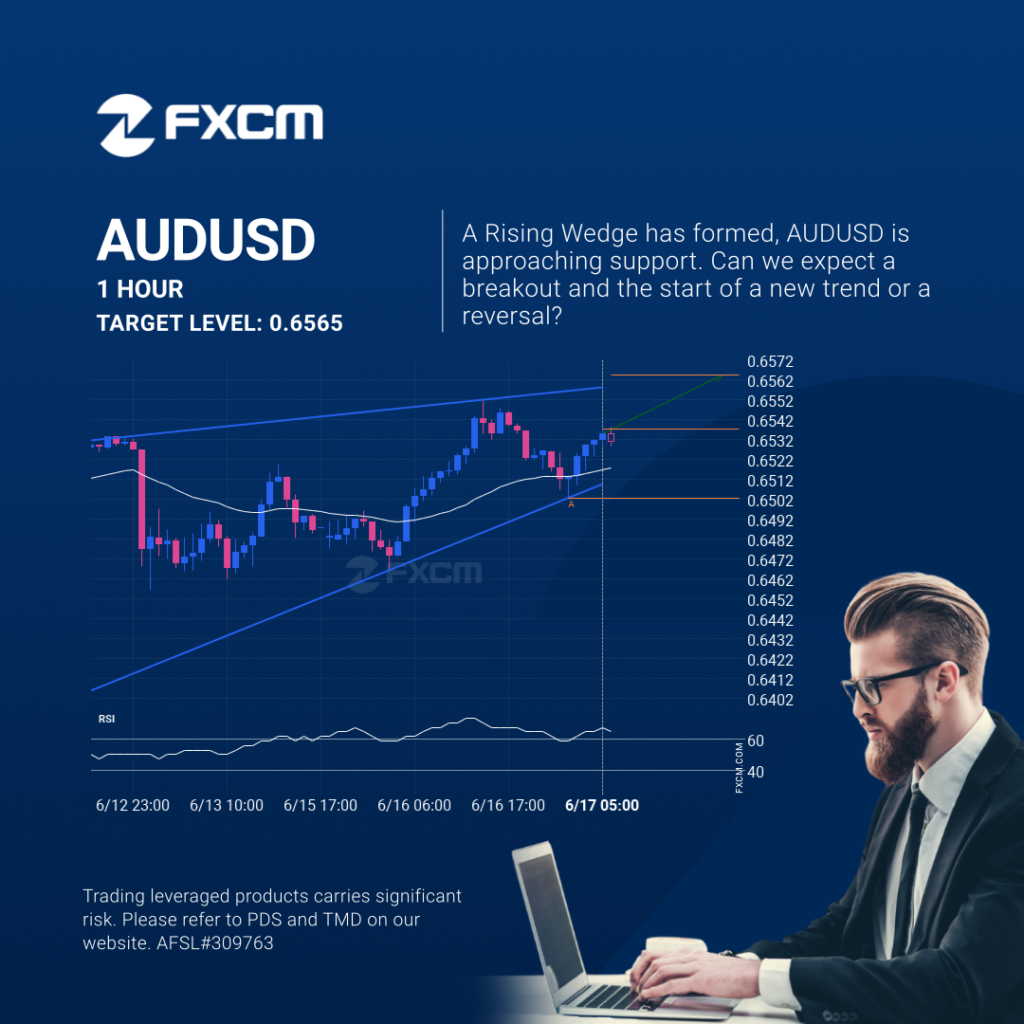
AUDUSD is approaching the resistance line of a Rising Wedge. It has touched this line numerous times in the last 5 days. If it tests this line again, it should do so in the next 17 hours. Past performance is not an indicator of future results. Trading leveraged products carries significant risk. Please refer to […]
Previsión de trading de EURGBP a las 2025-06-16T18:00:00.000Z hasta las 2025-06-16T18:00:00.000Z
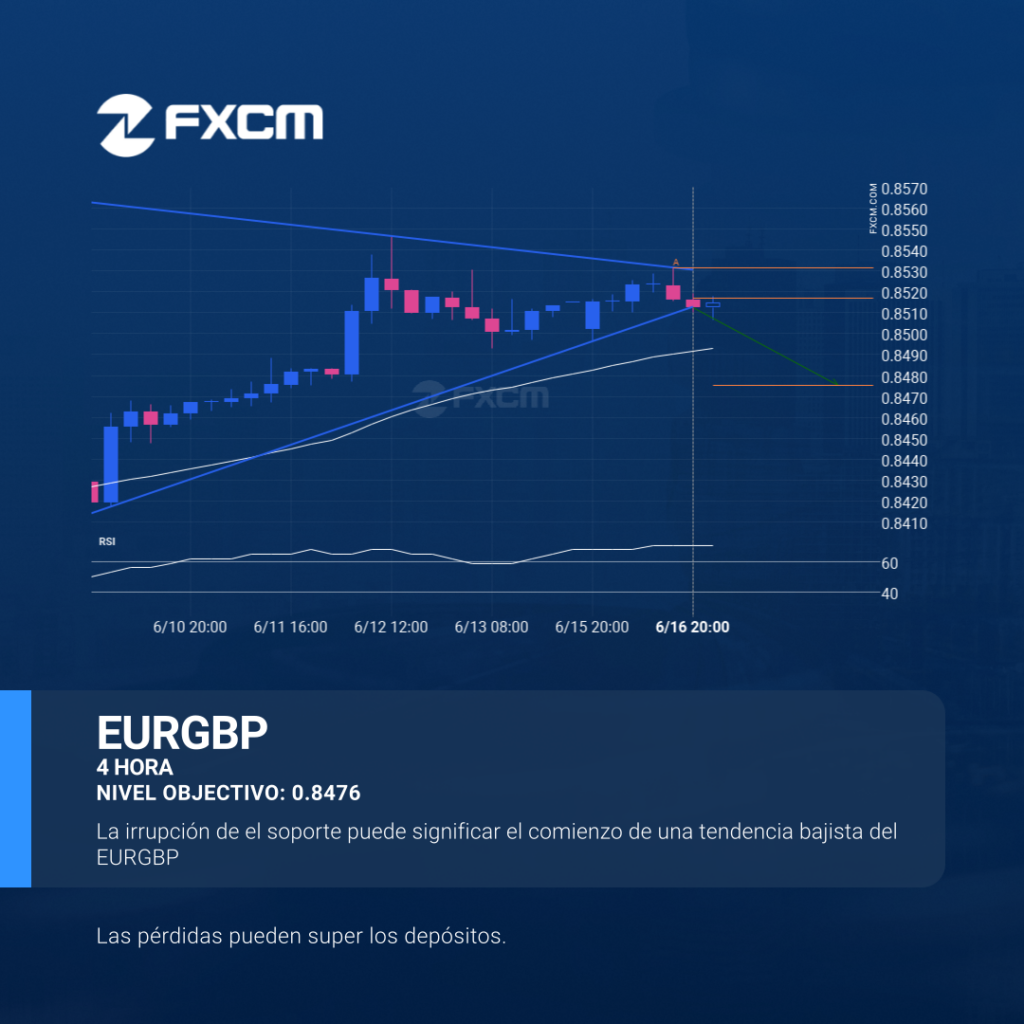
Las últimas 12 velas de 4 Hora en EURGBP formaron un patrón de Triángulo y rompieron a través de las líneas del patrón, lo que indica un posible movimiento bajista hacia el nivel de precio en 0.8476. El rendimiento pasado no es indicativo de resultados futuros. Las pérdidas pueden exceder los fondos depositados.
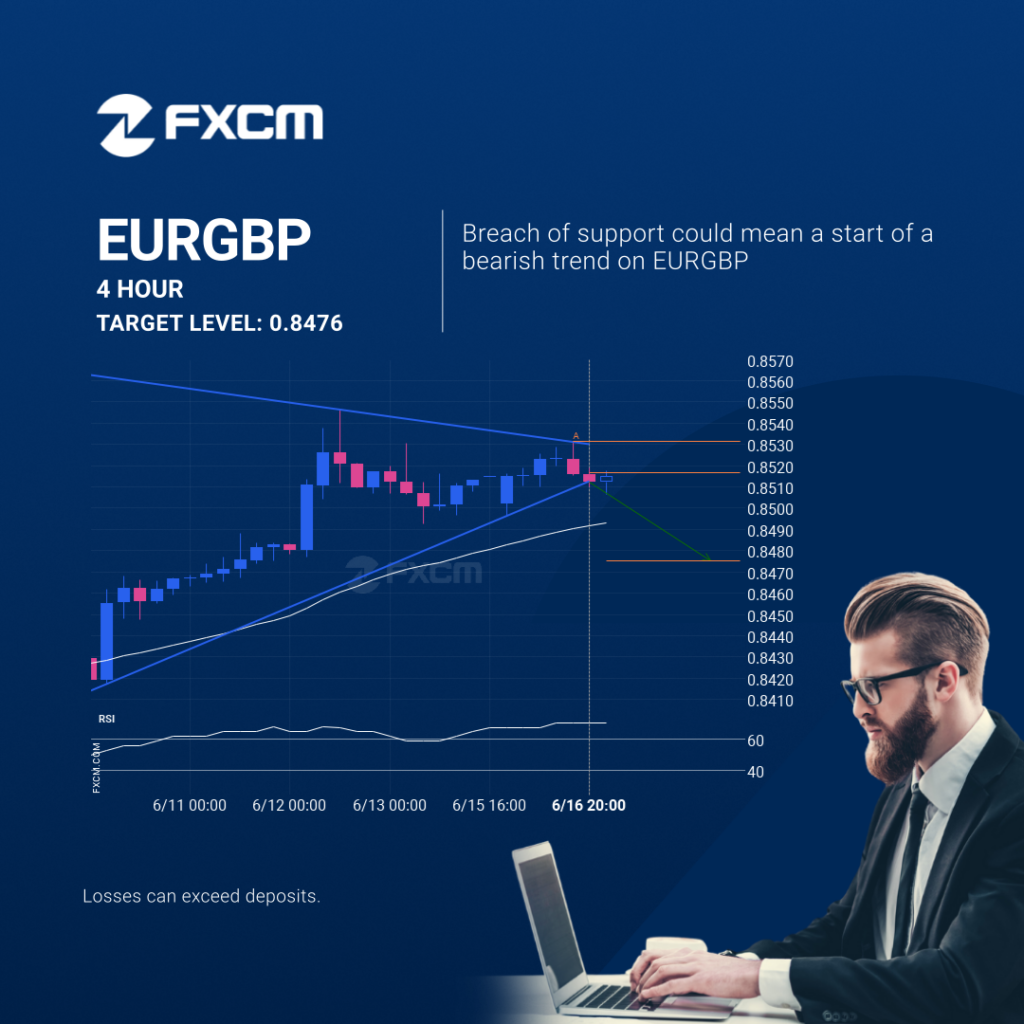
EURGBP trade outlook at 2025-06-16T18:00:00.000Z until 2025-06-16T18:00:00.000Z
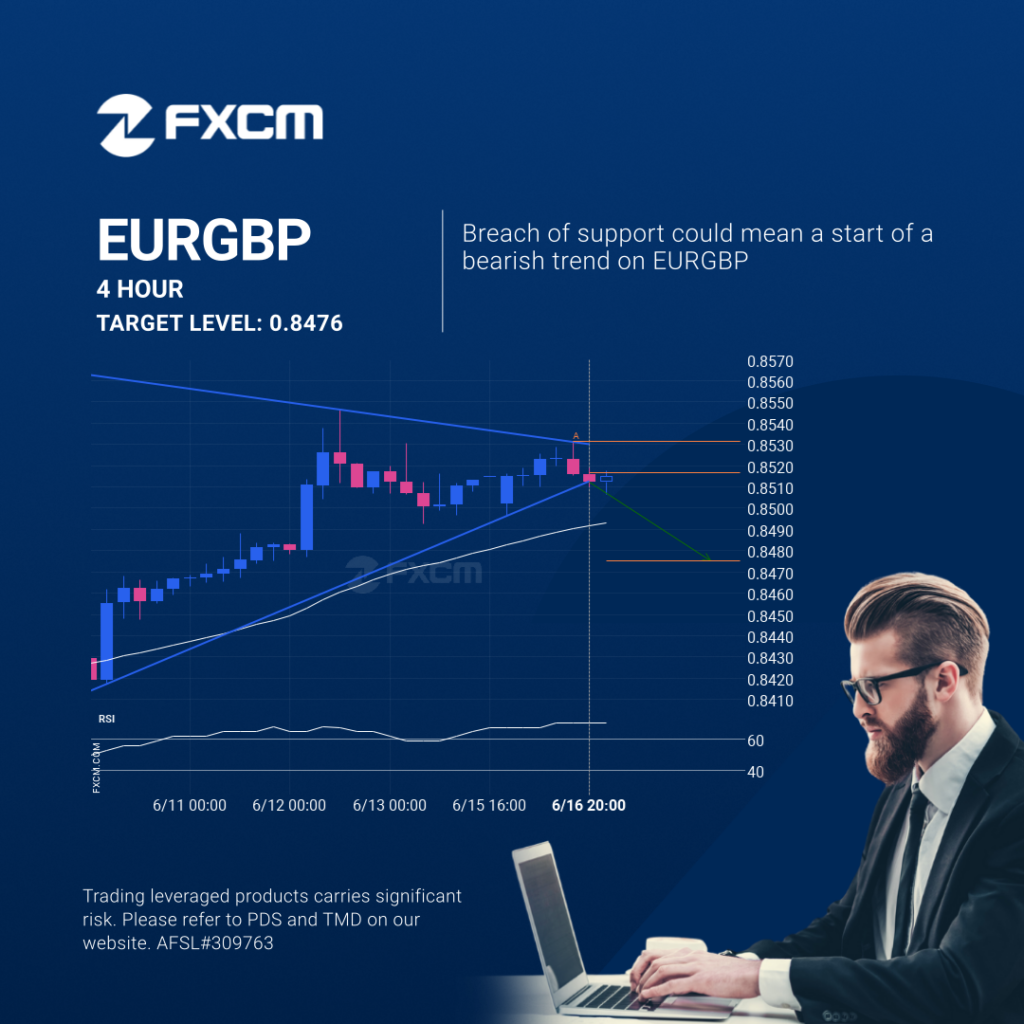
The last 12 4 hour candles on EURGBP formed a Triangle pattern and broken out through the pattern lines, indicating a possible bearish movement towards the price level of 0.8476. Past performance is not an indicator of future results. Trading leveraged products carries significant risk. Please refer to PDS and TMD on our website. AFSL#309763
EURGBP trade outlook at 2025-06-16T18:00:00.000Z until 2025-06-16T18:00:00.000Z
The last 12 4 hour candles on EURGBP formed a Triangle pattern and broken out through the pattern lines, indicating a possible bearish movement towards the price level of 0.8476. Past performance is not an indicator of future results. Losses can exceed deposits.
Posible gran movimiento en el BTCUSD
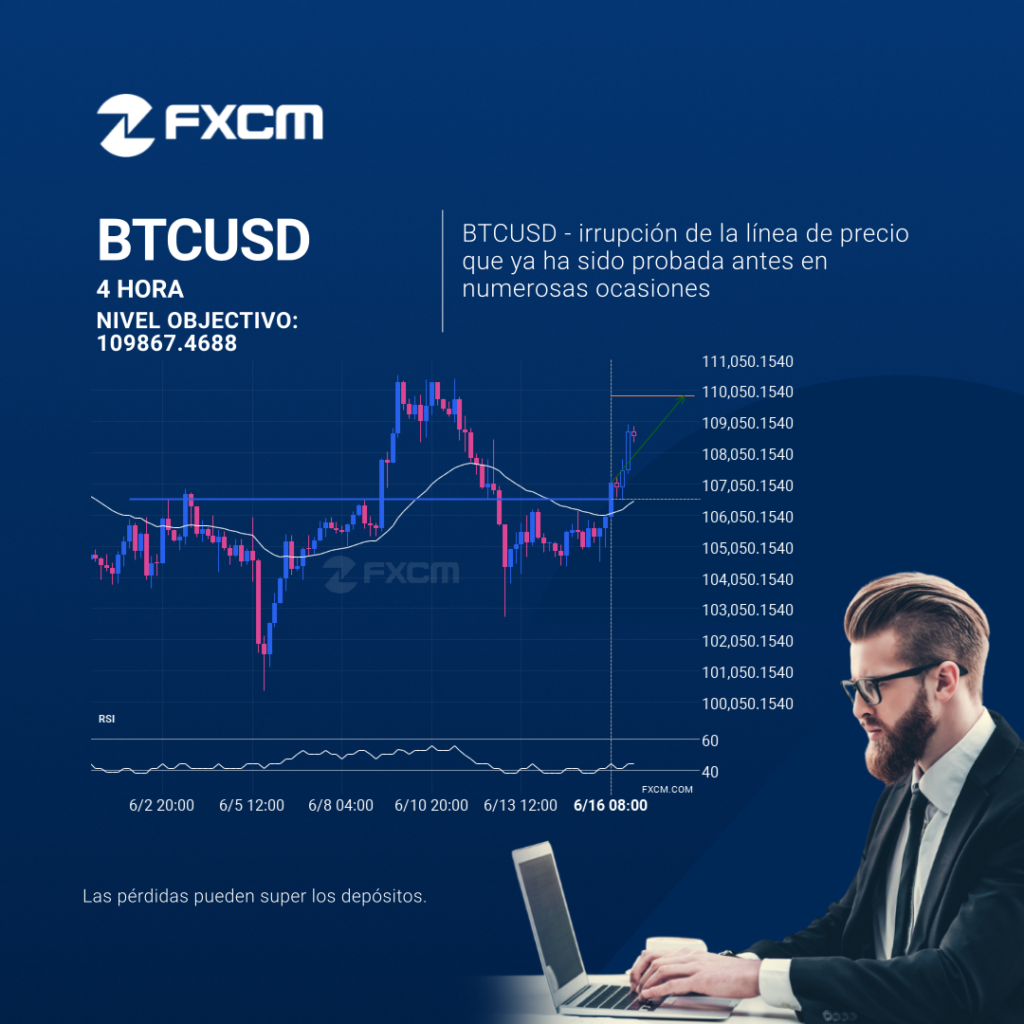
El BTCUSD ha atravesado una línea de 106573.0313. Si esta rotura se mantiene, podríamos ver el precio del BTCUSD dirigiéndose al nivel de 109867.4688 en las próximas 3 días. Pero no debe apresurarse a la hora de operar, porque ya ha probado esta línea en numerosas ocasiones durante el pasado, por lo que probablemente debería […]
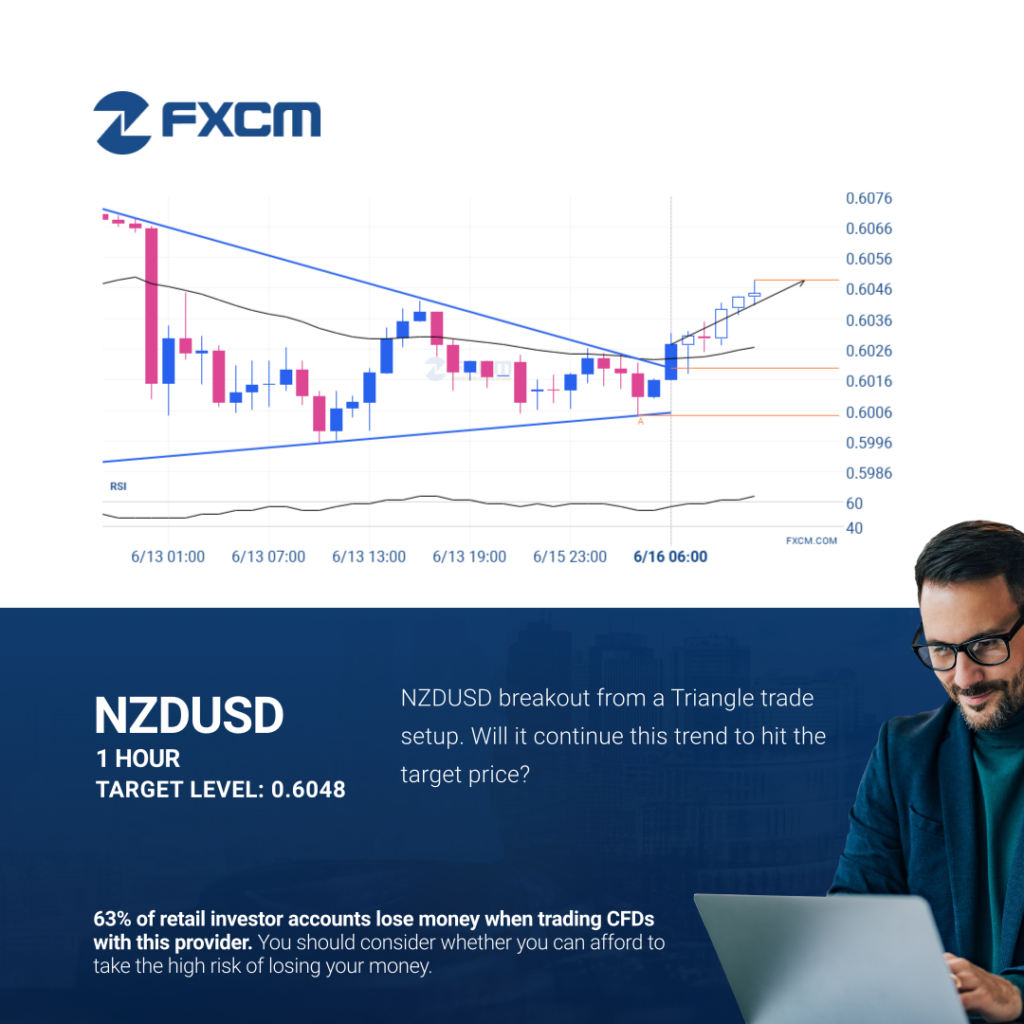
bullish technical pattern on NZDUSD 1 hour
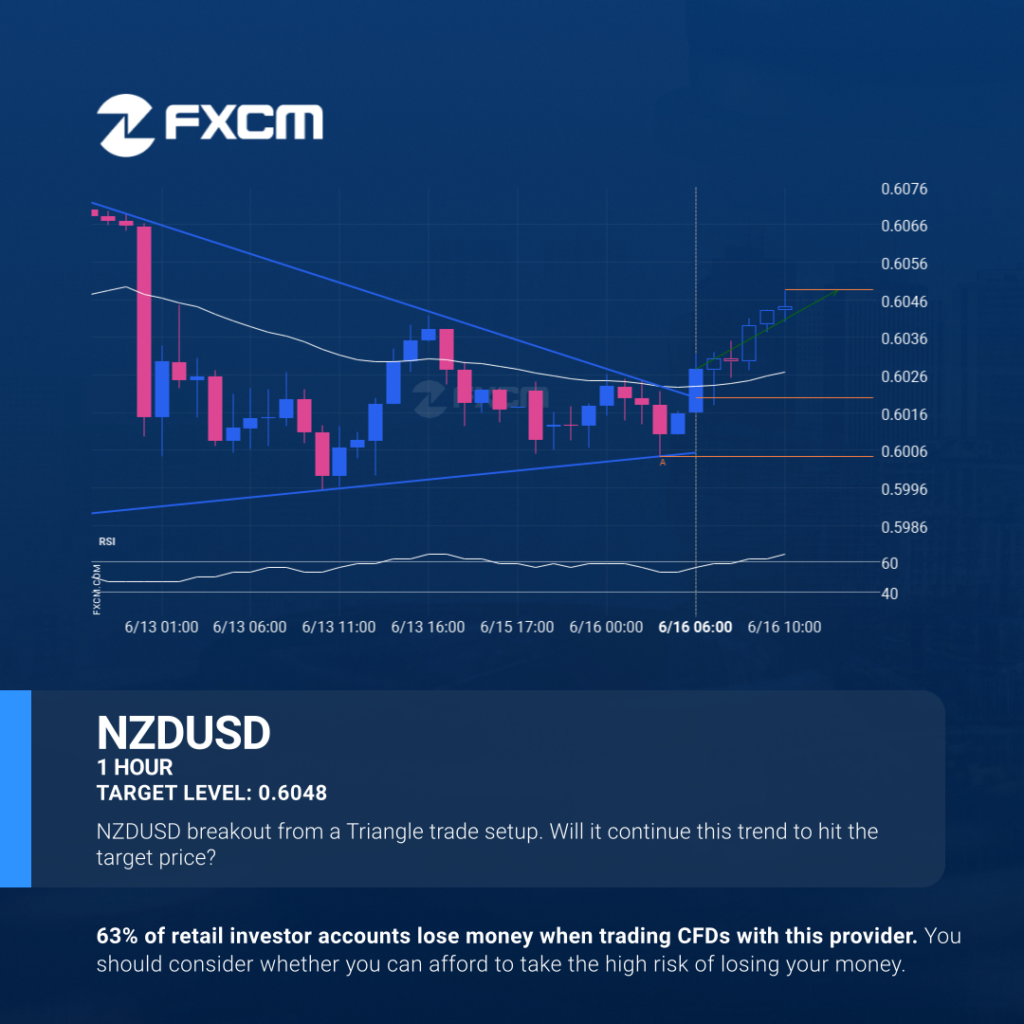
Triangle pattern identified on NZDUSD has broken through a resistance level with the price momentum continuing to move in an upward direction. A solid trading opportunity continues with the price expected to reach 0.6048 in the next 5. Past performance is not an indicator of future results. Trading leveraged products carries significant risk. Please refer […]
bullish technical pattern on NZDUSD 1 hour
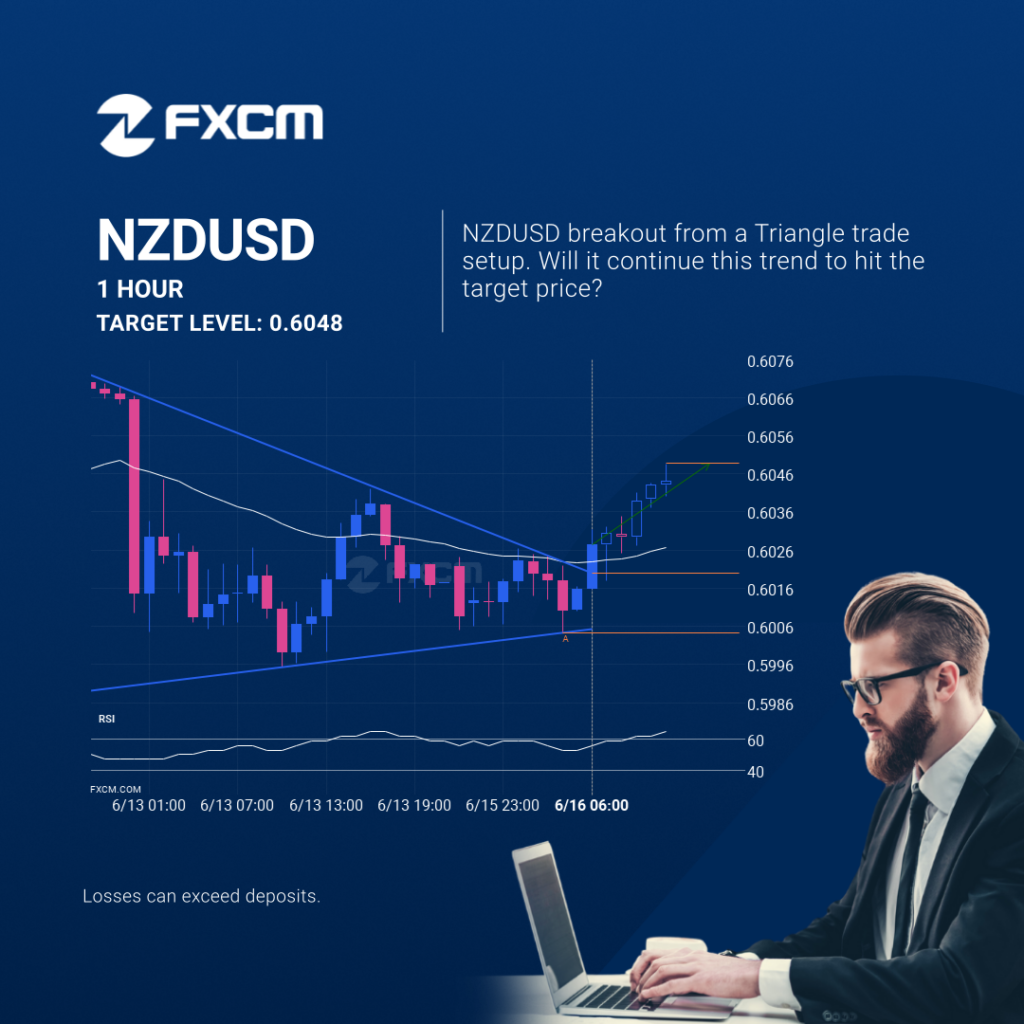
Triangle pattern identified on NZDUSD has broken through a resistance level with the price momentum continuing to move in an upward direction. A solid trading opportunity continues with the price expected to reach 0.6048 in the next 5. Past performance is not an indicator of future results. Losses can exceed deposits.
Patrón técnico alcista en NZDUSD 1 Hora
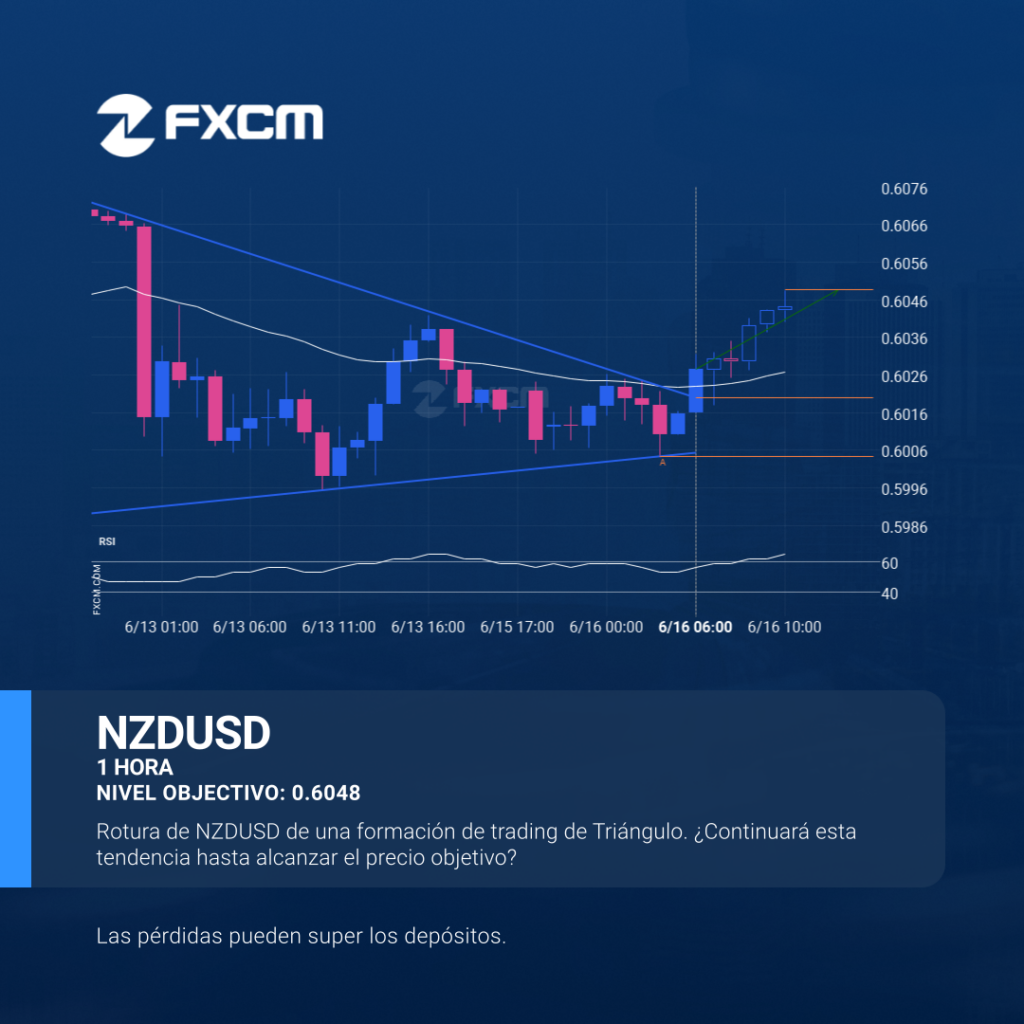
El patrón de Triángulo identificado en NZDUSD ha atravesado un nivel de resistencia y el impulso del precio continúa moviéndose en dirección alcista. Continúa siendo una buena oportunidad de trading y se espera que el precio alcance 0.6048 en un plazo de 5. El rendimiento pasado no es indicativo de resultados futuros. Las pérdidas pueden […]
bullish technical pattern on NZDUSD 1 hour
Triangle pattern identified on NZDUSD has broken through a resistance level with the price momentum continuing to move in an upward direction. A solid trading opportunity continues with the price expected to reach 0.6048 in the next 5. Past performance is not an indicator of future results. Trading leveraged products carries significant risk. Please refer […]