EURCHF approaching resistance level
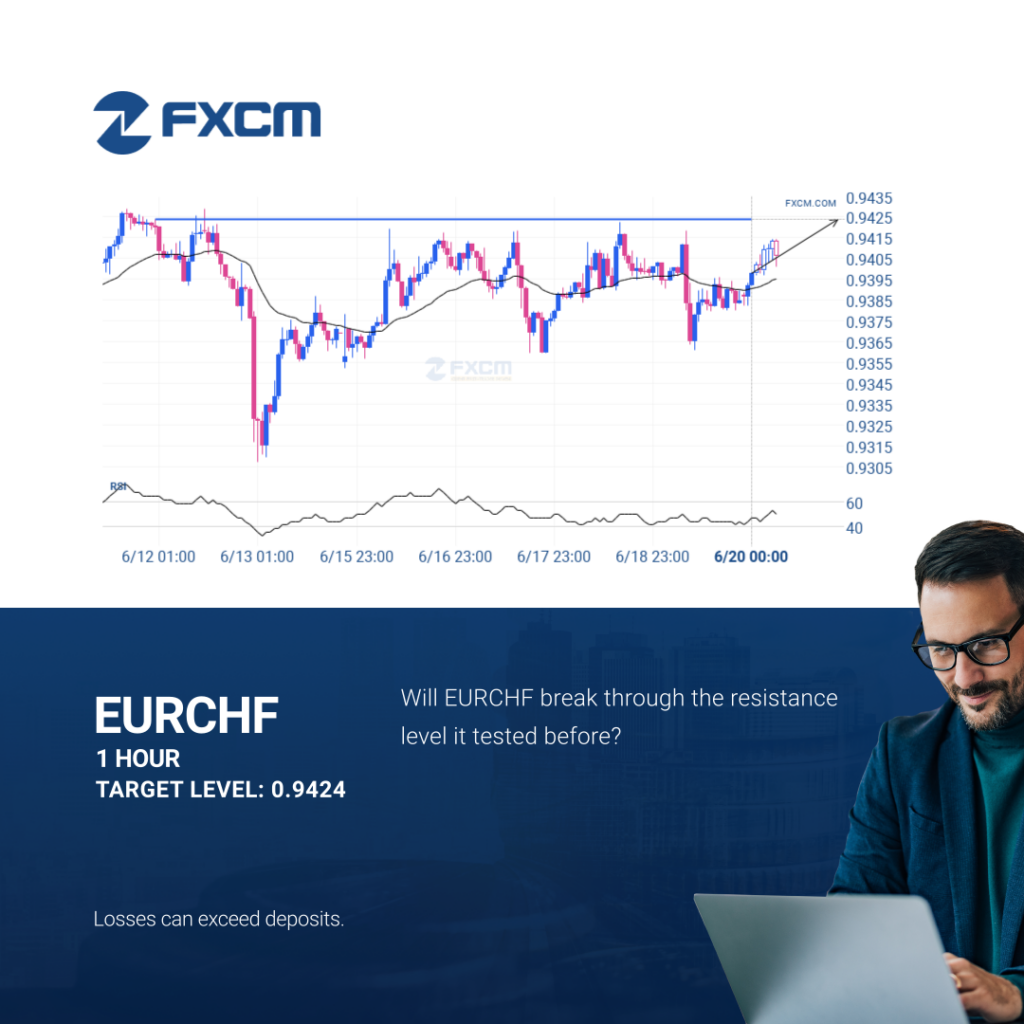
EURCHF is en route to a very important line that will be a definite deciding factor of what is to come! We may see this trajectory continue to touch and break through 0.9424, unless it runs out of momentum and pulls back to current levels. Past performance is not an indicator of future results. Losses […]
USDJPY trade outlook at 2025-06-19T10:00:00.000Z until 2025-06-19T10:00:00.000Z
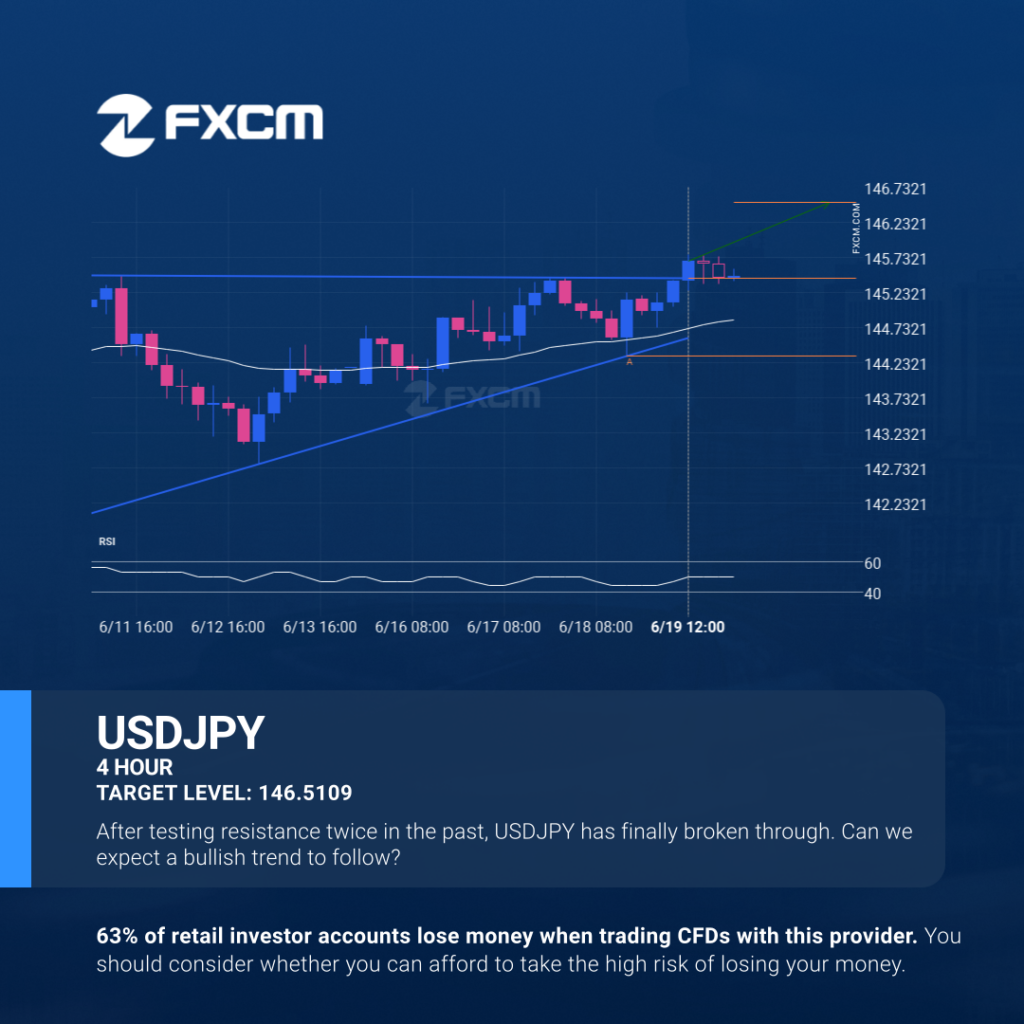
USDJPY has broken through the resistance line which it has tested twice in the past. We have seen it retrace from this line before, so one should wait for confirmation of the breakout before trading. If this new trend persists, a target level of around 146.5109 may materialize within the next 2 days. Past performance […]
Previsión de trading de USDJPY a las 2025-06-19T10:00:00.000Z hasta las 2025-06-19T10:00:00.000Z
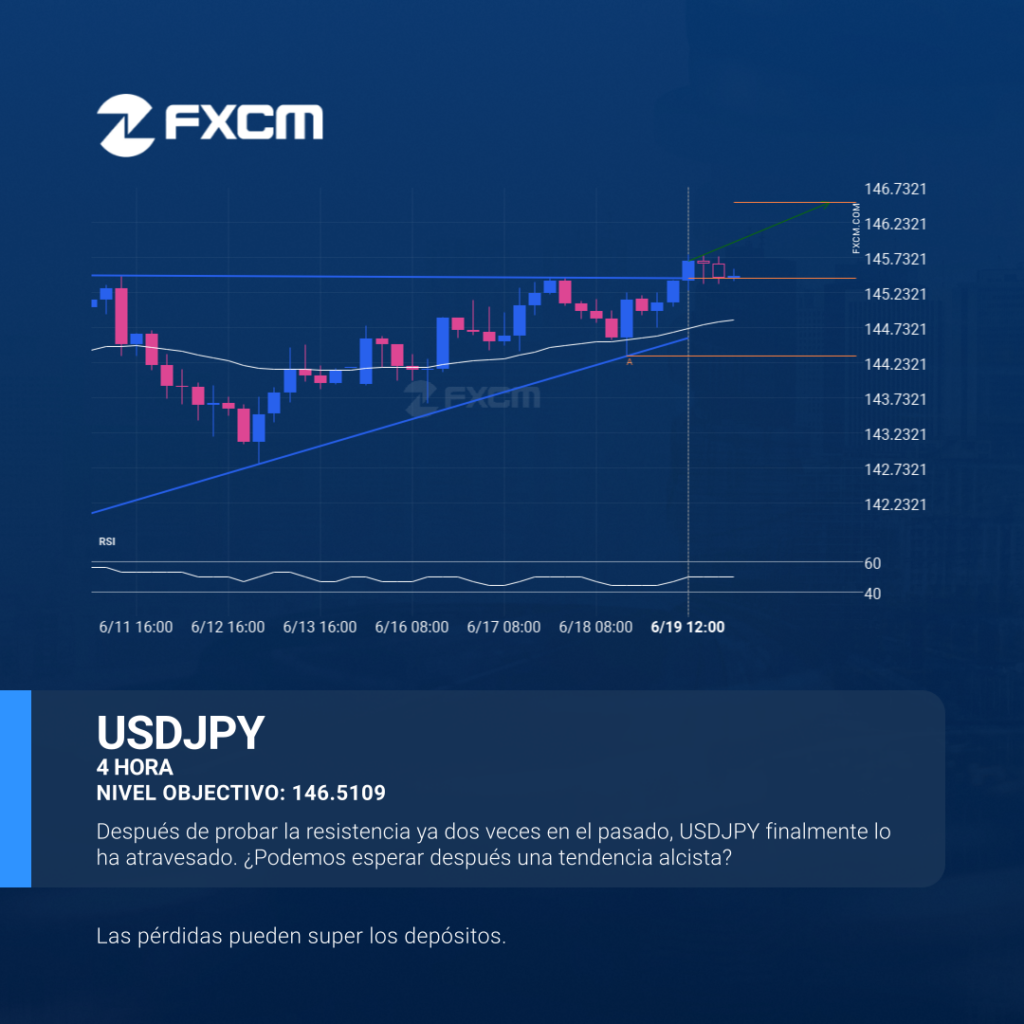
El USDJPY ha atravesado la línea de resistencia, que ya se ha probado dos veces en el pasado. Hemos visto, anteriormente, un retroceso desde esta posición, así que debemos esperar la confirmación de la ruptura antes de operar. Si esta nueva tendencia persiste, un nivel objetivo alrededor de 146.5109 podría materializarse dentro de las próximas […]
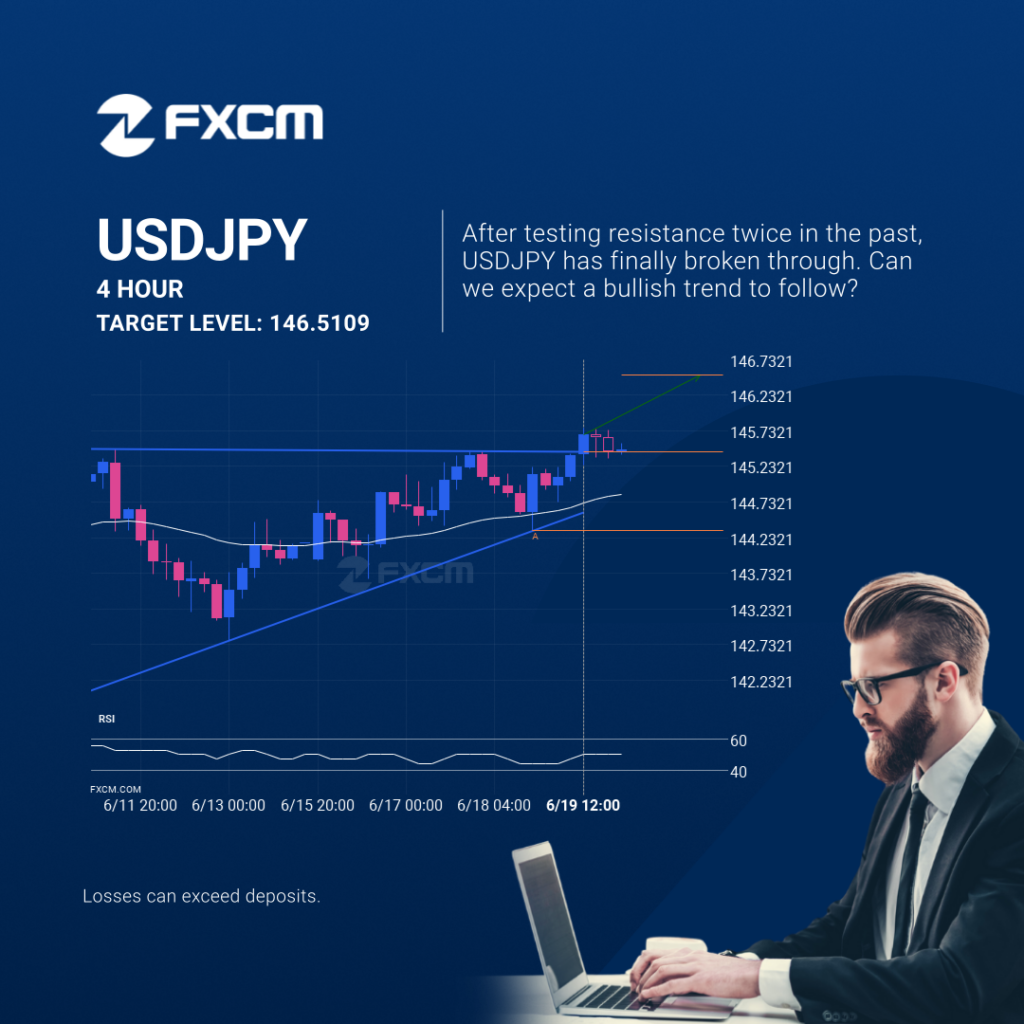
USDJPY trade outlook at 2025-06-19T10:00:00.000Z until 2025-06-19T10:00:00.000Z

USDJPY has broken through the resistance line which it has tested twice in the past. We have seen it retrace from this line before, so one should wait for confirmation of the breakout before trading. If this new trend persists, a target level of around 146.5109 may materialize within the next 2 days. Past performance […]
USDJPY trade outlook at 2025-06-19T10:00:00.000Z until 2025-06-19T10:00:00.000Z
USDJPY has broken through the resistance line which it has tested twice in the past. We have seen it retrace from this line before, so one should wait for confirmation of the breakout before trading. If this new trend persists, a target level of around 146.5109 may materialize within the next 2 days. Past performance […]
A potential bullish movement on EURJPY
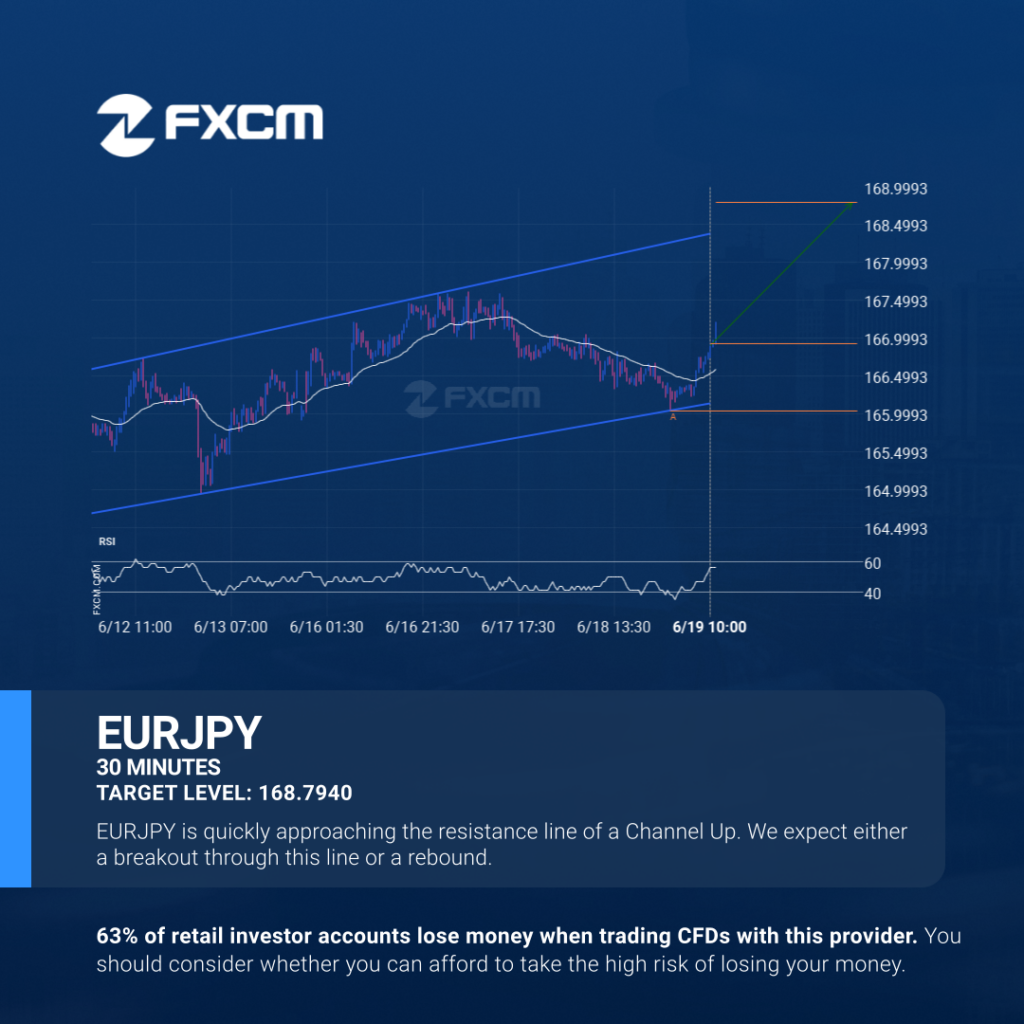
EURJPY was identified at around 166.925 having recently rebounded of the support on the 30 Minutes data interval. Ultimately, the price action of the stock has formed a Channel Up pattern. This squeeze may increases the chances of a strong breakout. The projected movement will potentially take the price to around the 168.7940 level. Past […]
Un posible movimiento alcista en EURJPY

Se identificó un patrón de Canal alcista en EURJPY en 166.925, lo que generó la expectativa de que podría moverse a la línea de resistencia en 168.7940. Puede atravesar esa línea y continuar la tendencia alcista o puede girarse desde esa línea. El rendimiento pasado no es indicativo de resultados futuros. Las pérdidas pueden exceder […]
Un posible impulso final en el BTCUSD
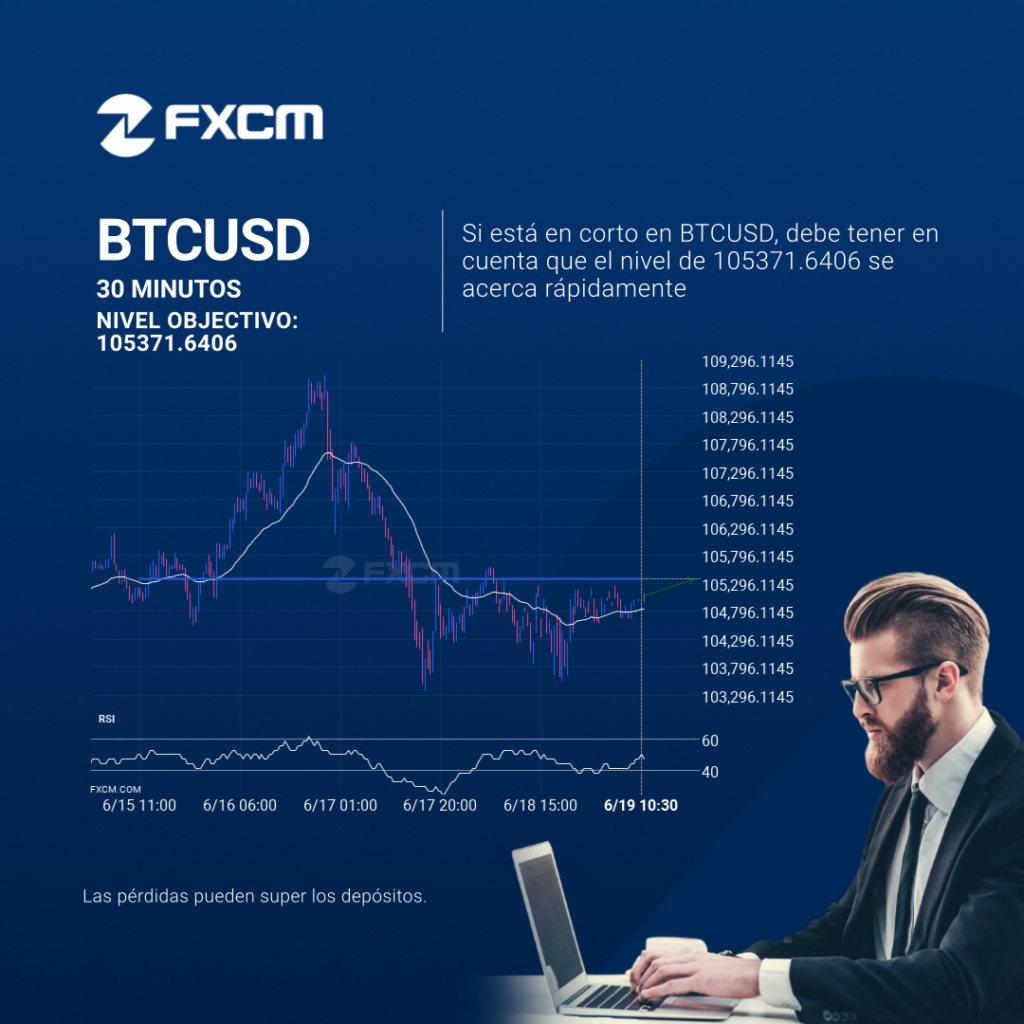
BTCUSD se está moviendo hacia un nivel clave de resistencia en 105371.6406. Este es un nivel que BTCUSD ya testeó previamente. Esta podría ser una buena oportunidad para operar, ya sea al precio actual o después de superar este nivel. El rendimiento pasado no es indicativo de resultados futuros. Las pérdidas pueden exceder los fondos […]