ESP35 approaching resistance of a Triangle
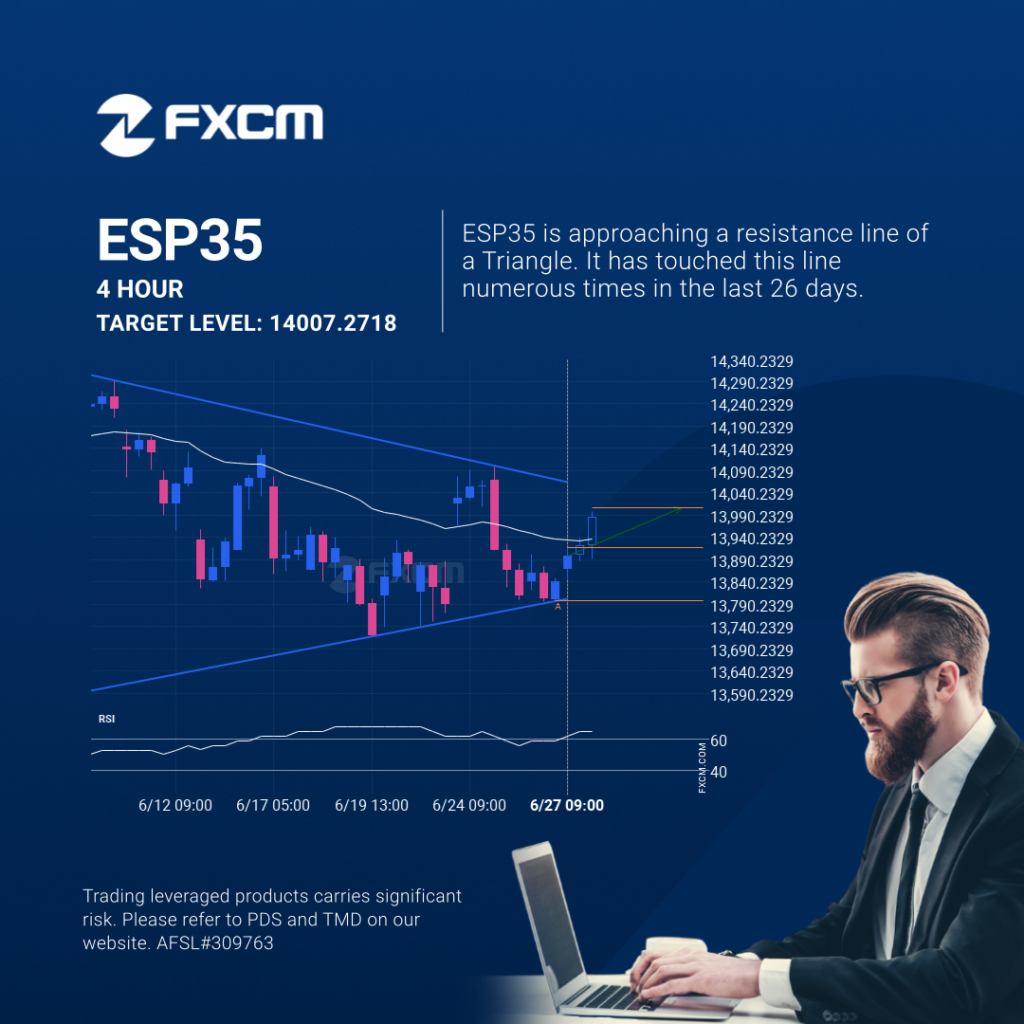
An emerging Triangle has been detected on ESP35 on the 4 hour chart. There is a possible move towards 14007.2718 next few candles. Once reaching support it may continue its bullish run or reverse back to current price levels. Past performance is not an indicator of future results. Trading leveraged products carries significant risk. Please […]
ESP35 approaching resistance of a Triangle
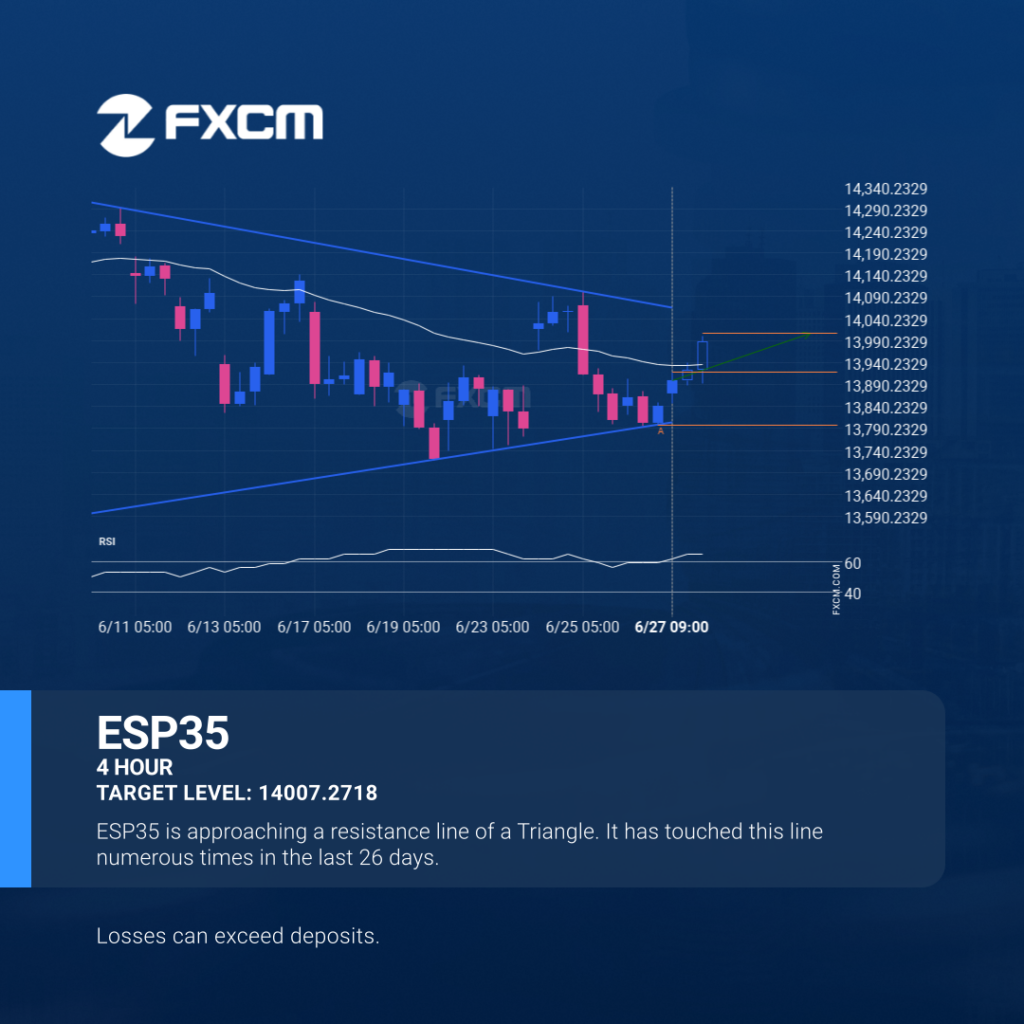
An emerging Triangle has been detected on ESP35 on the 4 hour chart. There is a possible move towards 14007.2718 next few candles. Once reaching support it may continue its bullish run or reverse back to current price levels. Past performance is not an indicator of future results. Losses can exceed deposits.
El ESP35 se aproxima a la resistencia de un Triángulo
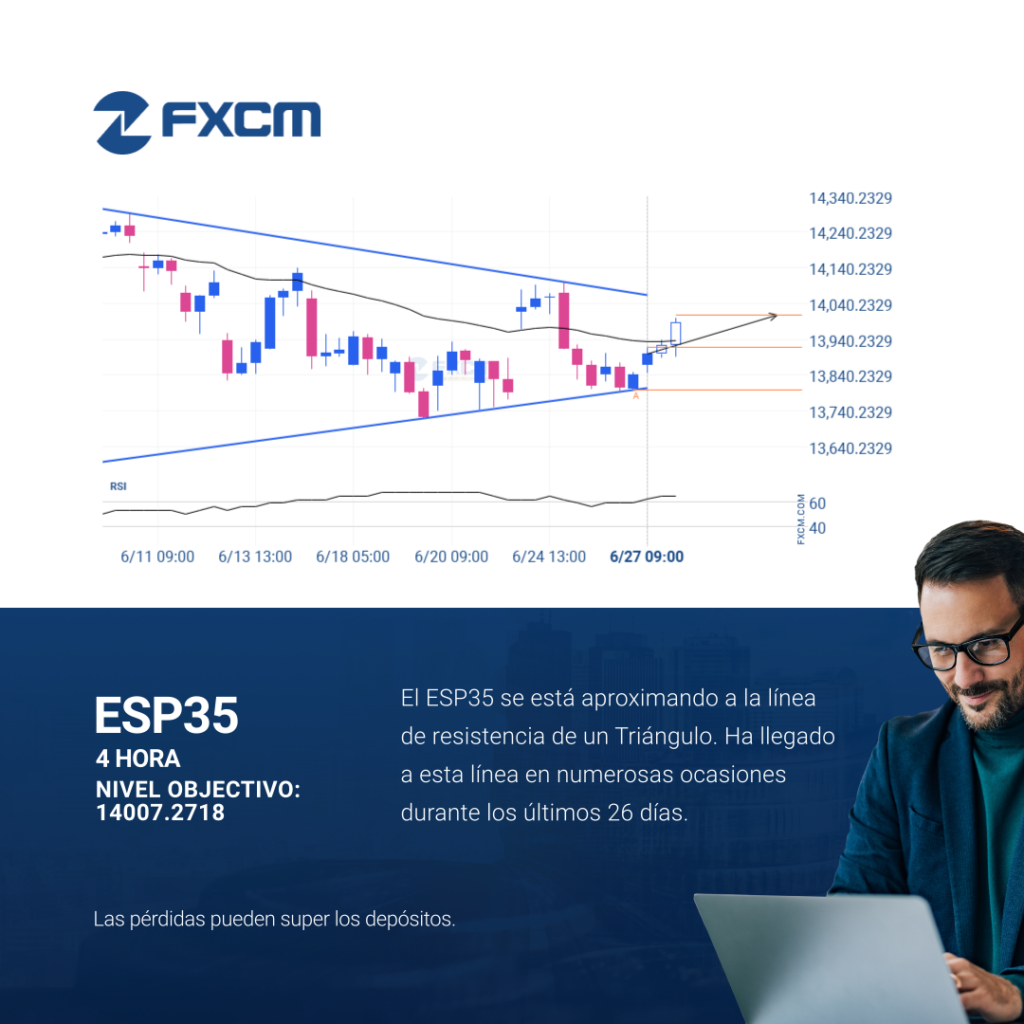
Se ha detectado un patrón Triángulo en formación en ESP35 en el gráfico de 4 Hora. Existe la posibilidad de un movimiento hacia 14007.2718 en las próximas velas. Una vez que alcance support, el precio puede continuar su tendencia alcista o revertir a los niveles actuales de precio. El rendimiento pasado no es indicativo de […]
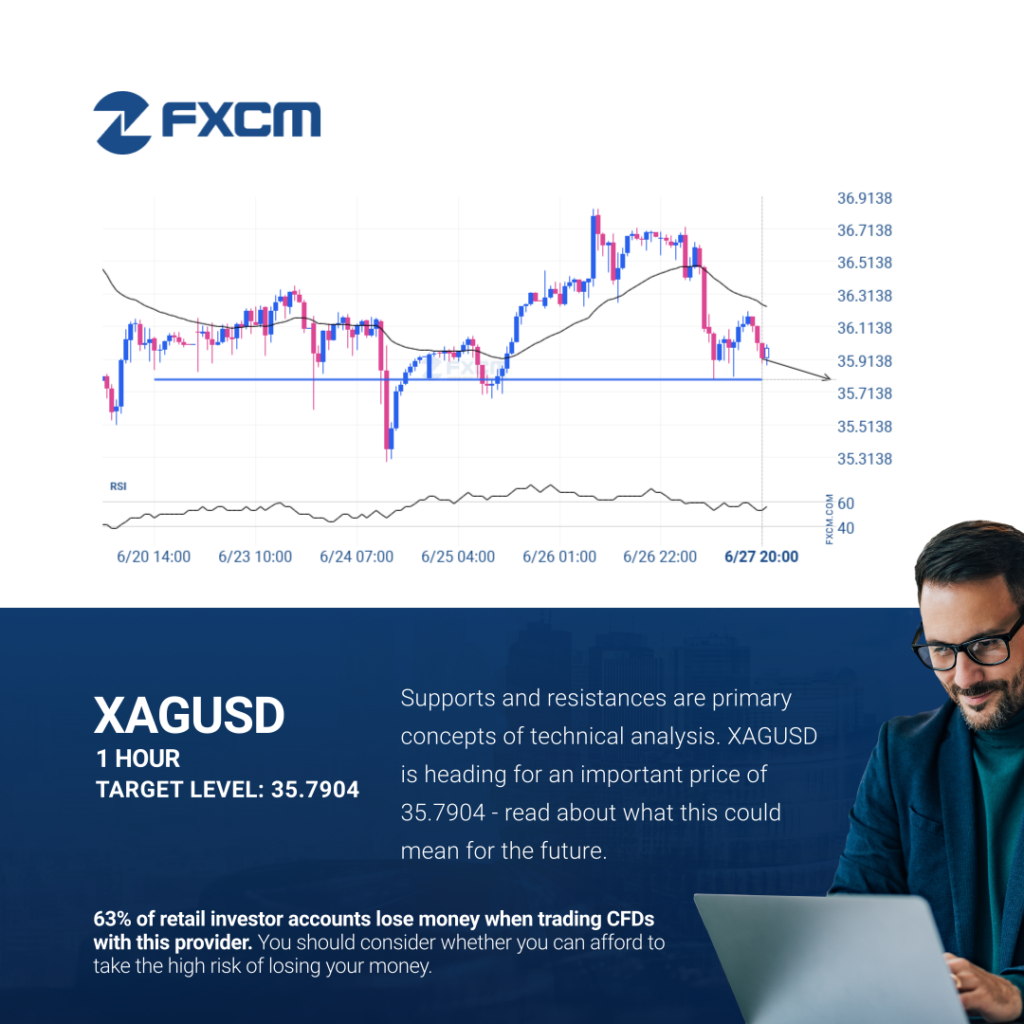
Breach of important price line imminent by XAGUSD
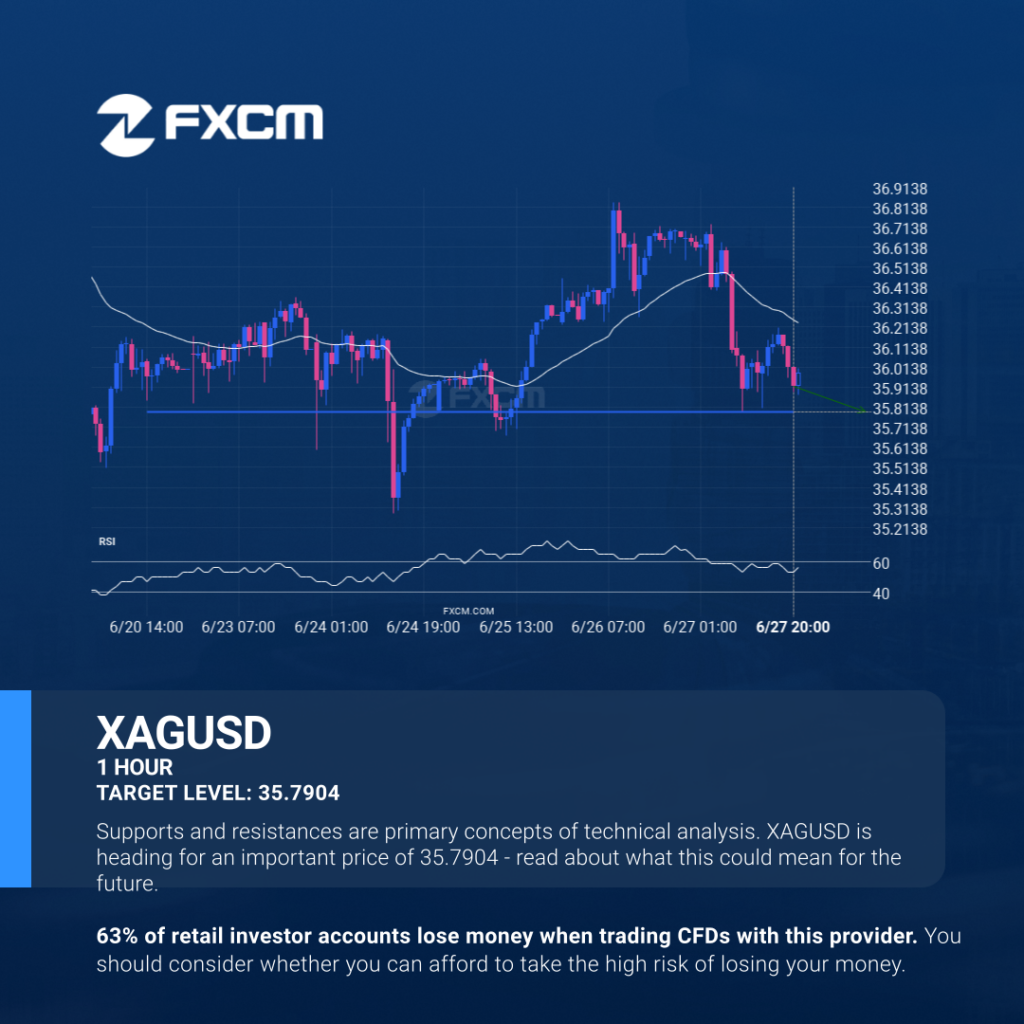
XAGUSD is moving towards a key support level at 35.7904. XAGUSD has previously tested this level 4 times and on each occasion it has bounced back off this level. Is this finally the time it will break through? Past performance is not an indicator of future results. Trading leveraged products carries significant risk. Please refer […]
Inminente irrupción de una importante línea de precio del XAGUSD
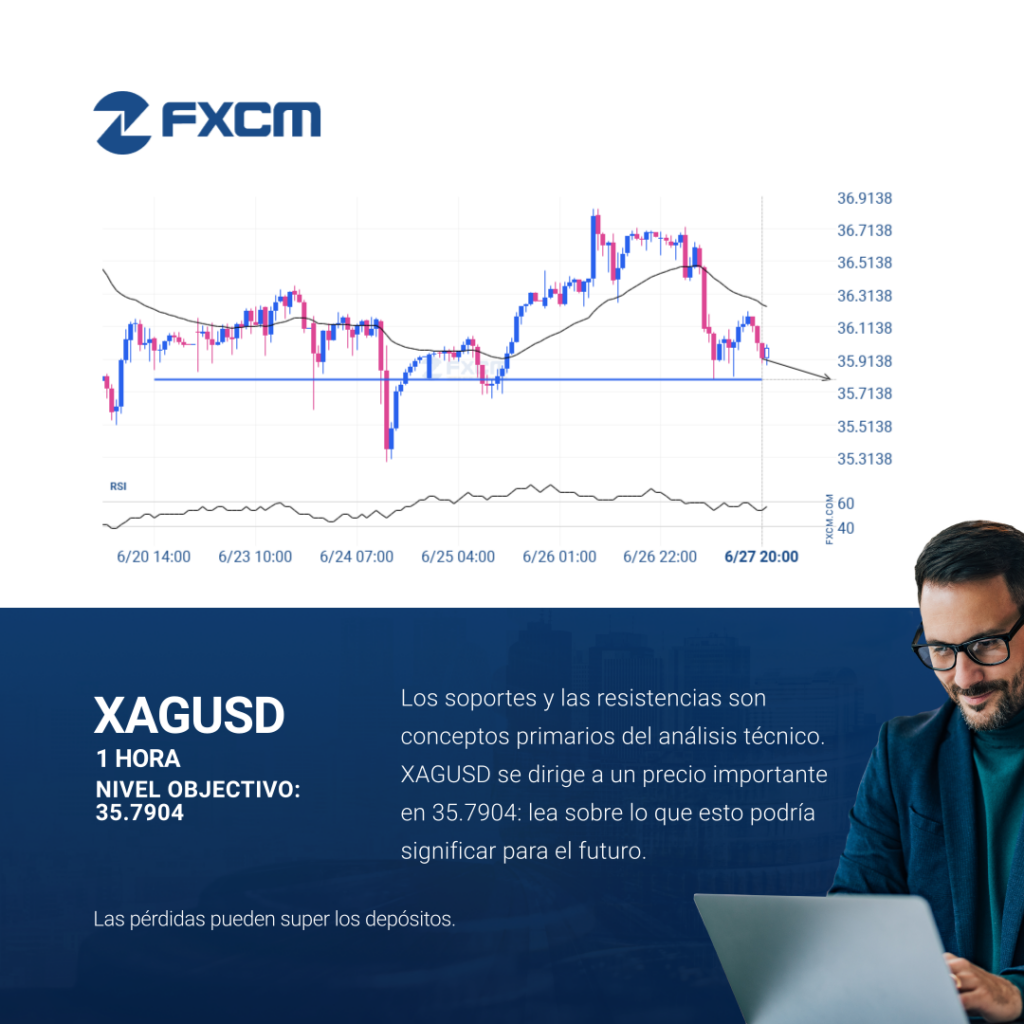
XAGUSD se está moviendo hacia un nivel clave de soporte en 35.7904. XAGUSD testeó previamente este nivel 4 veces y en cada ocasión rebotó en este nivel. ¿Ha llegado finalmente el momento de la rotura? El rendimiento pasado no es indicativo de resultados futuros. Las pérdidas pueden exceder los fondos depositados.
Breach of important price line imminent by XAGUSD
XAGUSD is moving towards a key support level at 35.7904. XAGUSD has previously tested this level 4 times and on each occasion it has bounced back off this level. Is this finally the time it will break through? Past performance is not an indicator of future results. Trading leveraged products carries significant risk. Please refer […]
BTCUSD se acerca a un nivel importante en 106394.7500
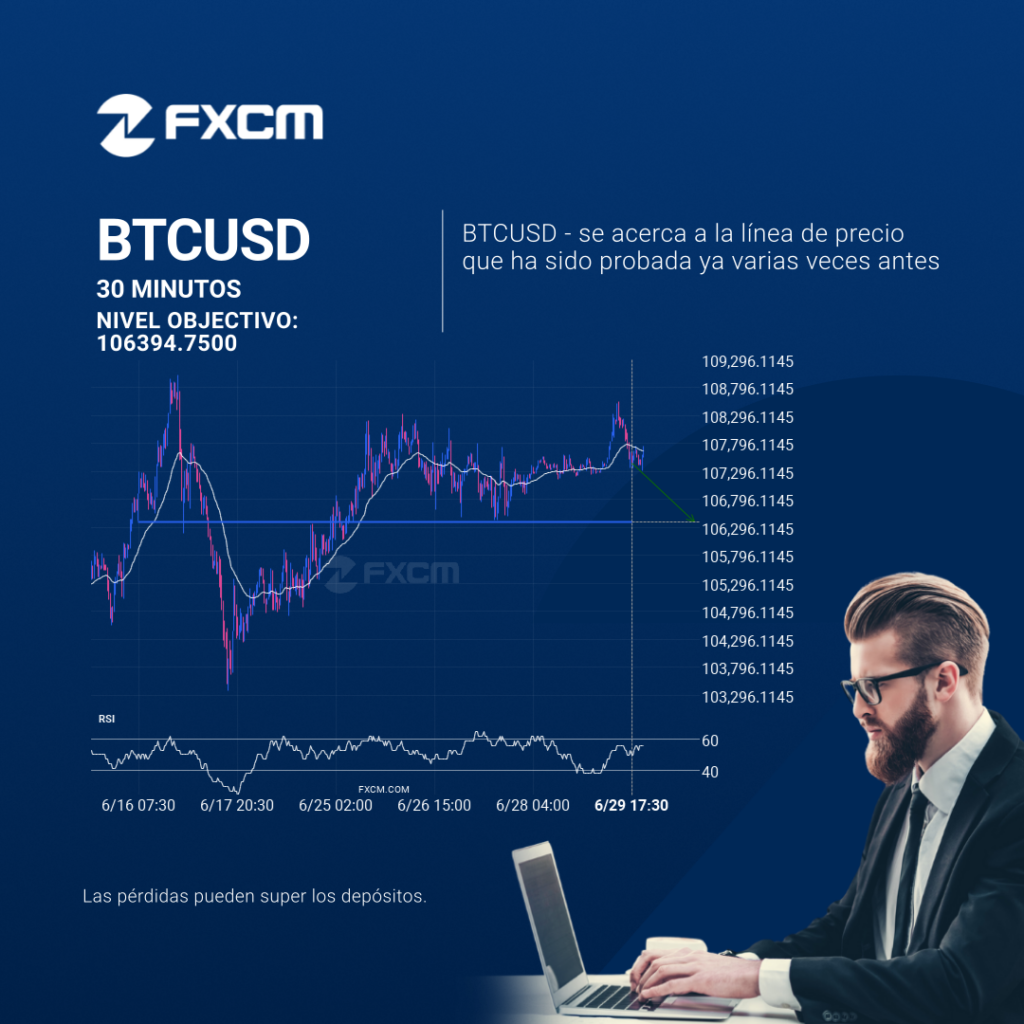
El movimiento del BTCUSD hacia la línea de precio 106394.7500 es otra prueba más de la línea que ha alcanzado en numerosas ocasiones durante el pasado. Podríamos esperar que esta prueba ocurra en las próximas 2 días, pero no sabemos si dará como resultado una irrupción a través de esta línea o simplemente una recuperación […]
Breach of important price line imminent by XAGUSD

XAGUSD is moving towards a key support level at 35.7904. XAGUSD has previously tested this level 4 times and on each occasion it has bounced back off this level. Is this finally the time it will break through? Past performance is not an indicator of future results. Losses can exceed deposits.
Will HKG33 have enough momentum to break support?
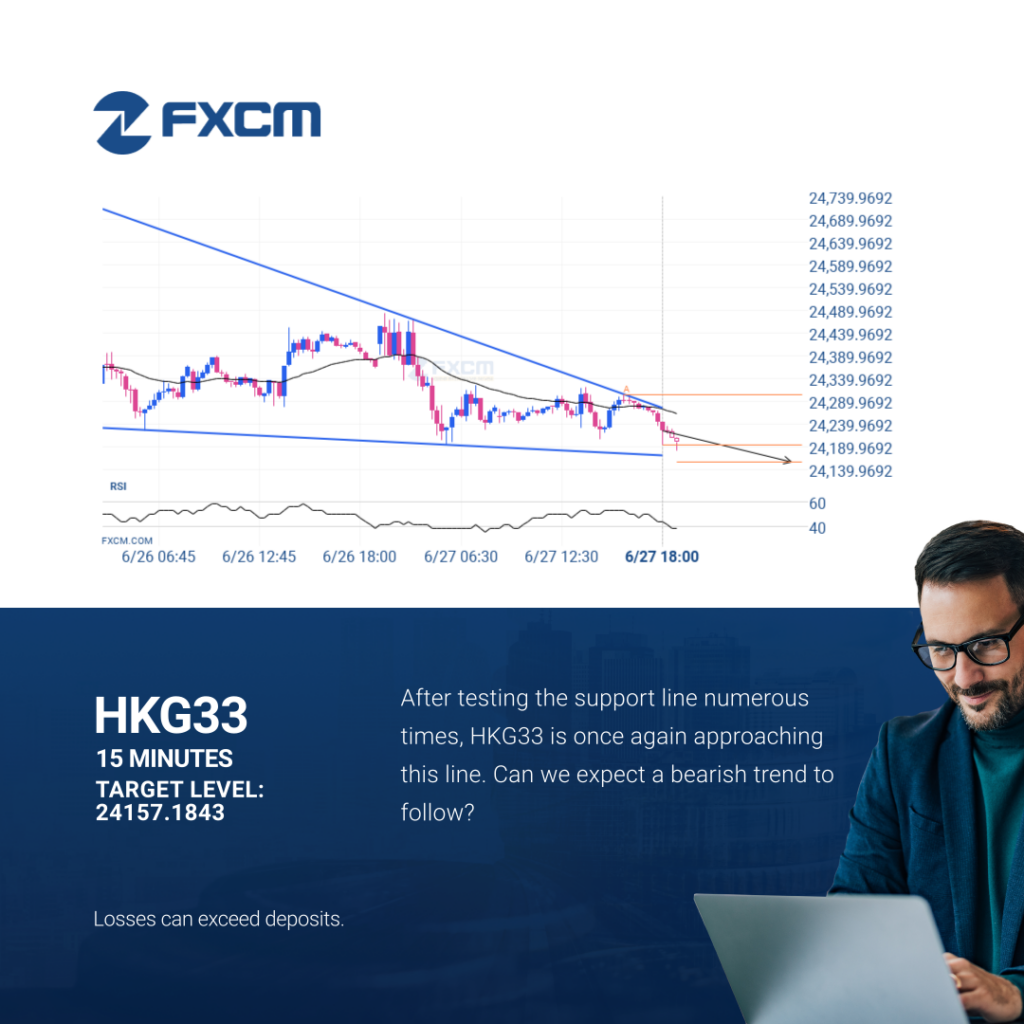
HKG33 is approaching the support line of a Falling Wedge. It has touched this line numerous times in the last 3 days. If it tests this line again, it should do so in the next 8 hours. Past performance is not an indicator of future results. Losses can exceed deposits.
¿Tendrá el HKG33 suficiente impulso como para irrumpir el soporte?
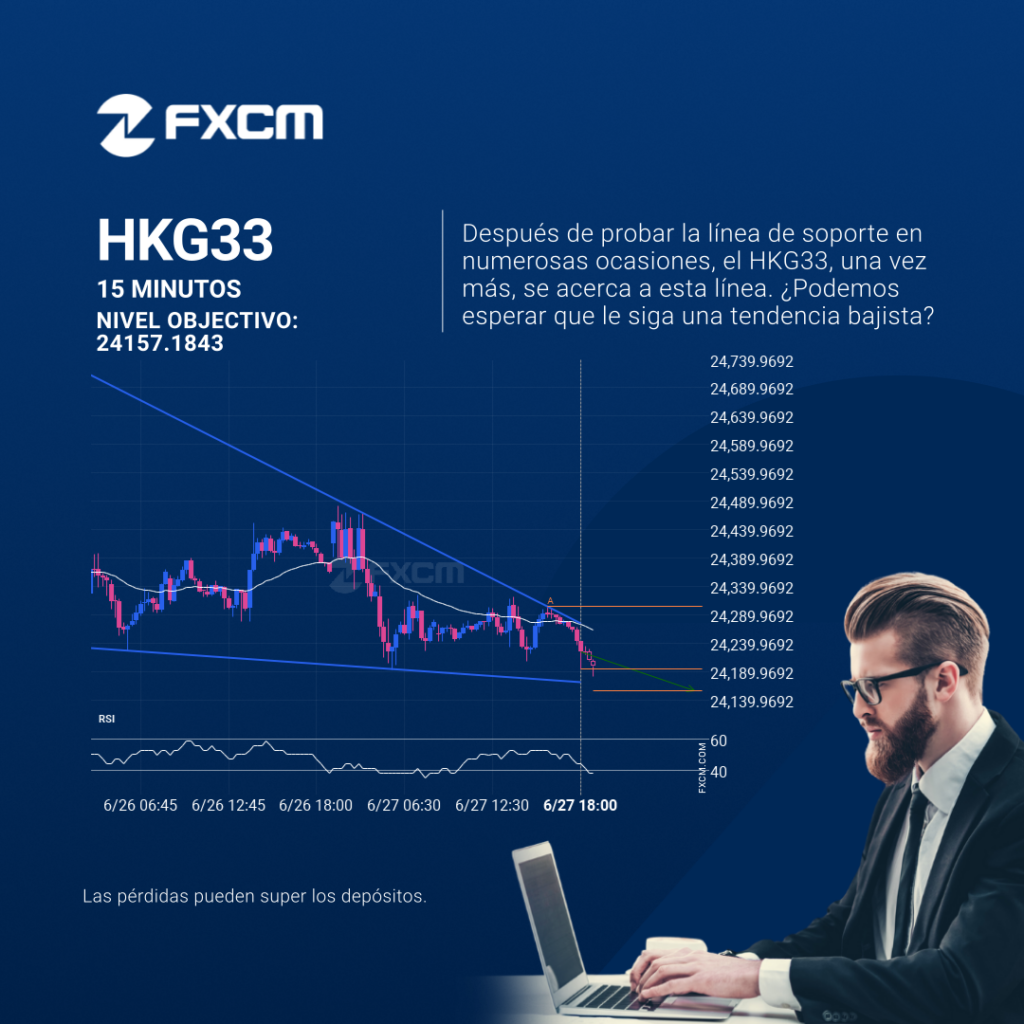
El HKG33 se está acercando a la línea de soporte de un Cuña descendente. Ha llegado a esta línea en numerosas ocasiones durante los últimos 3 días. Si vuelve a probarla de nuevo, debería hacerlo en las próximas 8 horas. El rendimiento pasado no es indicativo de resultados futuros. Las pérdidas pueden exceder los fondos […]