Patrón técnico bajista en EURJPY 1 Hora
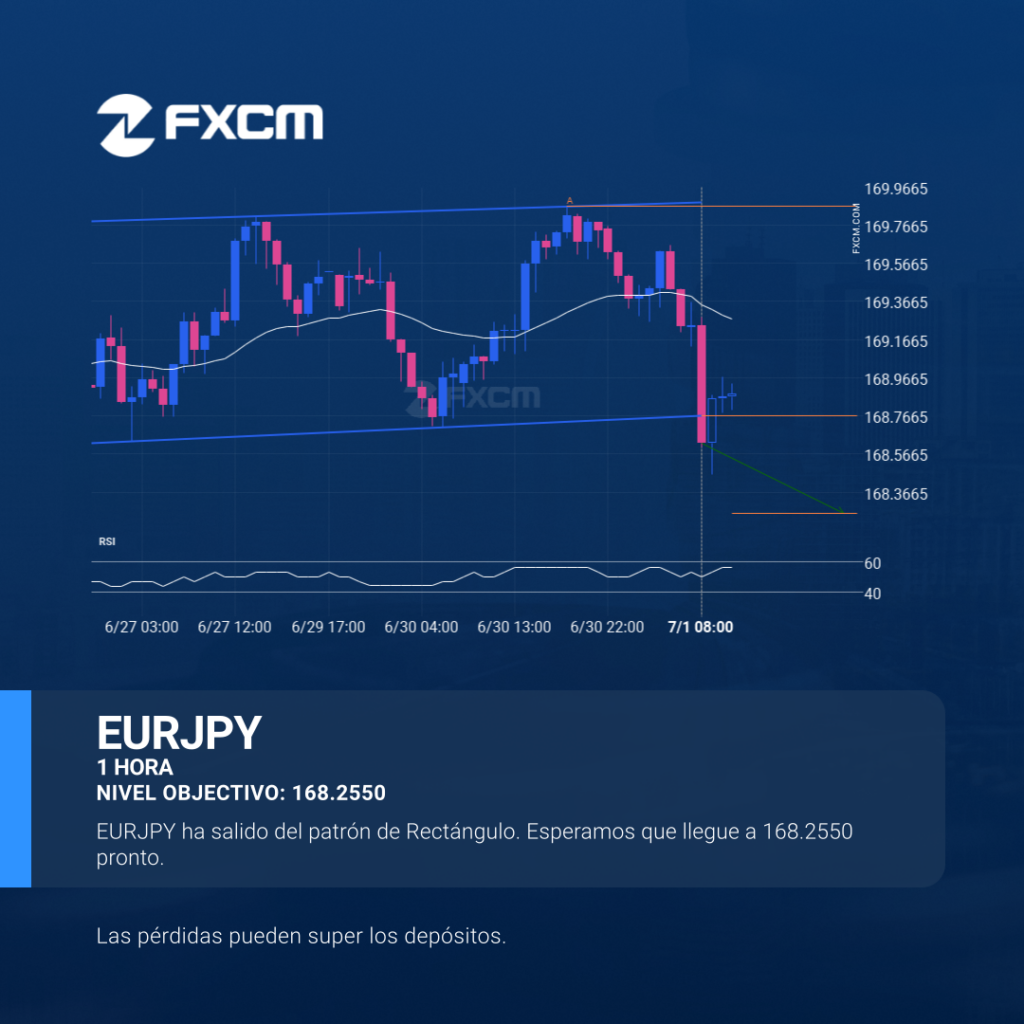
El EURJPY ha atravesado la línea de soporte, que ya se ha probado dos veces en el pasado. Hemos visto, anteriormente, un retroceso desde esta posición, así que debemos esperar la confirmación de la ruptura antes de operar. Si esta nueva tendencia persiste, un nivel objetivo alrededor de 168.2550 podría materializarse dentro de las próximas […]
bearish technical pattern on EURJPY 1 hour
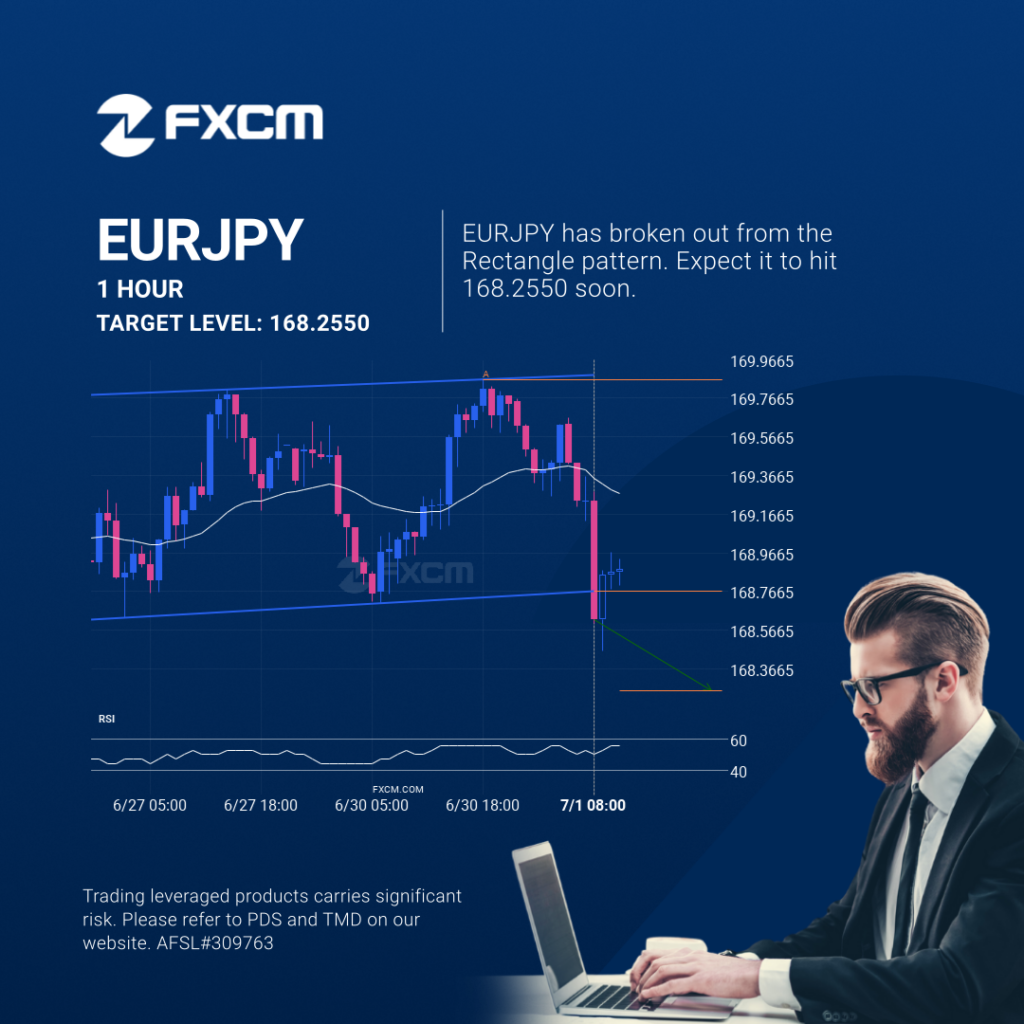
EURJPY has broken through the support line which it has tested twice in the past. We have seen it retrace from this line before, so one should wait for confirmation of the breakout before trading. If this new trend persists, a target level of around 168.2550 may materialize within the next 14 hours. Past performance […]
Should we expect a breakout or a rebound on ESP35?
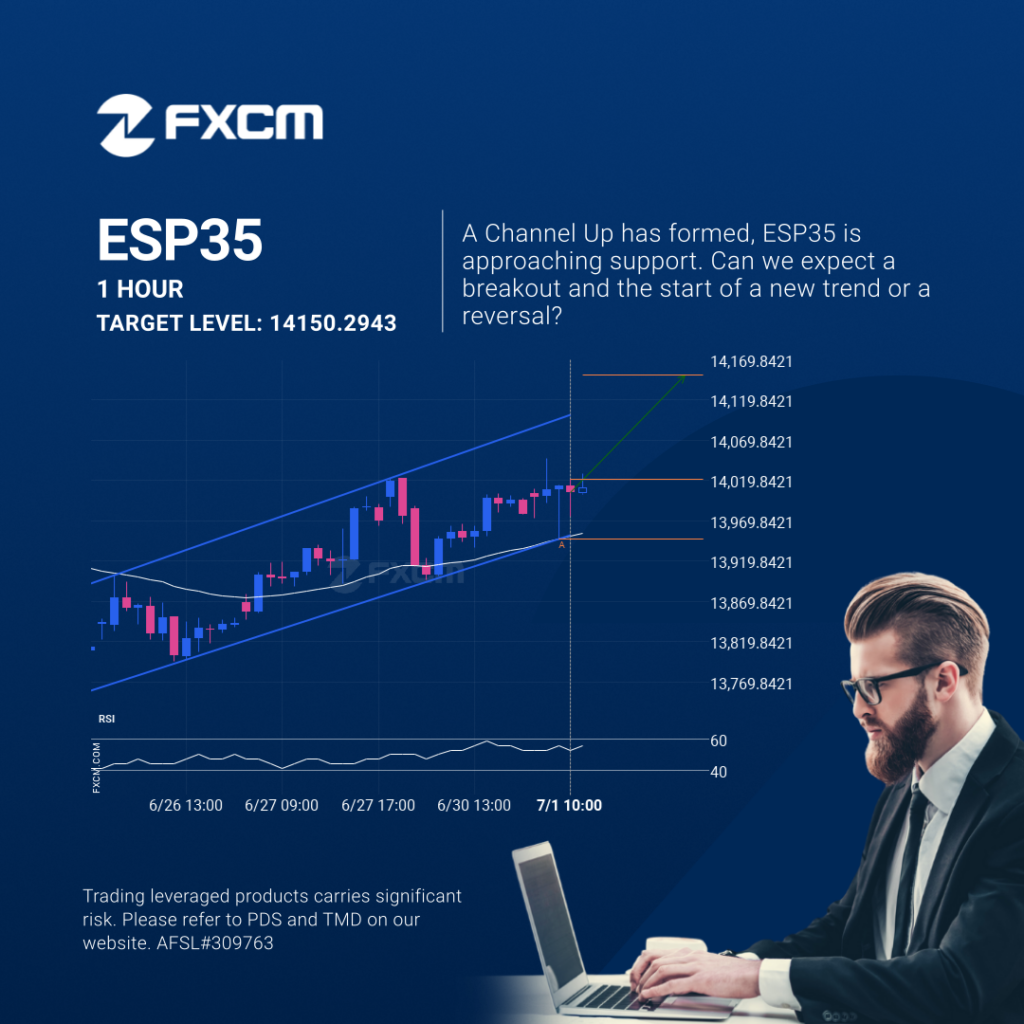
ESP35 is heading towards the resistance line of a Channel Up and could reach this point within the next 11 hours. It has tested this line numerous times in the past, and this time could be no different from the past, ending in a rebound instead of a breakout. If the breakout doesn’t happen, we […]
bearish technical pattern on EURJPY 1 hour

EURJPY has broken through the support line which it has tested twice in the past. We have seen it retrace from this line before, so one should wait for confirmation of the breakout before trading. If this new trend persists, a target level of around 168.2550 may materialize within the next 14 hours. Past performance […]
Should we expect a breakout or a rebound on ESP35?
ESP35 is heading towards the resistance line of a Channel Up and could reach this point within the next 11 hours. It has tested this line numerous times in the past, and this time could be no different from the past, ending in a rebound instead of a breakout. If the breakout doesn’t happen, we […]
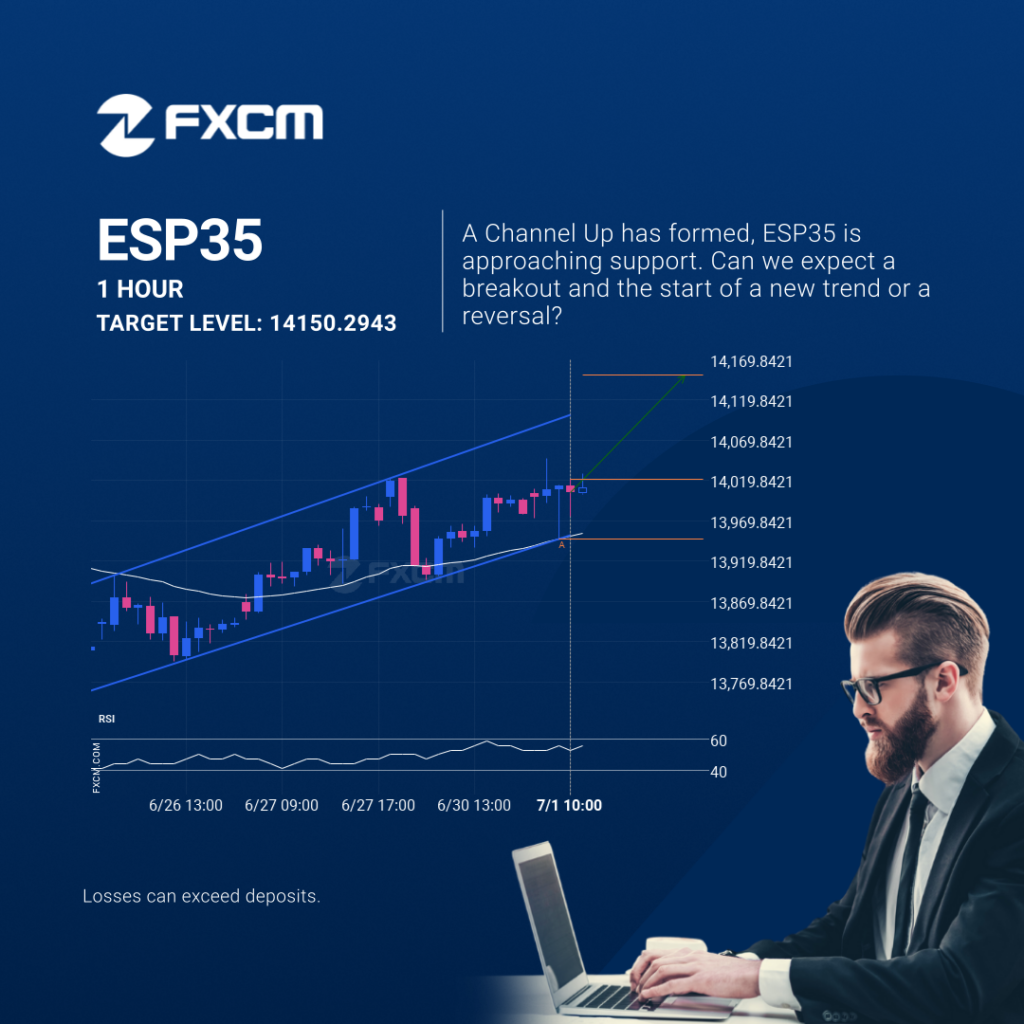
¿Deberíamos esperar una ruptura o una recuperación del ESP35?
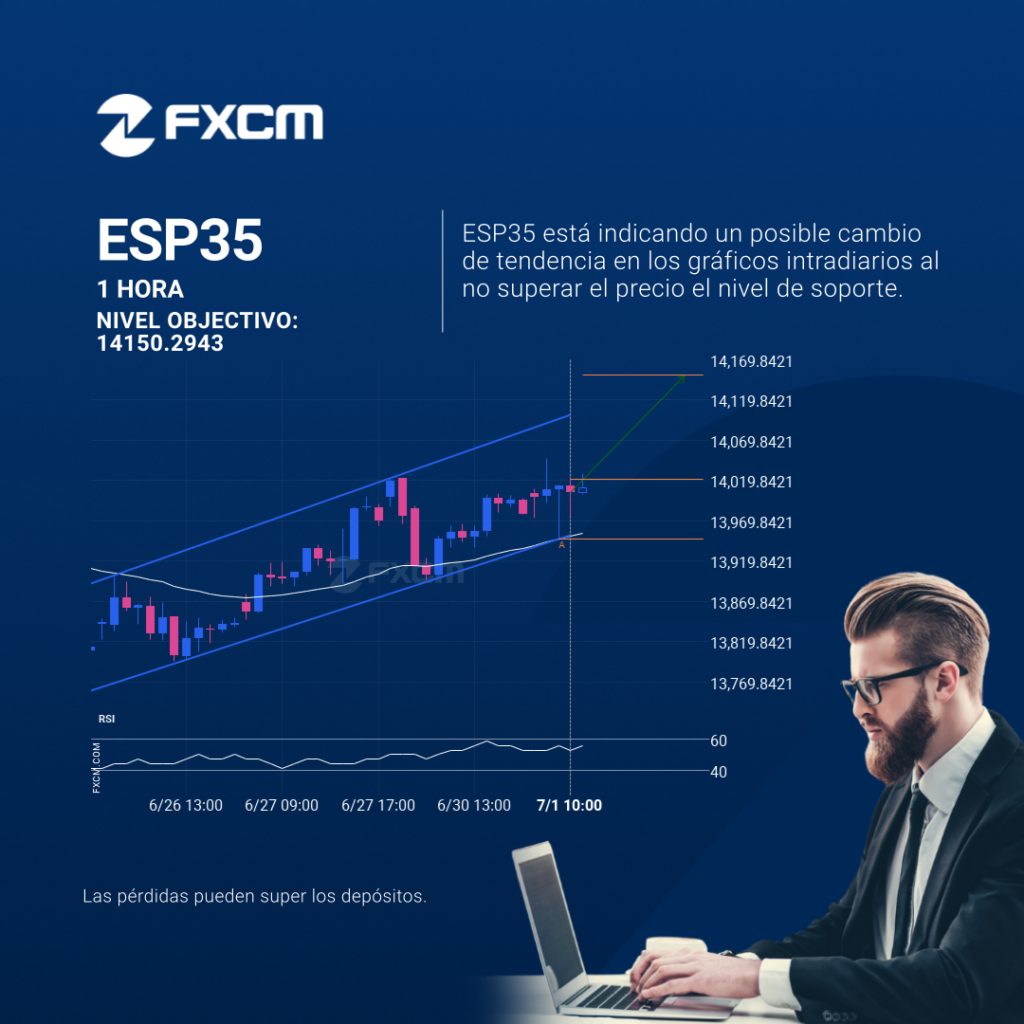
El ESP35 se dirige hacia la línea de resistencia de un Canal alcista y puede alcanzar este punto en las próximas 11 horas. Ha probado esta línea ya en numerosas ocasiones en el pasado, y esta vez no tendría porqué ser diferente y terminar con una recuperación en lugar de una irrupción. Si ésta última […]
Should we expect a breakout or a rebound on AUDUSD?
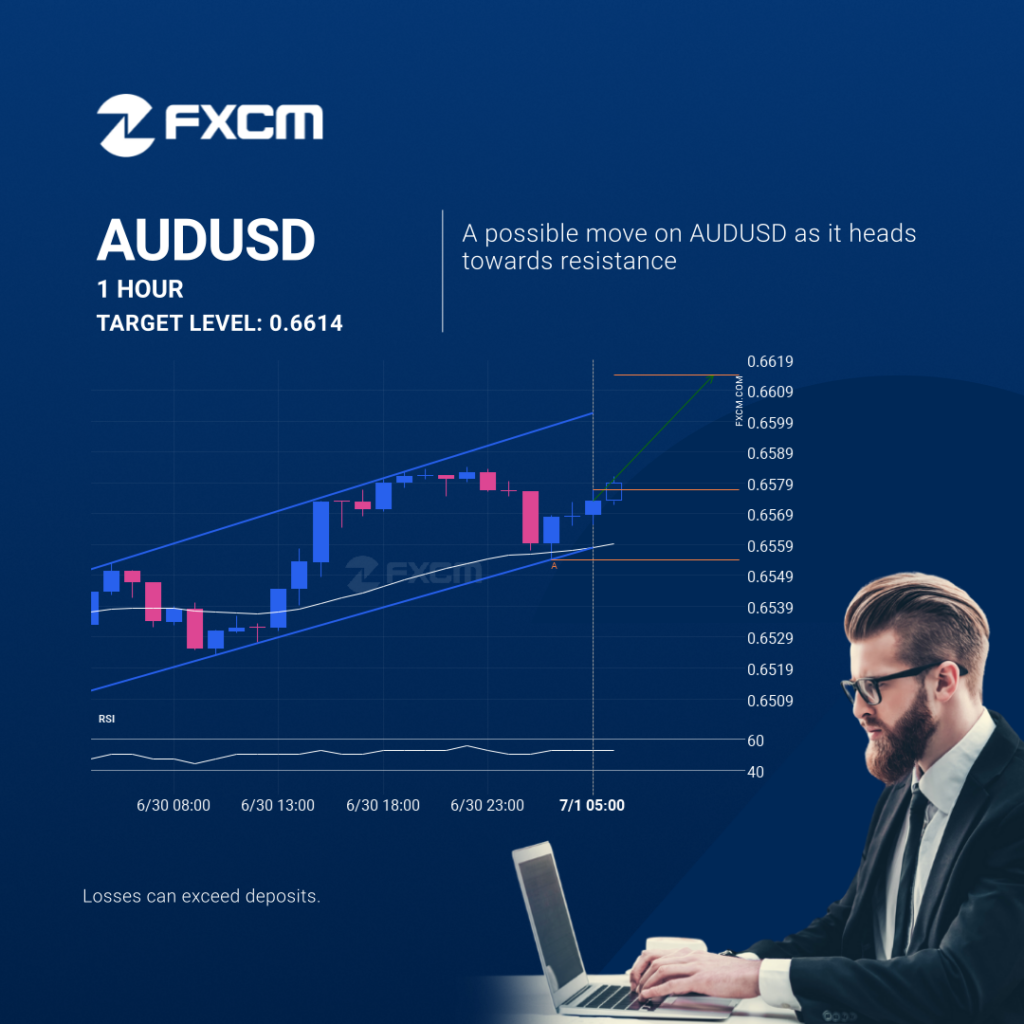
AUDUSD is heading towards the resistance line of a Channel Up and could reach this point within the next 6 hours. It has tested this line numerous times in the past, and this time could be no different from the past, ending in a rebound instead of a breakout. If the breakout doesn’t happen, we […]
Un posible comienzo de una tendencia alcista en el HKG33
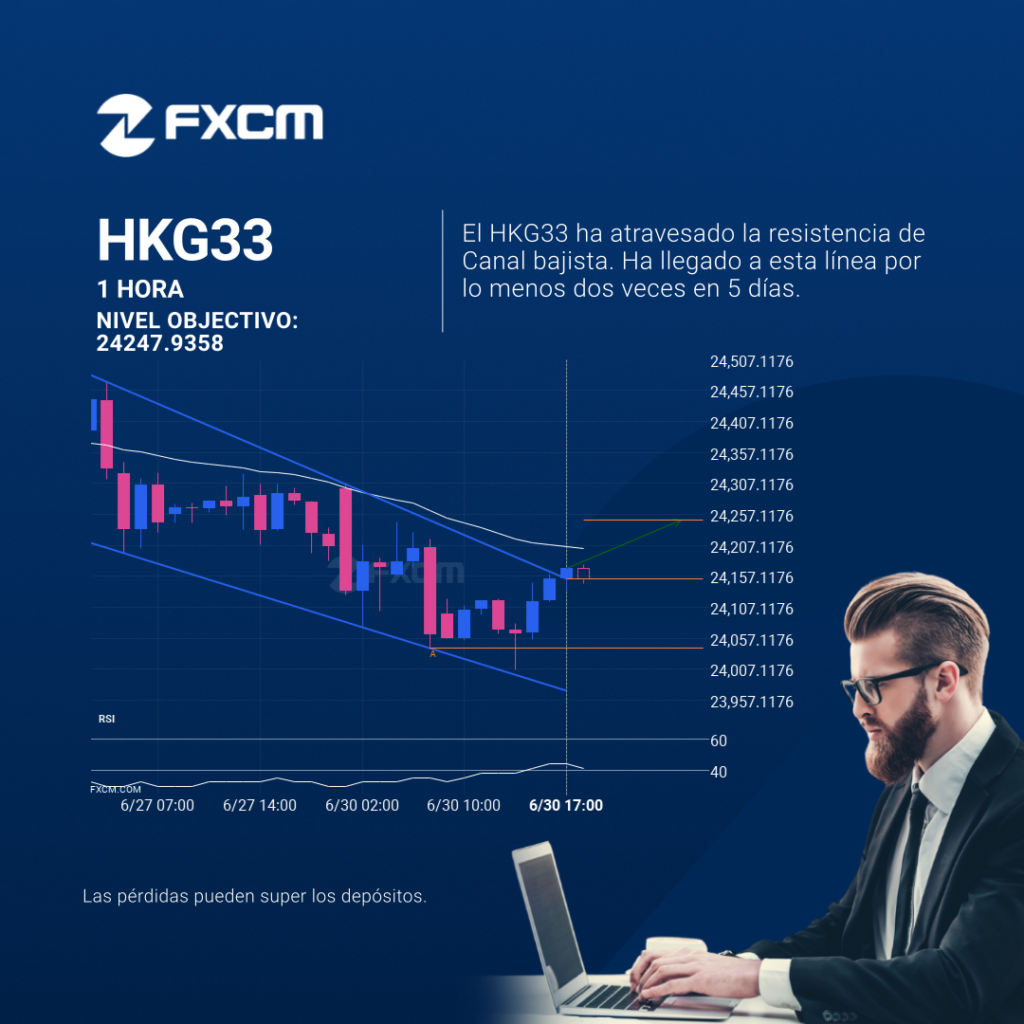
La irrupción del HKG33 a través de la línea de resistencia de un Canal bajista podría ser una señal de la ruta a seguir. Si esta irrupción persiste, podríamos ver el HKG33 probando el nivel de 24247.9358 dentro de las próximas 6 horas. El rendimiento pasado no es indicativo de resultados futuros. Las pérdidas pueden […]
EURGBP: línea de resistencia rota a las 2025-06-30T17:00:00.000Z
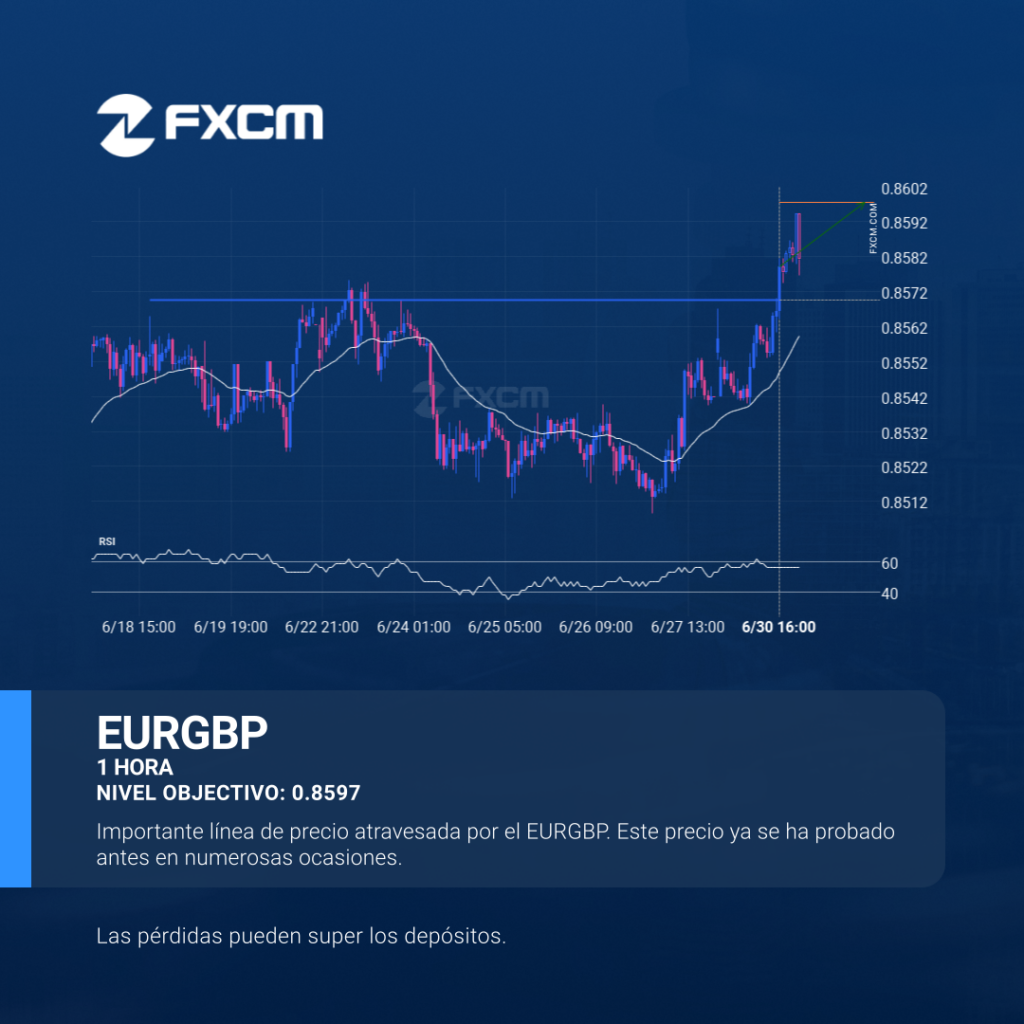
El EURGBP ha atravesado una línea de 0.8569. Si esta rotura se mantiene, podríamos ver el precio del EURGBP dirigiéndose al nivel de 0.8597 en las próximas 2 días. Pero no debe apresurarse a la hora de operar, porque ya ha probado esta línea en numerosas ocasiones durante el pasado, por lo que probablemente debería […]
BTCUSD – Patrón de gráfico Continuation – Canal alcista
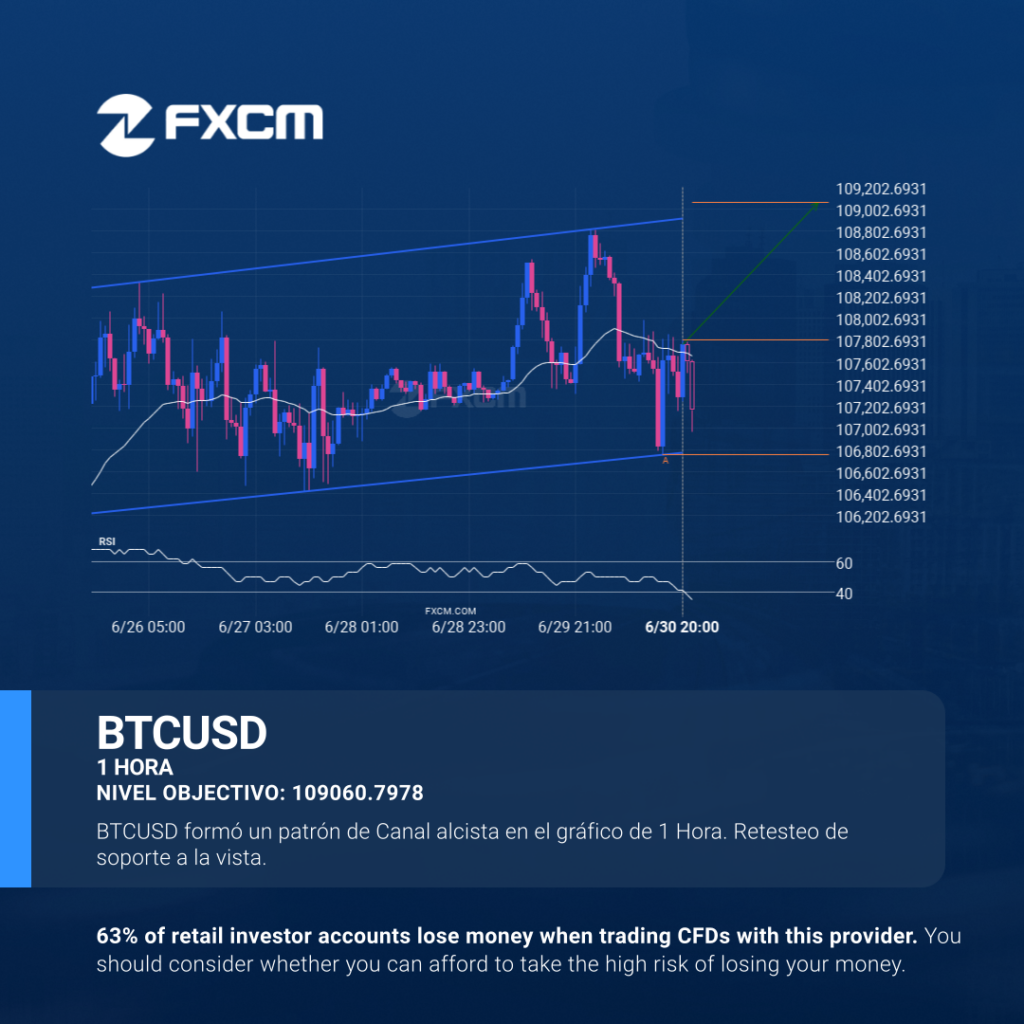
Se ha detectado un patrón Canal alcista en formación en BTCUSD en el gráfico de 1 Hora. Existe la posibilidad de un movimiento hacia 109060.7978 en las próximas velas. Una vez que alcance support, el precio puede continuar su tendencia alcista o revertir a los niveles actuales de precio. El rendimiento pasado no es indicativo […]