USDCAD is showing a upward streak.
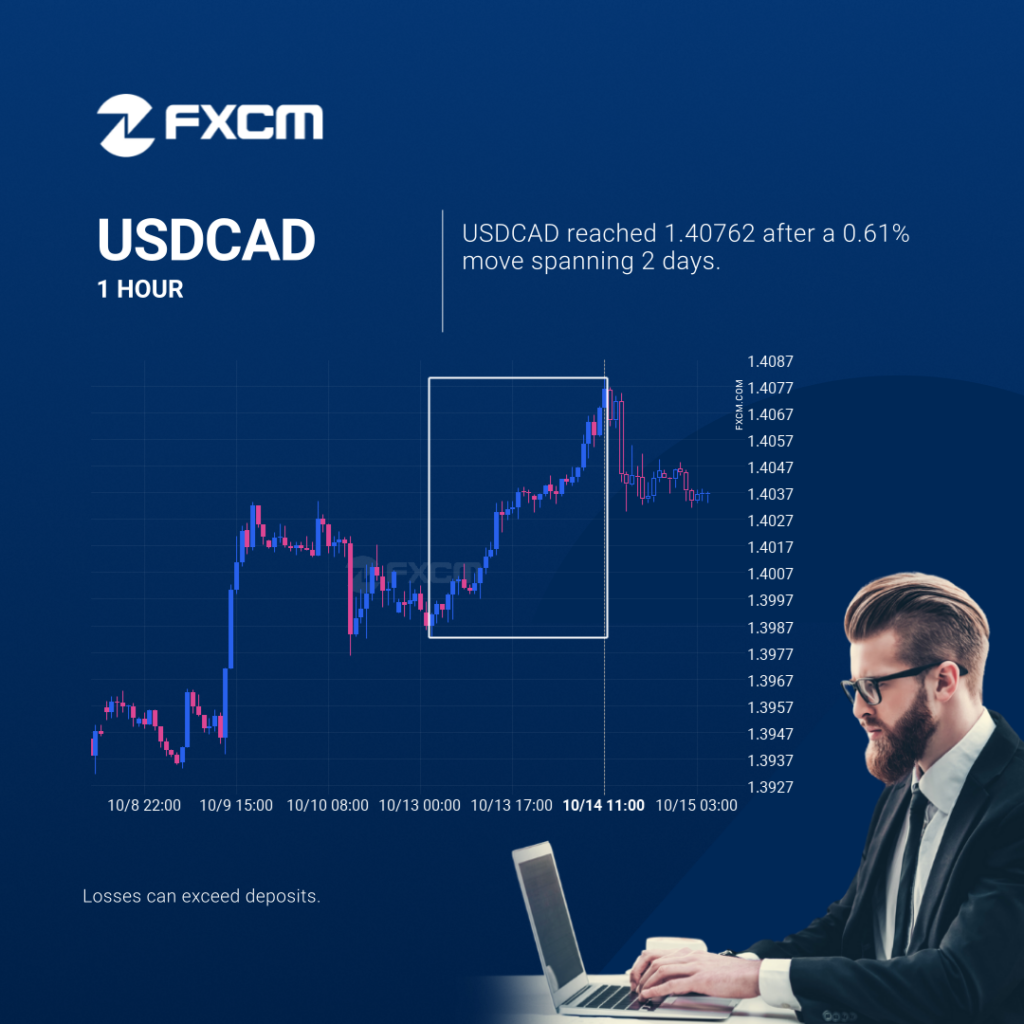
USDCAD just posted a 0.61% move over the past 2 days – a move that won’t go unnoticed by any trading style. Past performance is not an indicator of future results. Losses can exceed deposits.
USDCAD muestra una racha alcista.
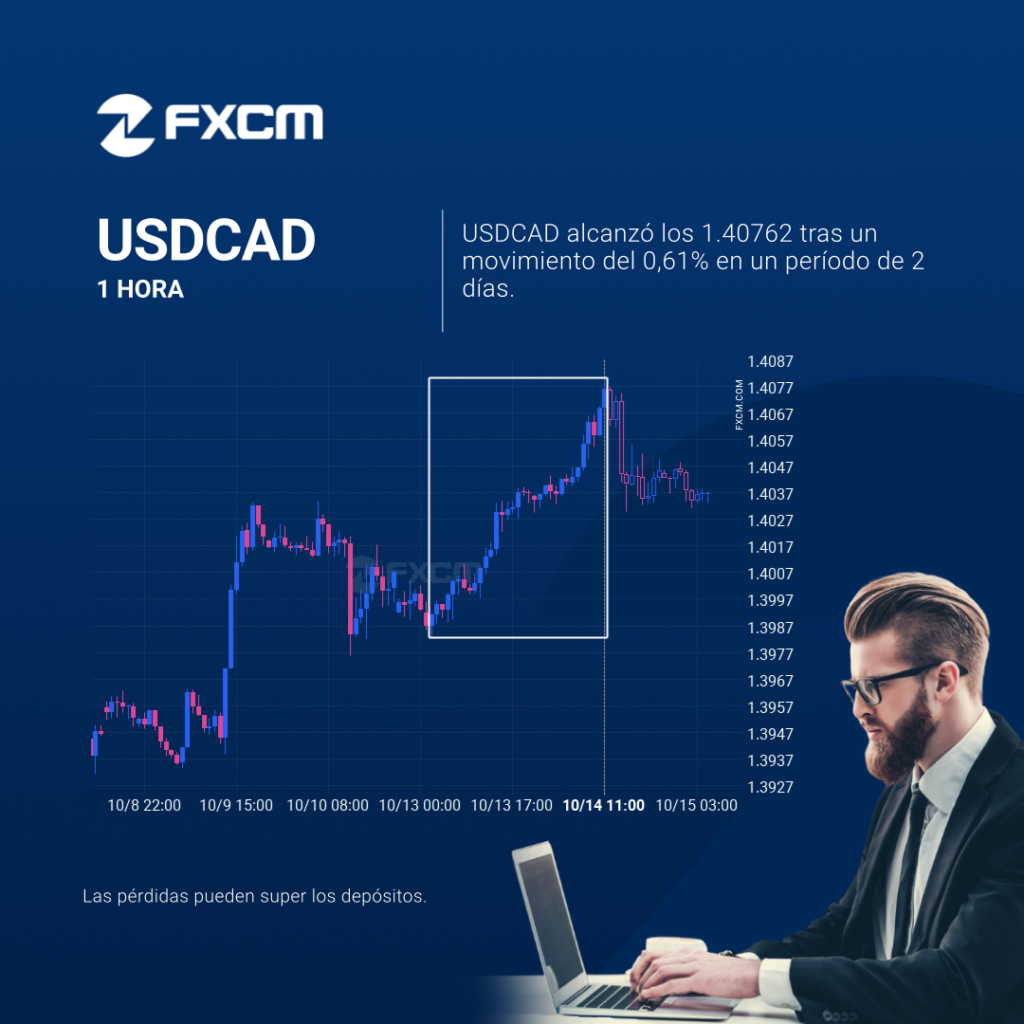
USDCAD acaba de registrar un movimiento del 0,61% en los últimos 2 días: un movimiento que no pasa desapercibido para ningún tipo de estrategia. El rendimiento pasado no es indicativo de resultados futuros. Las pérdidas pueden exceder los fondos depositados.
EURGBP running upward.
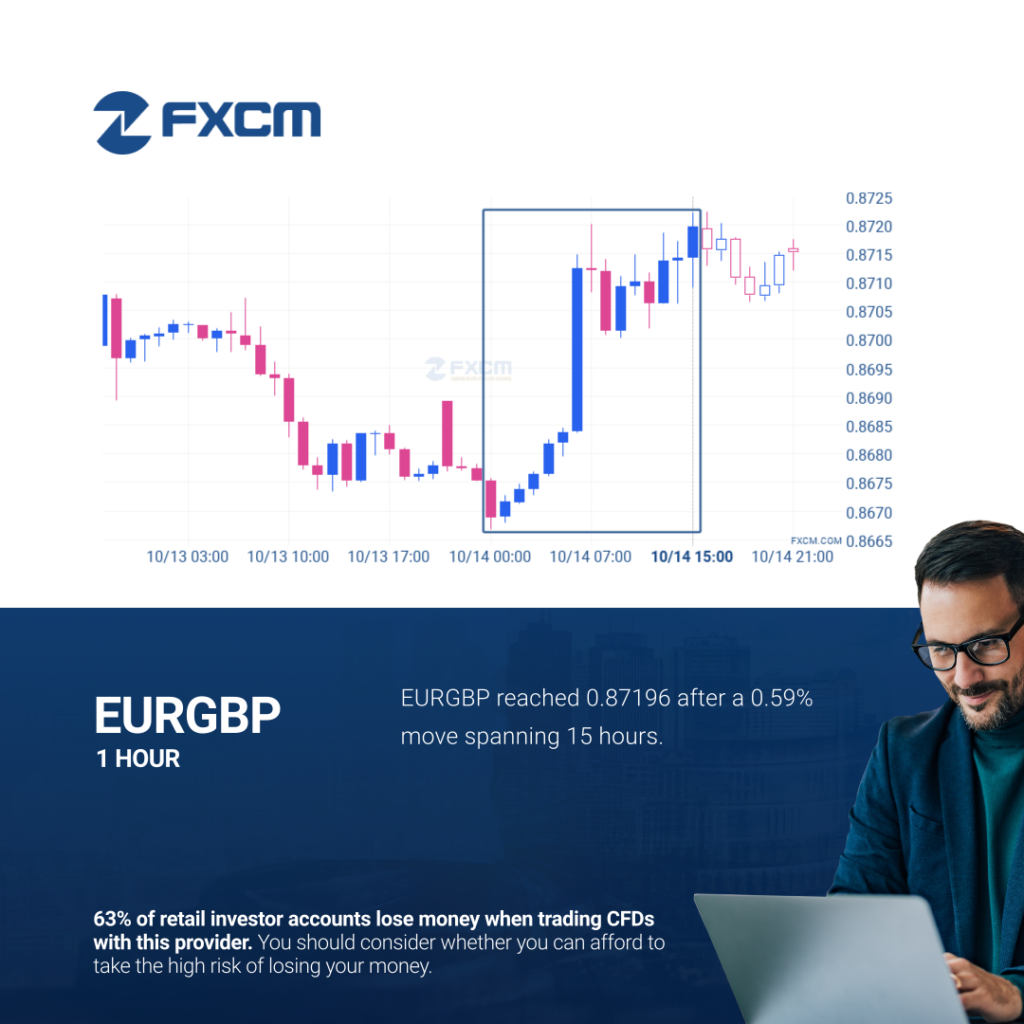
An unexpected large move occurred on EURGBP 1 hour chart, starting at 0.86688 and reaching 0.87196. It stands out in recent trading activity. Past performance is not an indicator of future results. Trading leveraged products carries significant risk. Please refer to PDS and TMD on our website. AFSL#309763
EURGBP running upward.
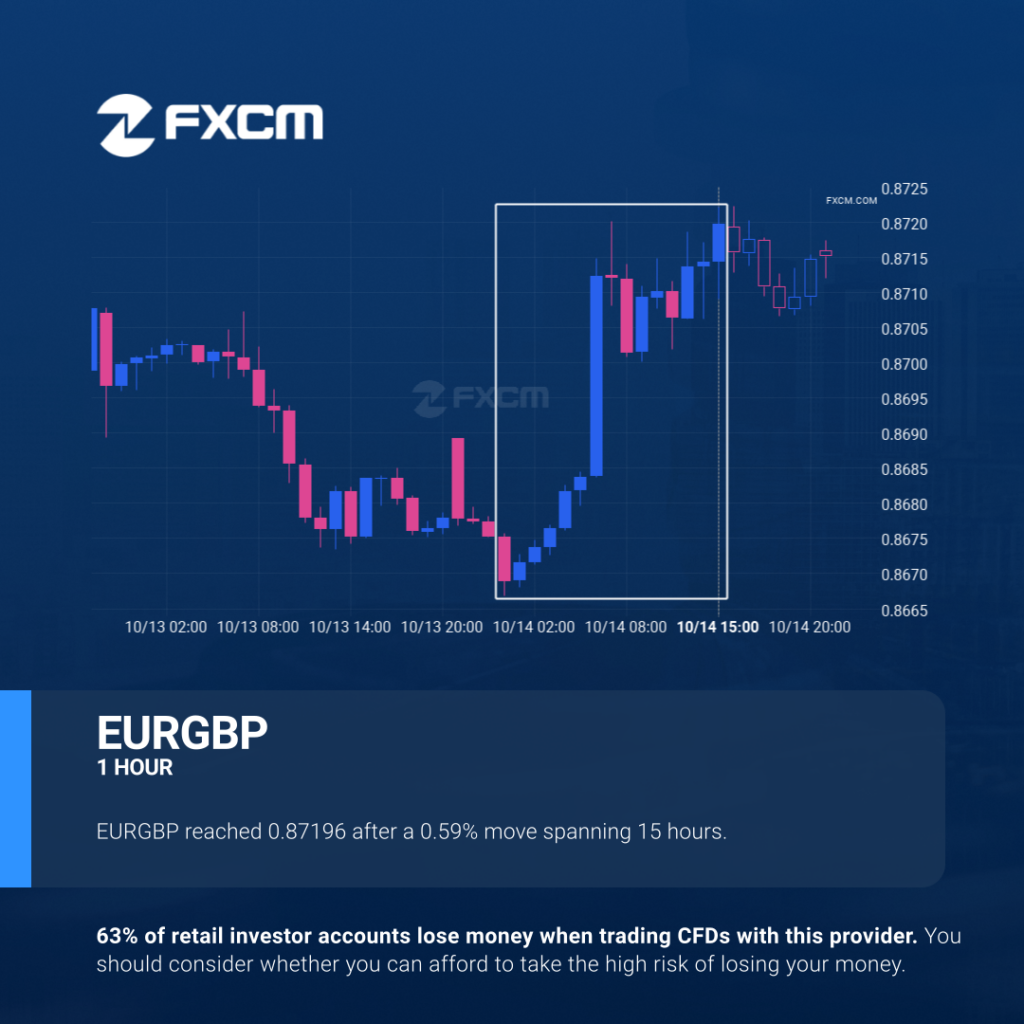
An unexpected large move occurred on EURGBP 1 hour chart, starting at 0.86688 and reaching 0.87196. It stands out in recent trading activity. Past performance is not an indicator of future results. Trading leveraged products carries significant risk. Please refer to PDS and TMD on our website. AFSL#309763
EURGBP se mueve al alza.
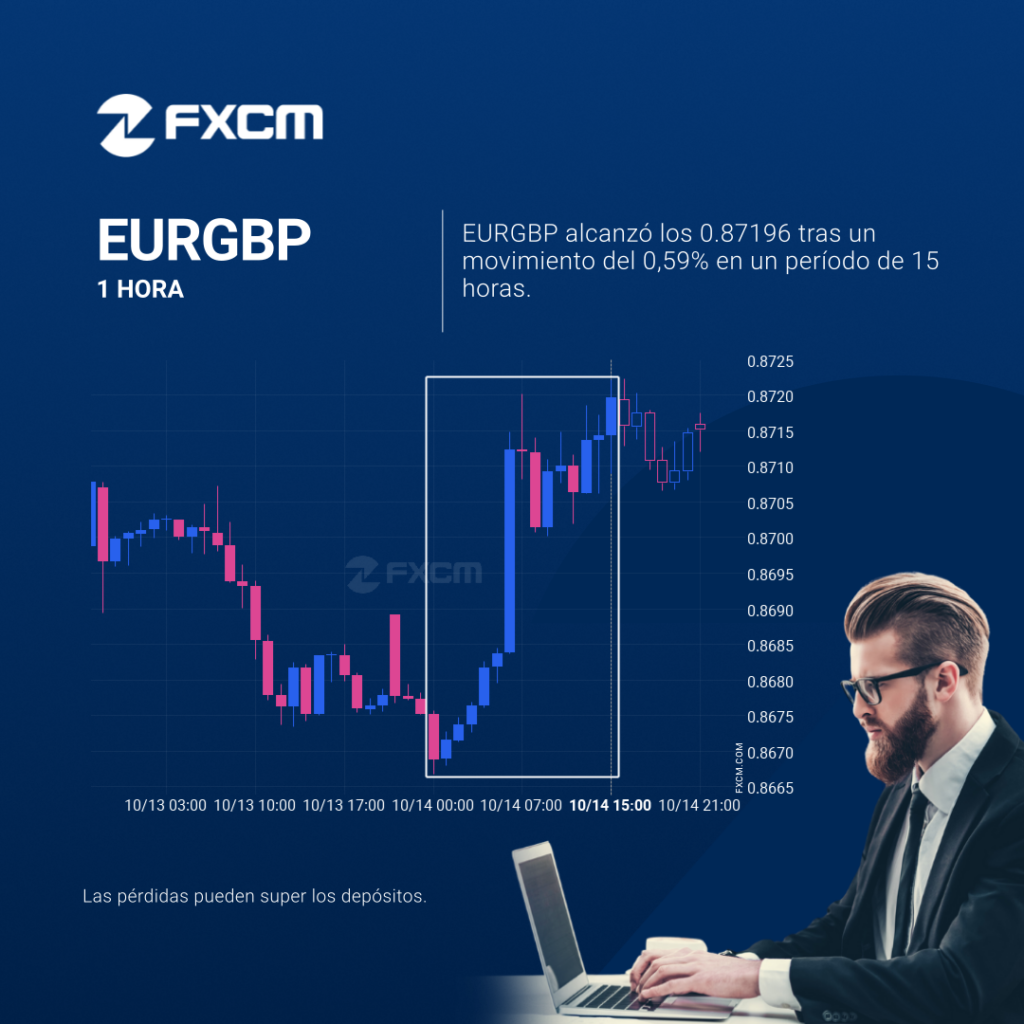
Se produjo un movimiento inesperado de gran magnitud en el gráfico 1 Hora de EURGBP, comenzando en 0.86688 y alcanzando 0.87196. Destaca claramente en la actividad reciente. El rendimiento pasado no es indicativo de resultados futuros. Las pérdidas pueden exceder los fondos depositados.
EURGBP running upward.
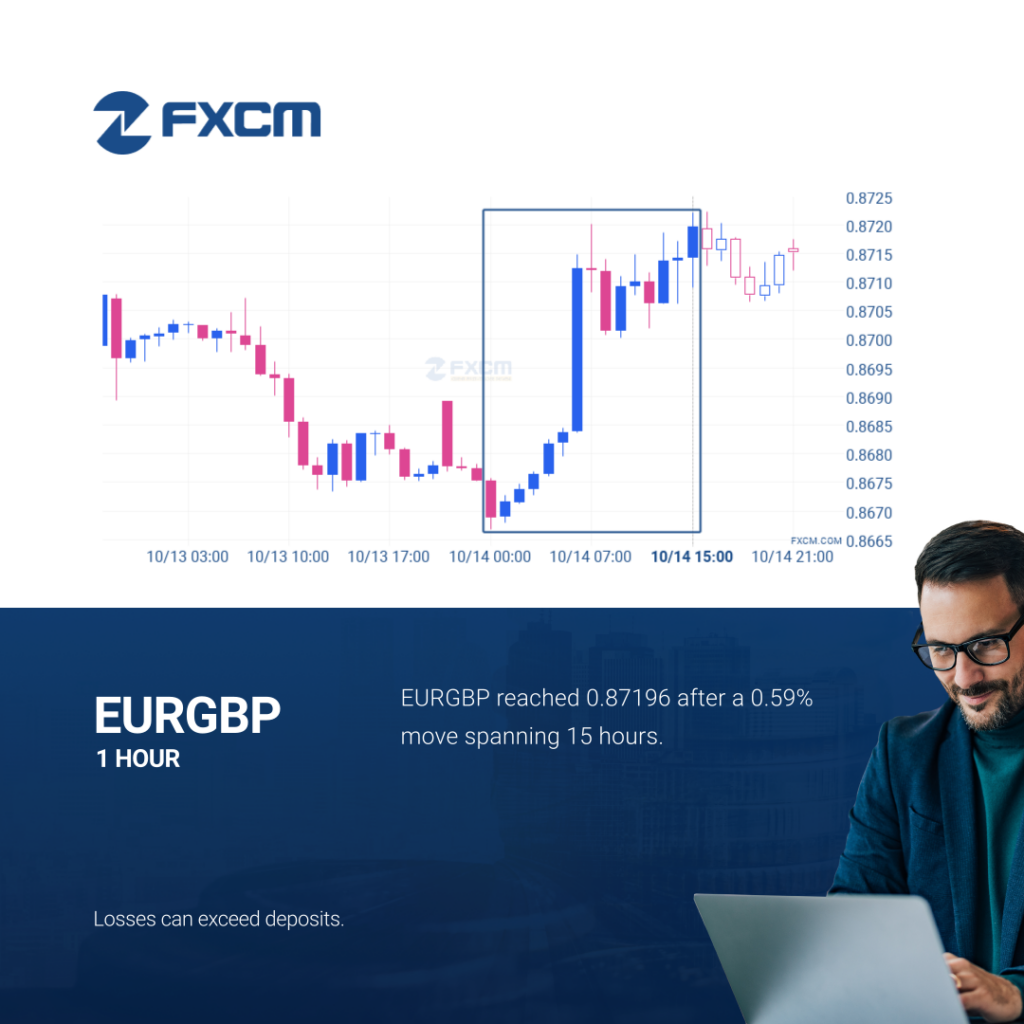
An unexpected large move occurred on EURGBP 1 hour chart, starting at 0.86688 and reaching 0.87196. It stands out in recent trading activity. Past performance is not an indicator of future results. Losses can exceed deposits.
HKG33 se acerca a un nivel importante en 25277.4297
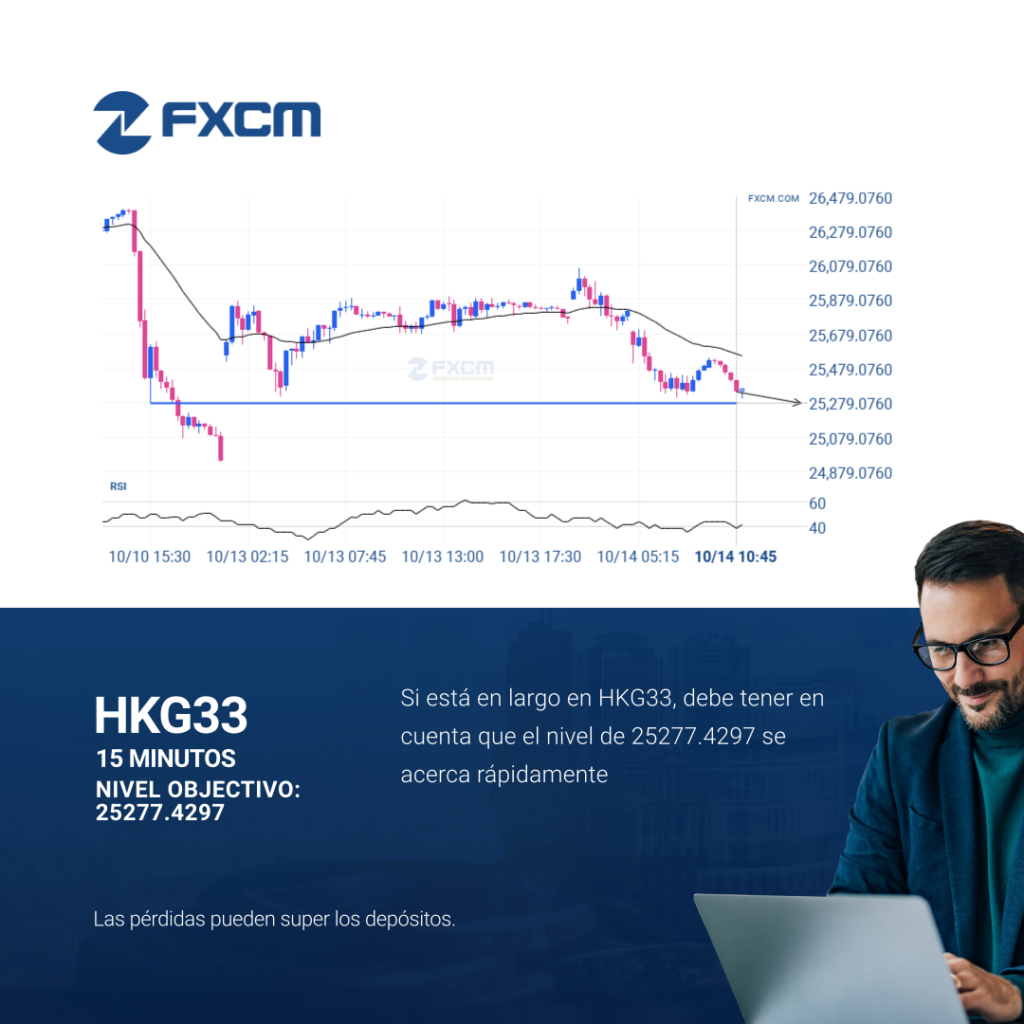
HKG33 se está acercando a una línea de soporte en 25277.4297. Si llega a la línea de soporte, puede atravesar este nivel para continuar con la tendencia bajista, o puede girarse y volver a los niveles actuales. El rendimiento pasado no es indicativo de resultados futuros. Las pérdidas pueden exceder los fondos depositados.
HKG33 approaching important level of 25277.4297
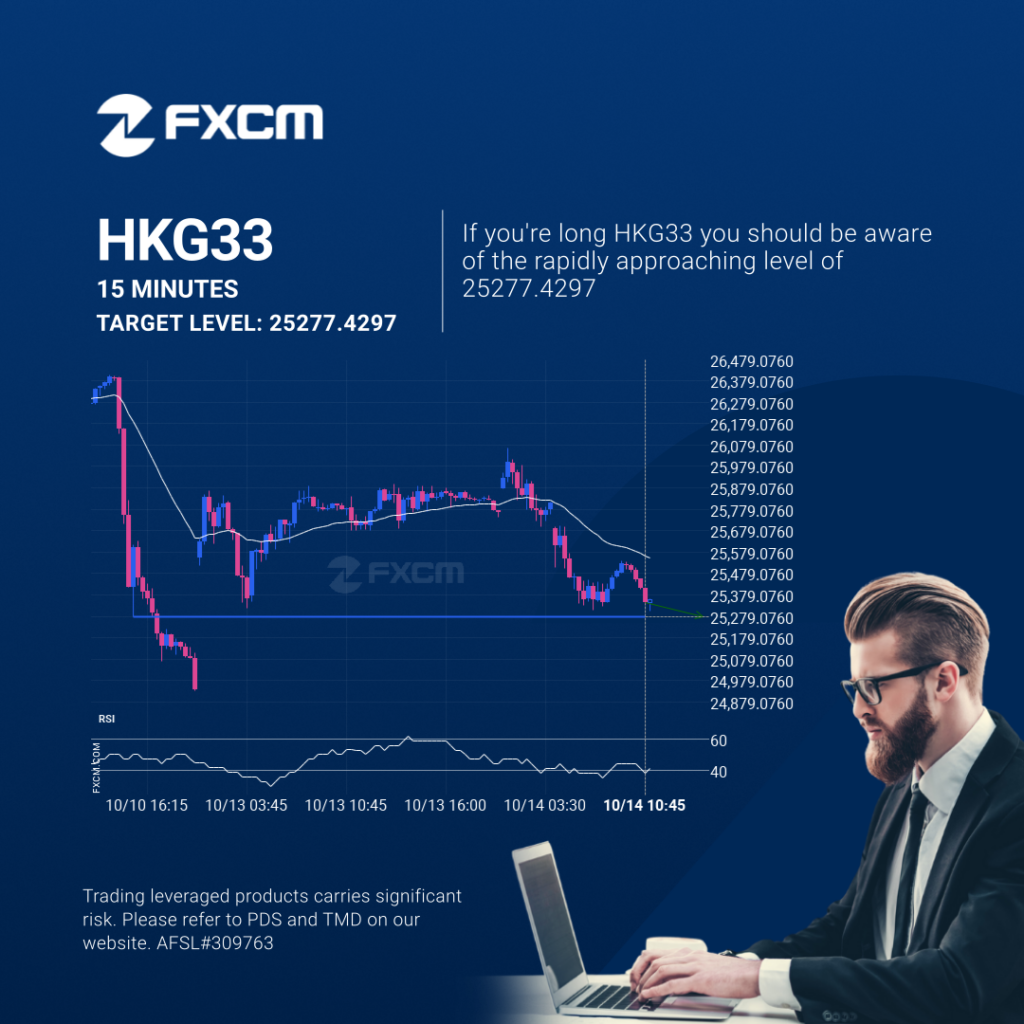
HKG33 is approaching a support line at 25277.4297. If it hits the support line, it may break through this level to continue the bearish trend, or it may turn around back to current levels. Past performance is not an indicator of future results. Trading leveraged products carries significant risk. Please refer to PDS and TMD […]
Will XAUUSD have enough momentum to break support?
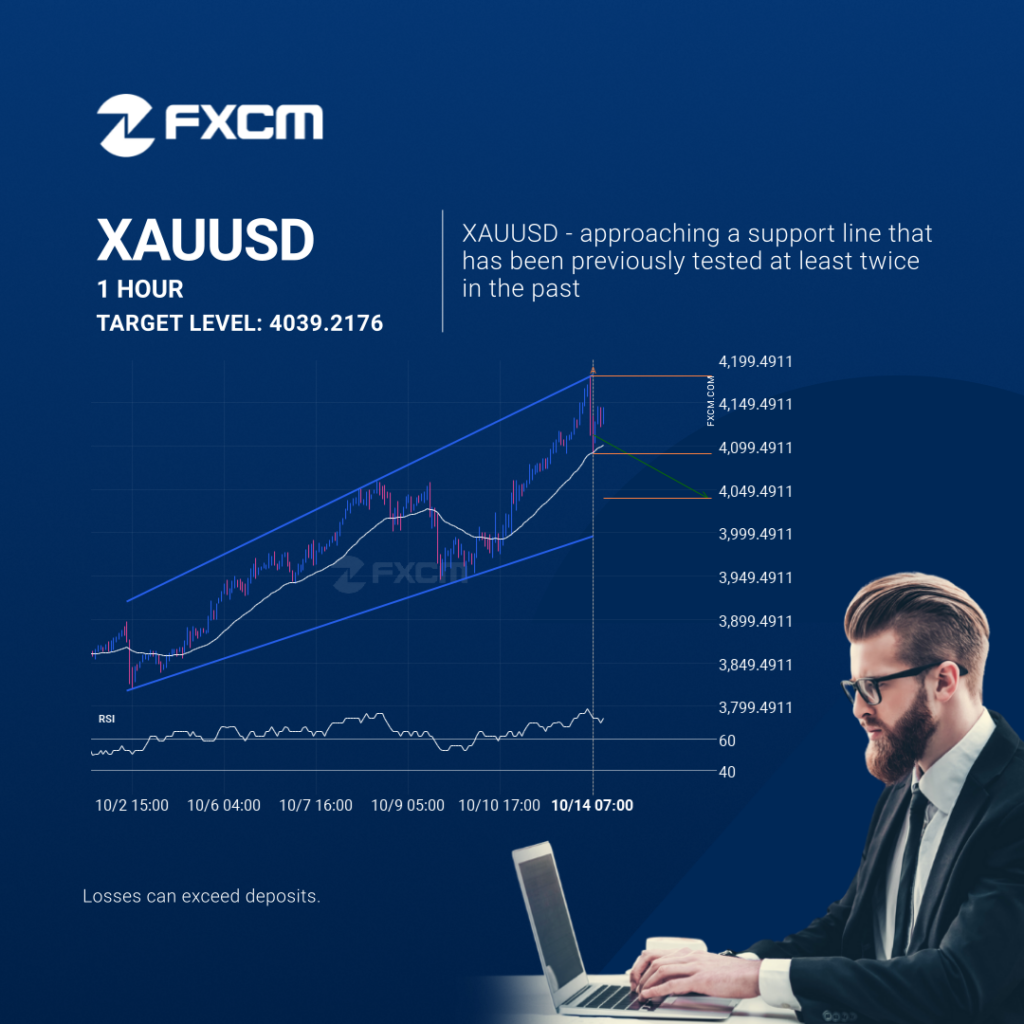
An emerging Channel Up has been detected on XAUUSD on the 1 hour chart. There is a possible move towards 4039.2176 next few candles. Once reaching resistance it may continue its bearish run or reverse back to current price levels. Past performance is not an indicator of future results. Losses can exceed deposits.
¿Tendrá el XAUUSD suficiente impulso como para irrumpir el soporte?
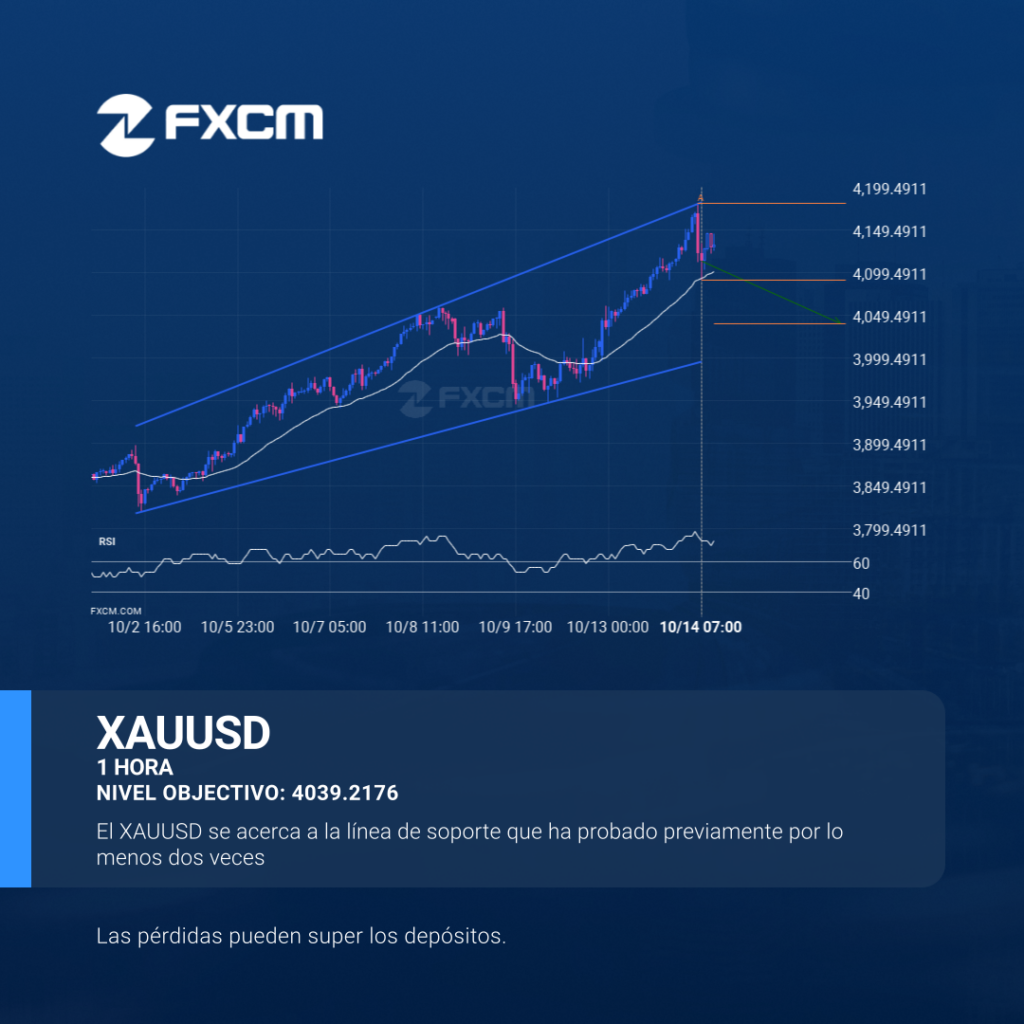
Se ha detectado un patrón Canal alcista en formación en XAUUSD en el gráfico de 1 Hora. Existe la posibilidad de un movimiento hacia 4039.2176 en las próximas velas. Una vez que alcance resistance, el precio puede continuar su tendencia bajista o revertir a los niveles actuales de precio. El rendimiento pasado no es indicativo […]