El EURCHF se aproxima a el soporte de un Canal bajista

Se ha detectado un patrón Canal bajista en formación en EURCHF en el gráfico de 4 Hora. Existe la posibilidad de un movimiento hacia 0.9259 en las próximas velas. Una vez que alcance resistance, el precio puede continuar su tendencia bajista o revertir a los niveles actuales de precio. El rendimiento pasado no es indicativo […]
AUDUSD approaching important level of 0.6561
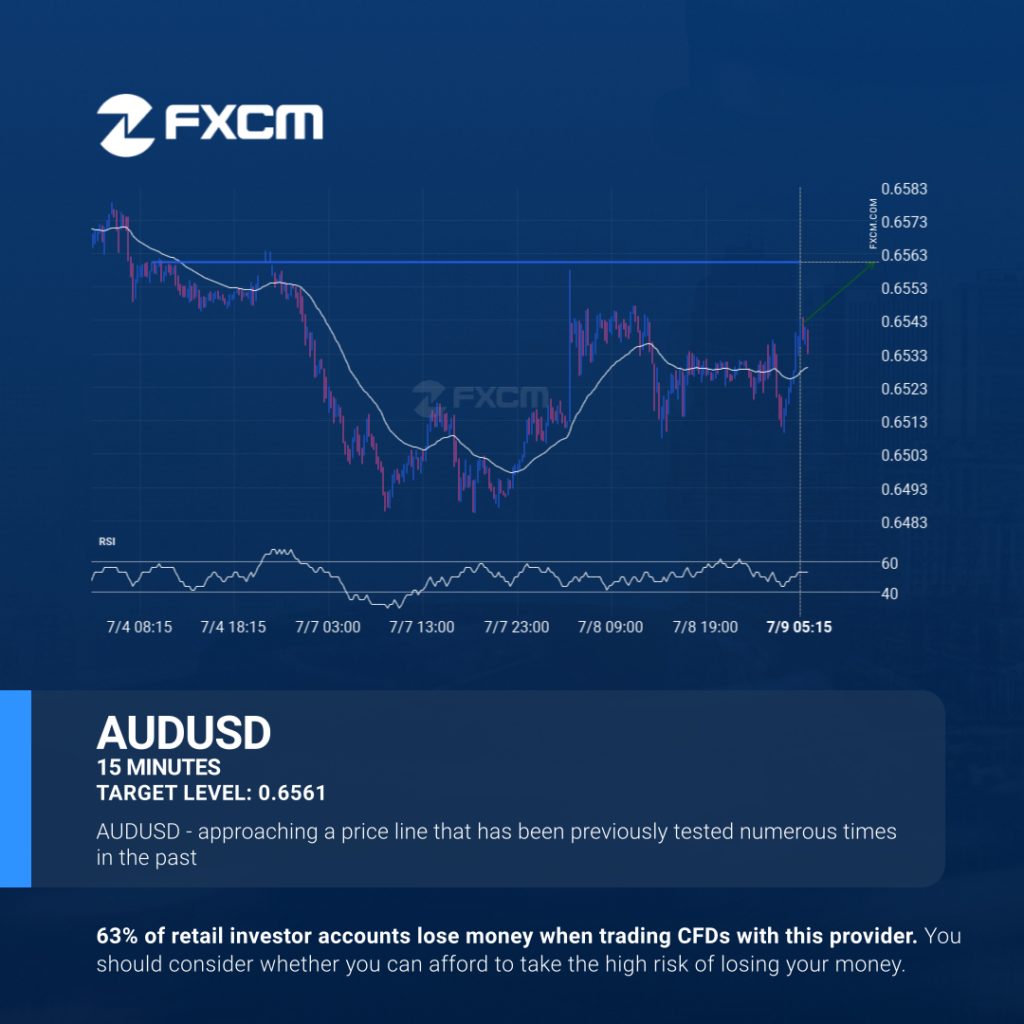
The price of AUDUSD in heading back to the resistance area. It is possible that it will struggle to break through it and move back in the other direction. The price may eventually break through, but typically the price retreats from the level a number of times before doing so. Past performance is not an […]
AUDUSD se acerca a un nivel importante en 0.6561
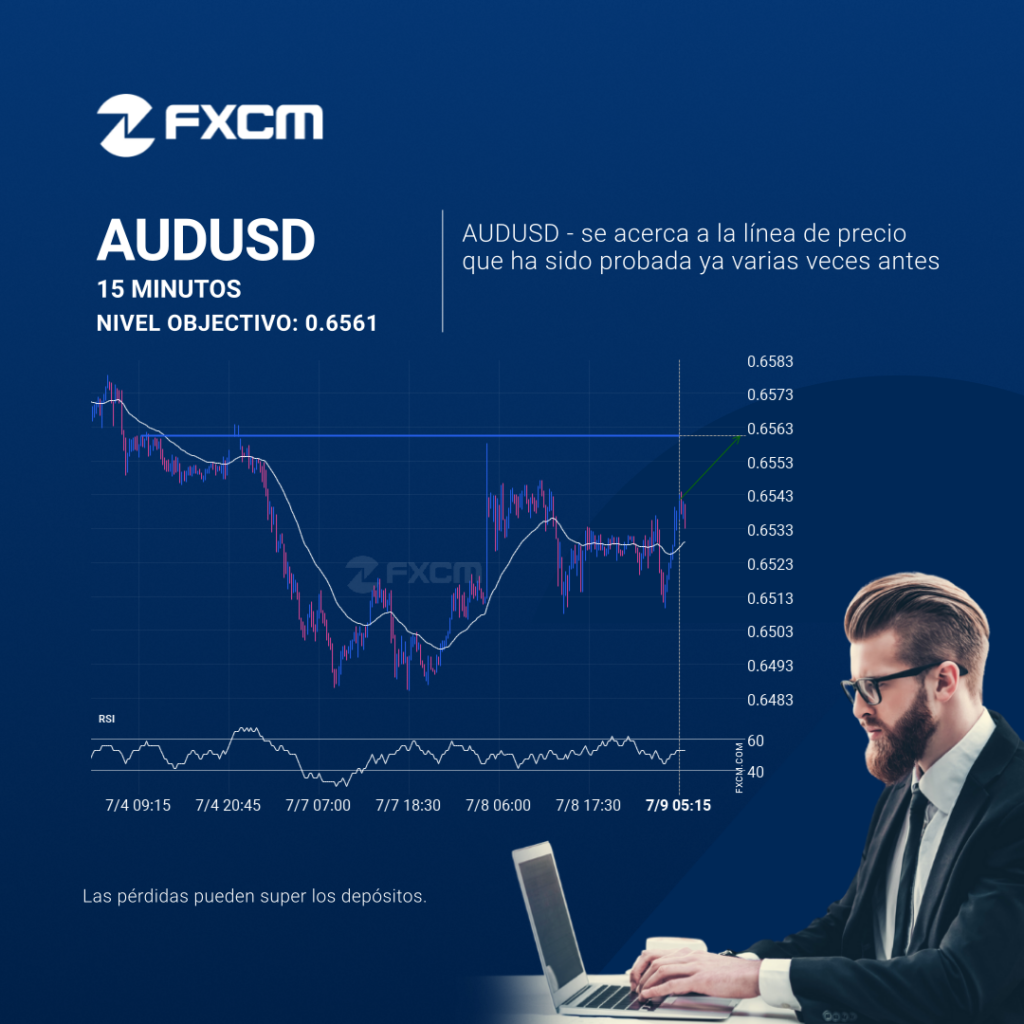
El precio de AUDUSD ha vuelto a la zona de resistencia. Es posible que tenga dificultades para atravesarla y que retroceda en la otra dirección. El precio eventualmente puede romper, pero normalmente el precio rebota en el nivel varias veces antes de hacerlo. El rendimiento pasado no es indicativo de resultados futuros. Las pérdidas pueden […]
AUDUSD approaching important level of 0.6561
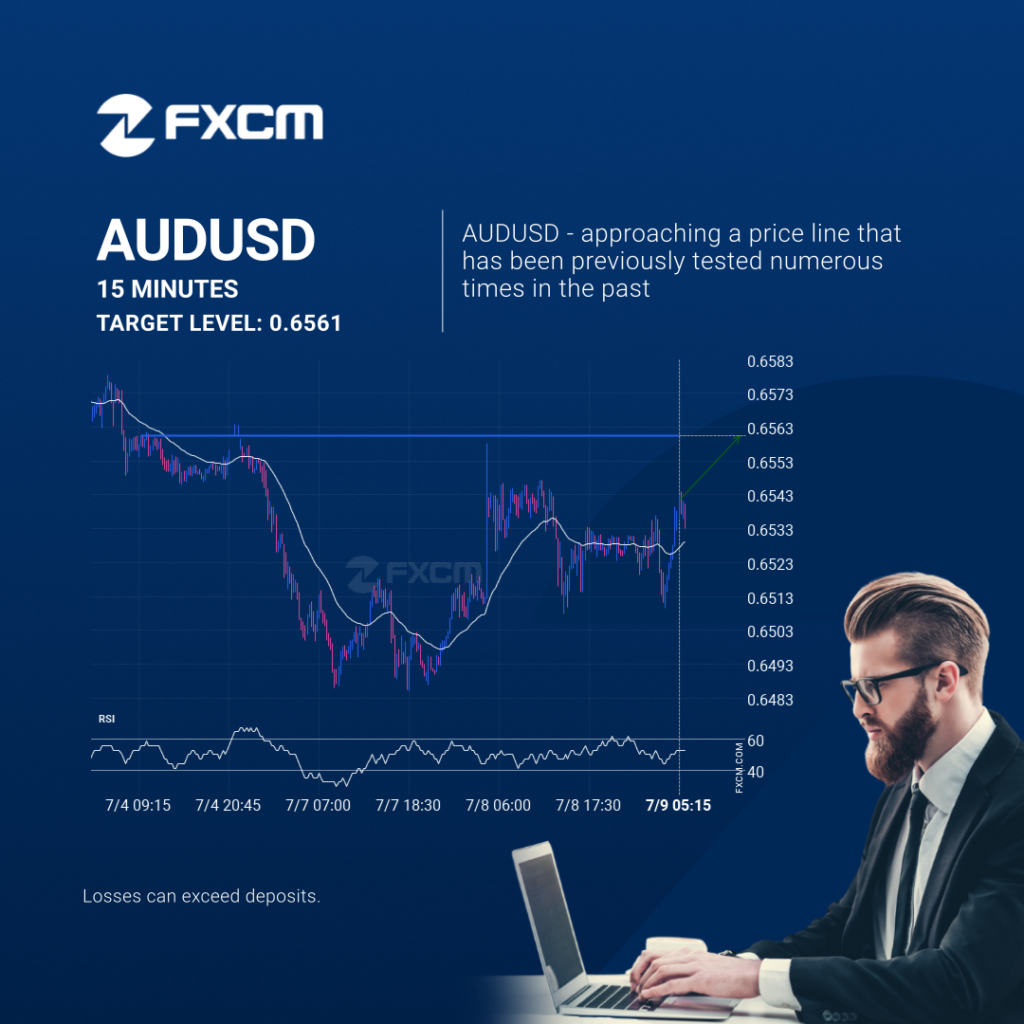
The price of AUDUSD in heading back to the resistance area. It is possible that it will struggle to break through it and move back in the other direction. The price may eventually break through, but typically the price retreats from the level a number of times before doing so. Past performance is not an […]
AUDUSD approaching important level of 0.6561
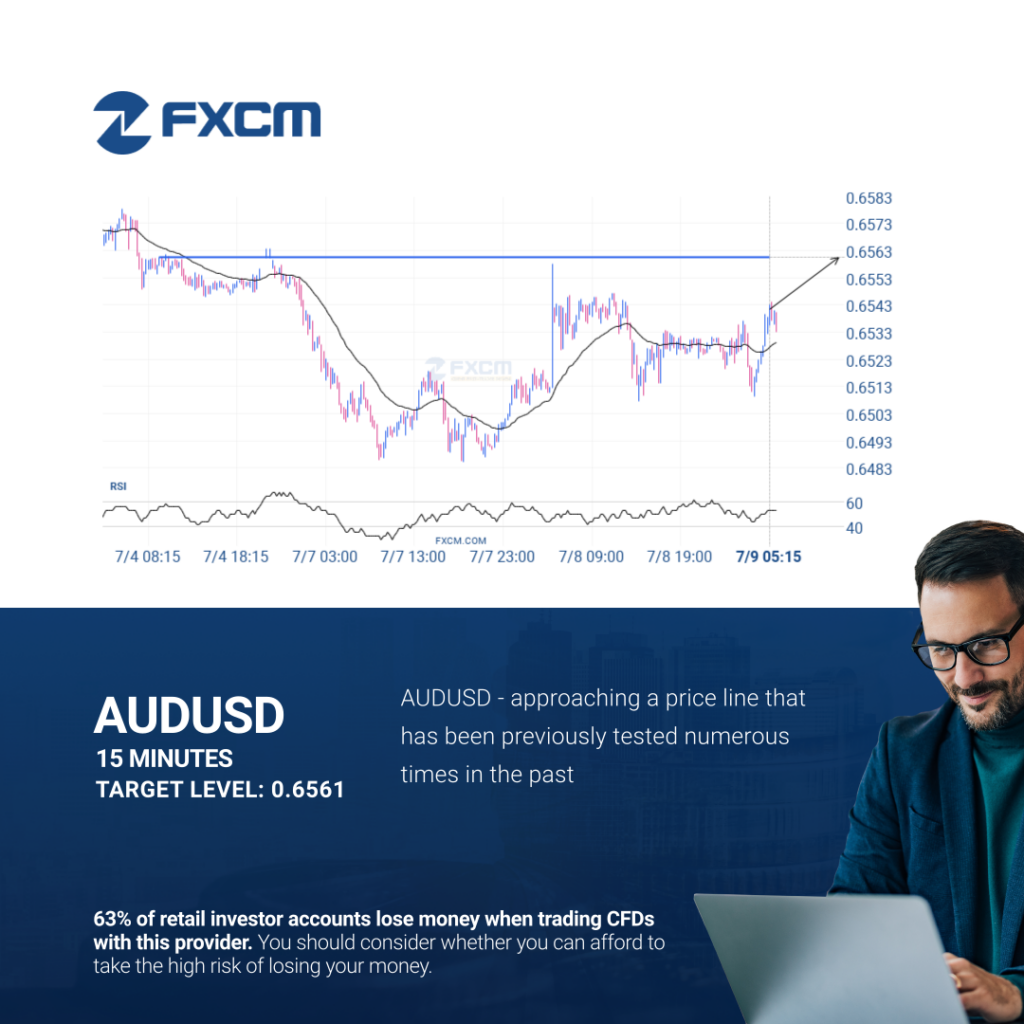
The price of AUDUSD in heading back to the resistance area. It is possible that it will struggle to break through it and move back in the other direction. The price may eventually break through, but typically the price retreats from the level a number of times before doing so. Past performance is not an […]
ESP35 – Continuation Chart Pattern – Triangle
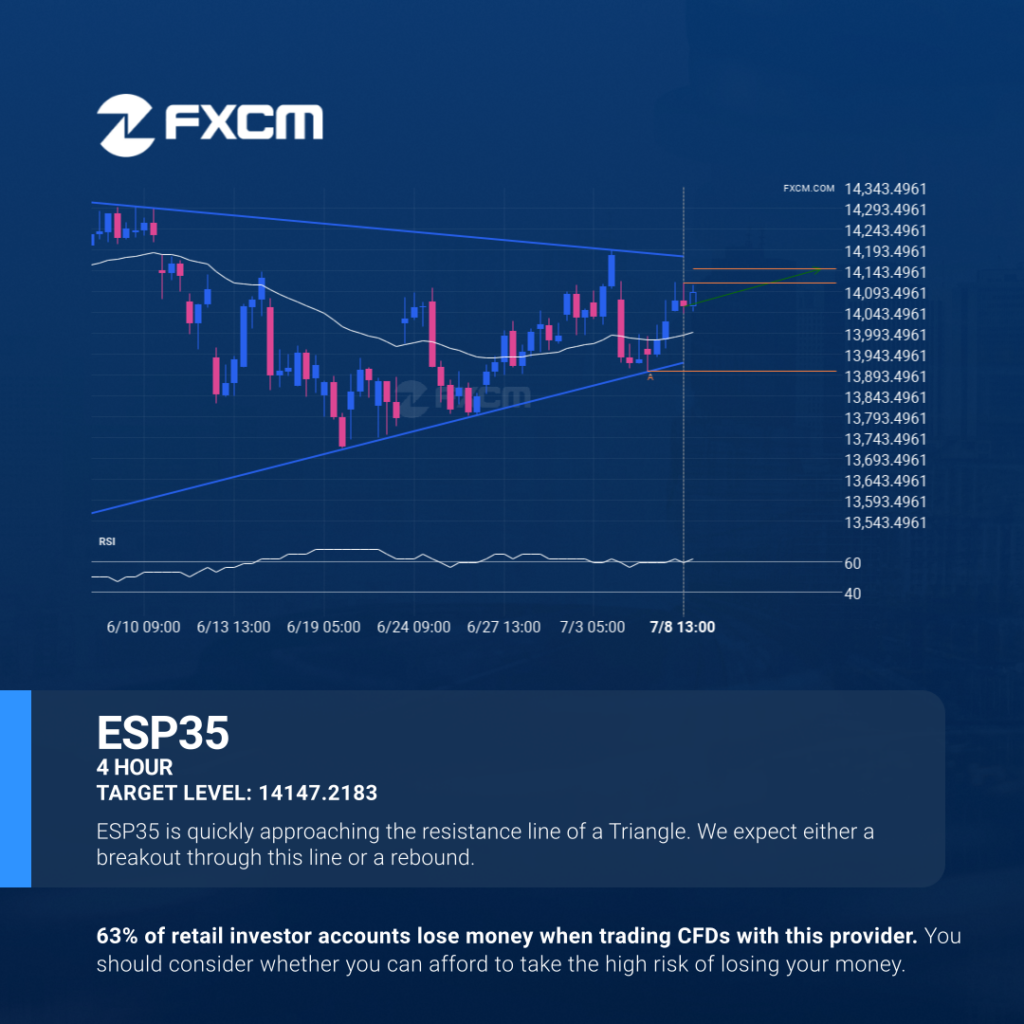
ESP35 is moving towards a resistance line which it has tested numerous times in the past. We have seen it retrace from this line before, so at this stage it isn’t clear whether it will breach this line or rebound as it did before. If ESP35 continues in its current trajectory, we could see it […]
BTCUSD se acerca a un nivel importante en 109248.3125
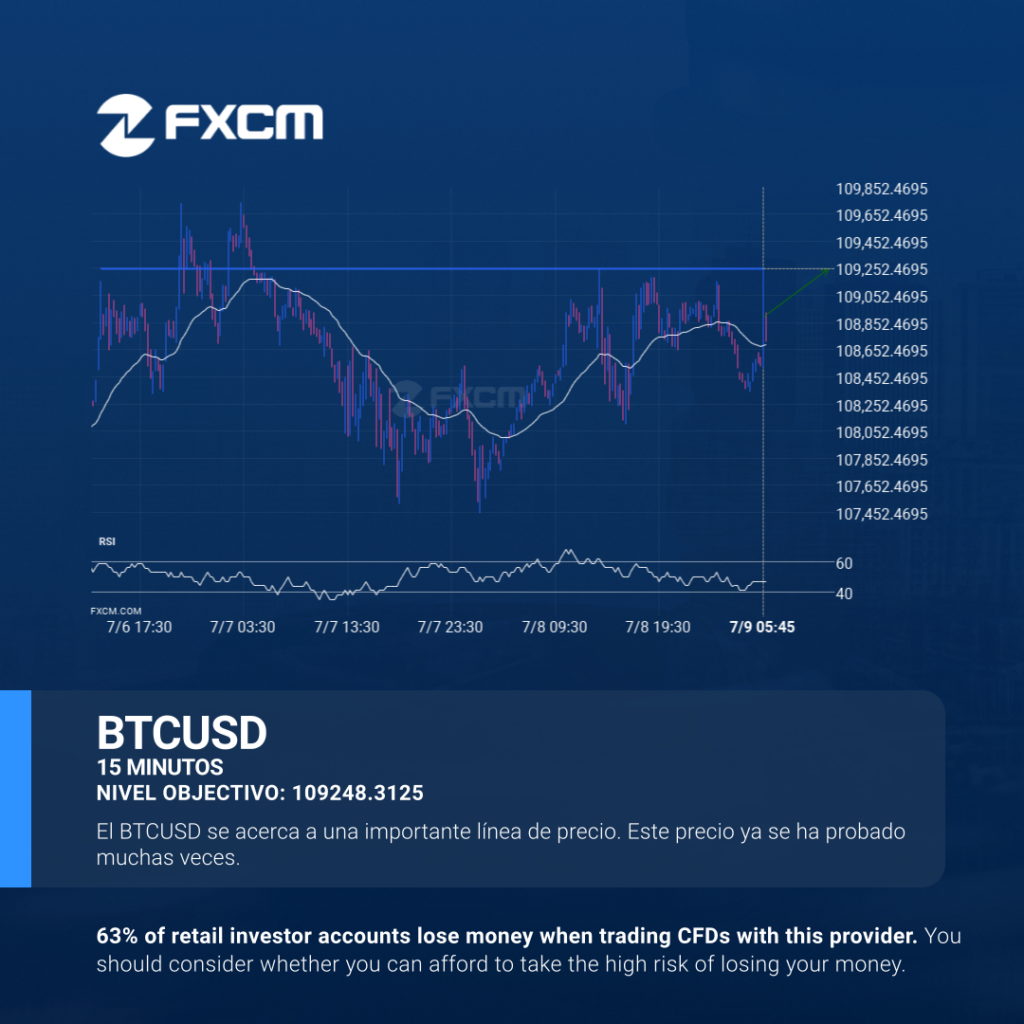
Se identificó un fuerte nivel de resistencia en 109248.3125 en el gráfico de 15 Minutos de BTCUSD. Es probable que BTCUSD lo testee pronto. El rendimiento pasado no es indicativo de resultados futuros. Las pérdidas pueden exceder los fondos depositados.
ESP35 – Continuation Chart Pattern – Triangle
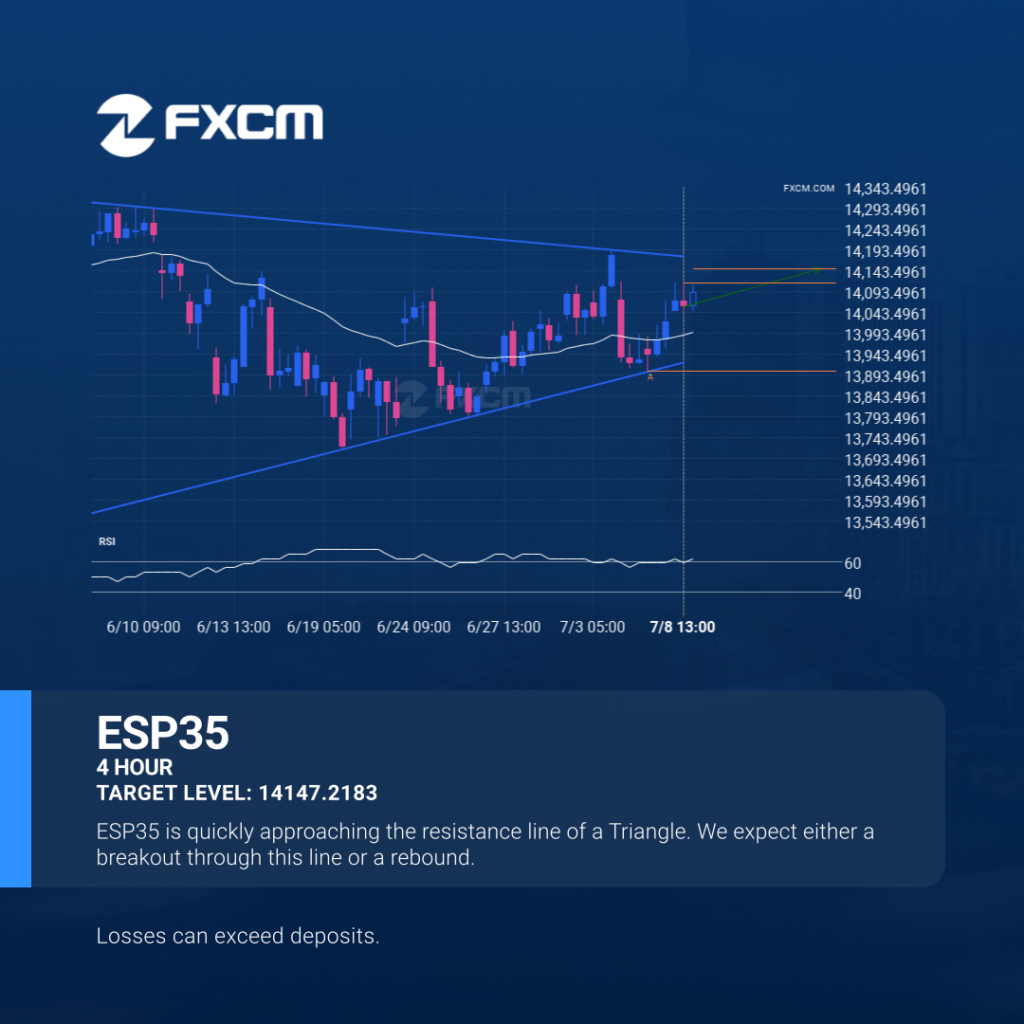
ESP35 is moving towards a resistance line which it has tested numerous times in the past. We have seen it retrace from this line before, so at this stage it isn’t clear whether it will breach this line or rebound as it did before. If ESP35 continues in its current trajectory, we could see it […]
ESP35 – Continuation Patrón de gráfico – Triángulo
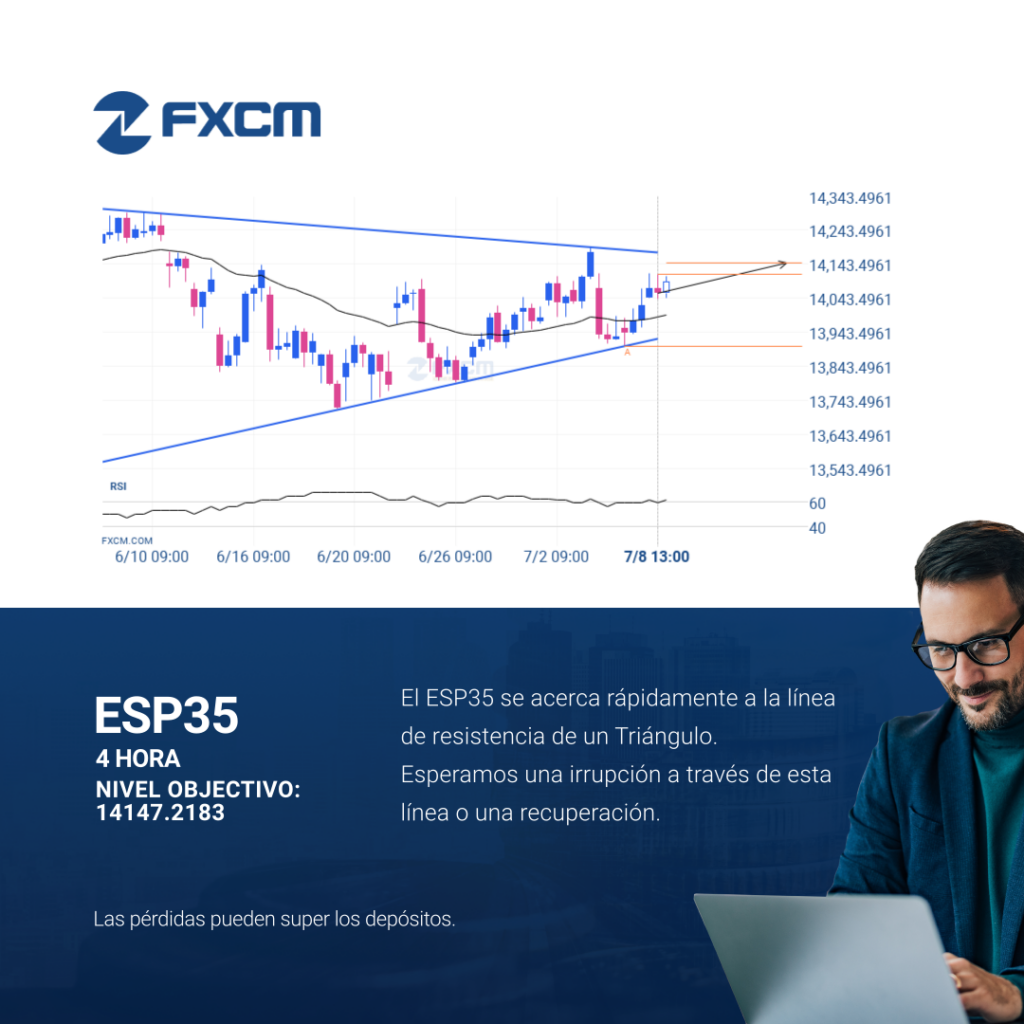
El ESP35 avanza hacia la línea de resistencia de un Triángulo, que ya ha probado varias veces en el pasado. Hemos visto un retroceso antes desde esta línea, así que en esta etapa no está claro si atravesará esta línea o se recuperará como lo ha hecho anteriormente. Si el ESP35 continúa con esta trayectoria, […]
¿Es probable que EURJPY corrija después de este gran movimiento?
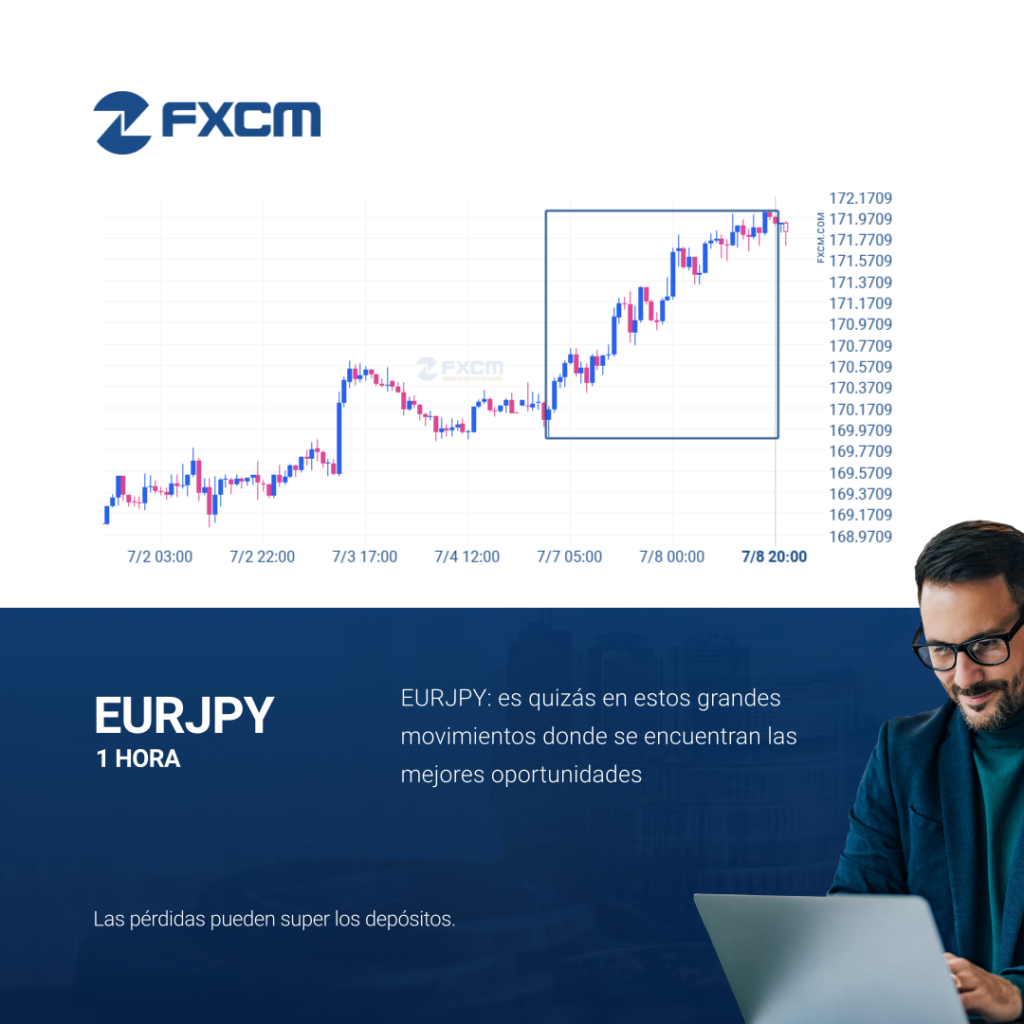
Se ha producido un gran movimiento inesperado en el gráfico de 1 Hora de EURJPY que comienza en 170.1475 y finaliza en 171.9085. ¿Es esto una señal de algo nuevo? ¿Qué podemos esperar en el futuro? El rendimiento pasado no es indicativo de resultados futuros. Las pérdidas pueden exceder los fondos depositados.