EURUSD approaching support of a Channel Down
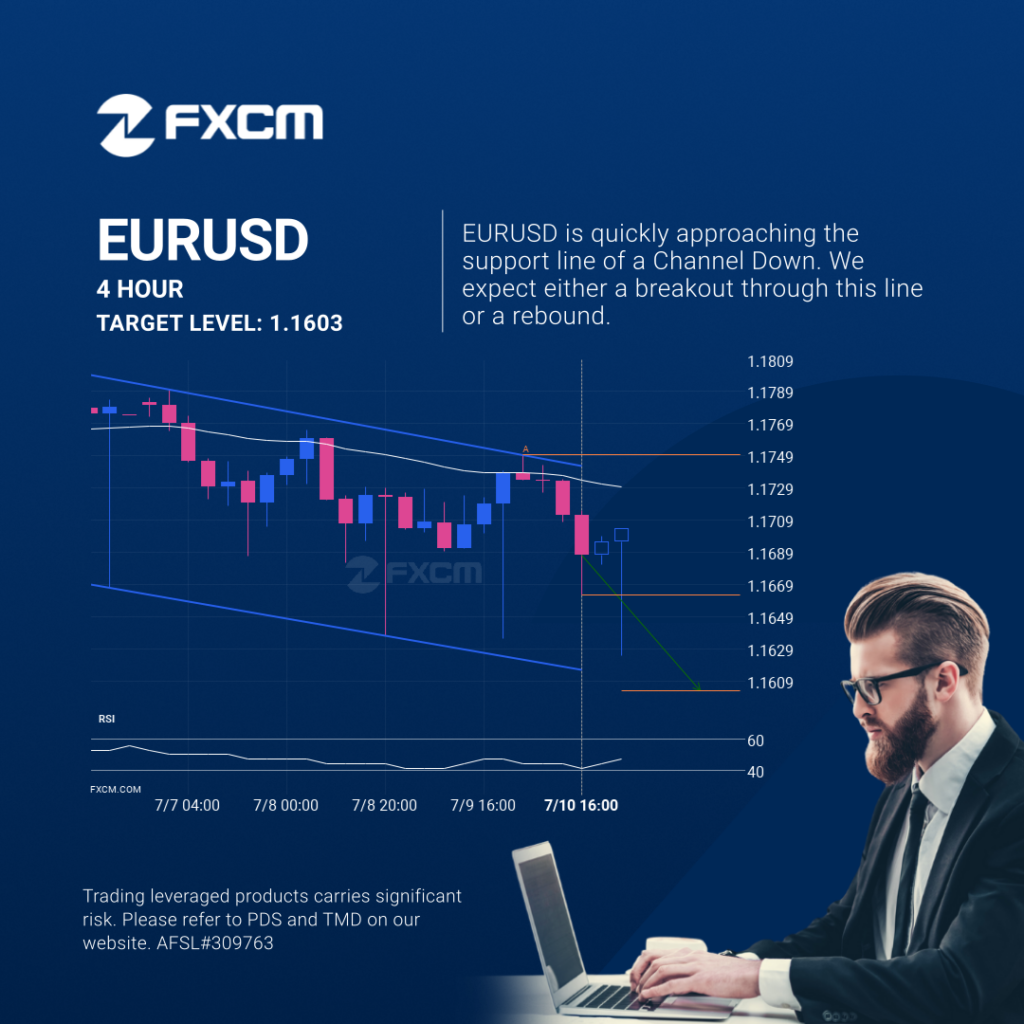
EURUSD is moving towards a support line. Because we have seen it retrace from this line before, we could see either a break through this line, or a rebound back to current levels. It has touched this line numerous times in the last 8 days and may test it again within the next 22 hours. […]
EURUSD approaching support of a Channel Down
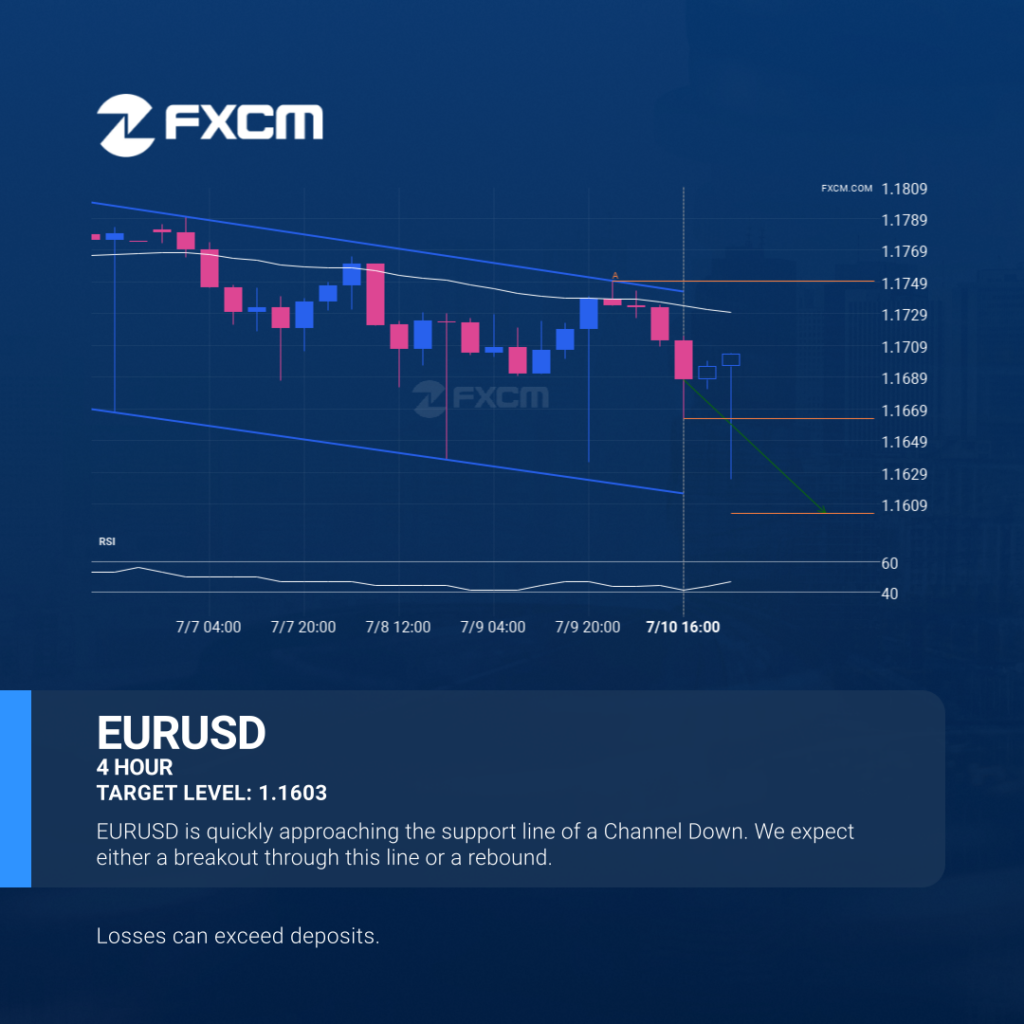
EURUSD is moving towards a support line. Because we have seen it retrace from this line before, we could see either a break through this line, or a rebound back to current levels. It has touched this line numerous times in the last 8 days and may test it again within the next 22 hours. […]
El EURUSD se aproxima a el soporte de un Canal bajista
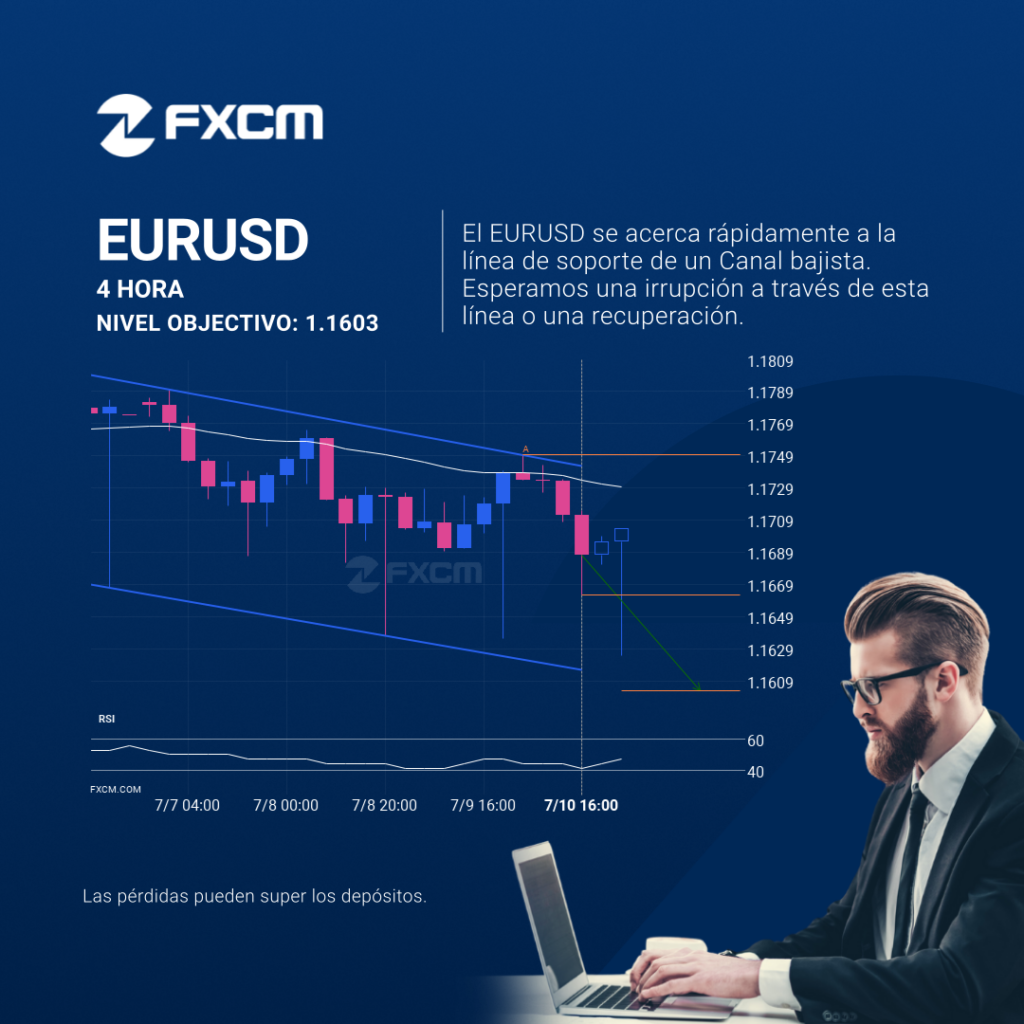
El EURUSD avanza hacia una línea de soporte. Como le hemos visto retroceder desde esta línea anteriormente, podríamos presenciar, o bien, una ruptura a través de esta línea o una recuperación a los niveles actuales. Ha llegado a esta línea en numerosas ocasiones en los últimos 8 días y puede probarla de nuevo en las […]
Rotura confirmada en el gráfico de 30 Minutos de EURJPY
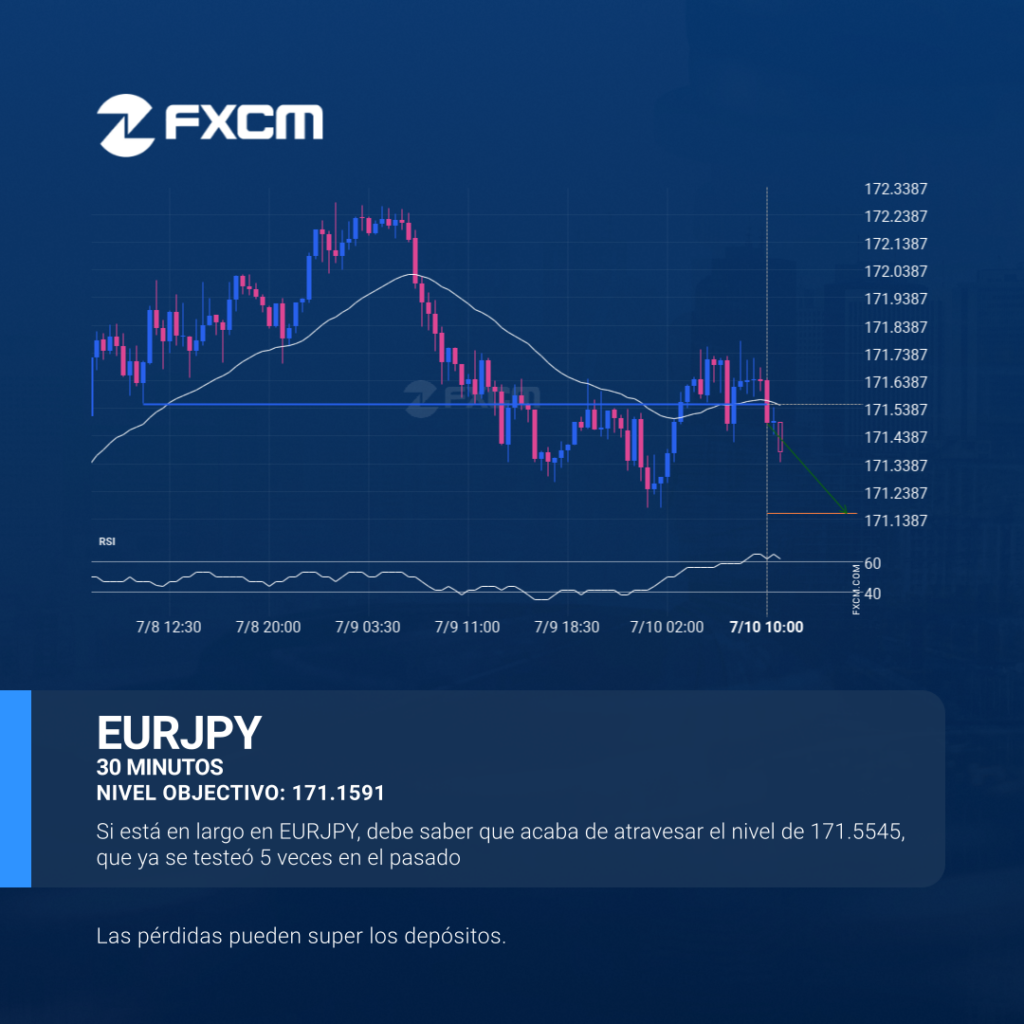
Se ha atravesado un fuerte nivel de soporte en 171.5545 en el gráfico de 30 Minutos de EURJPY. La teoría del análisis técnico pronostica un movimiento a 171.1591 en el próximo período de 11 Horas. El rendimiento pasado no es indicativo de resultados futuros. Las pérdidas pueden exceder los fondos depositados.
Confirmed breakout on EURJPY 30 Minutes chart

A strong support level has been breached at 171.5545 on the 30 Minutes EURJPY chart. Technical Analysis theory forecasts a movement to 171.1591 in the next 11 hours. Past performance is not an indicator of future results. Losses can exceed deposits.
Possible start of a bullish trend as ESP35 breaks resistance

The price of ESP35 in heading in the direction of 14443.9854. Despite the recent breakout through 14202.6797 it is possible that it will struggle to gain momentum to the forecast price and move back in the other direction. This has happened many times in the past so watch for a possible bounce back. Past performance […]
Posible comienzo de una tendencia alcista cuando ESP35 rompa el nivel de resistencia
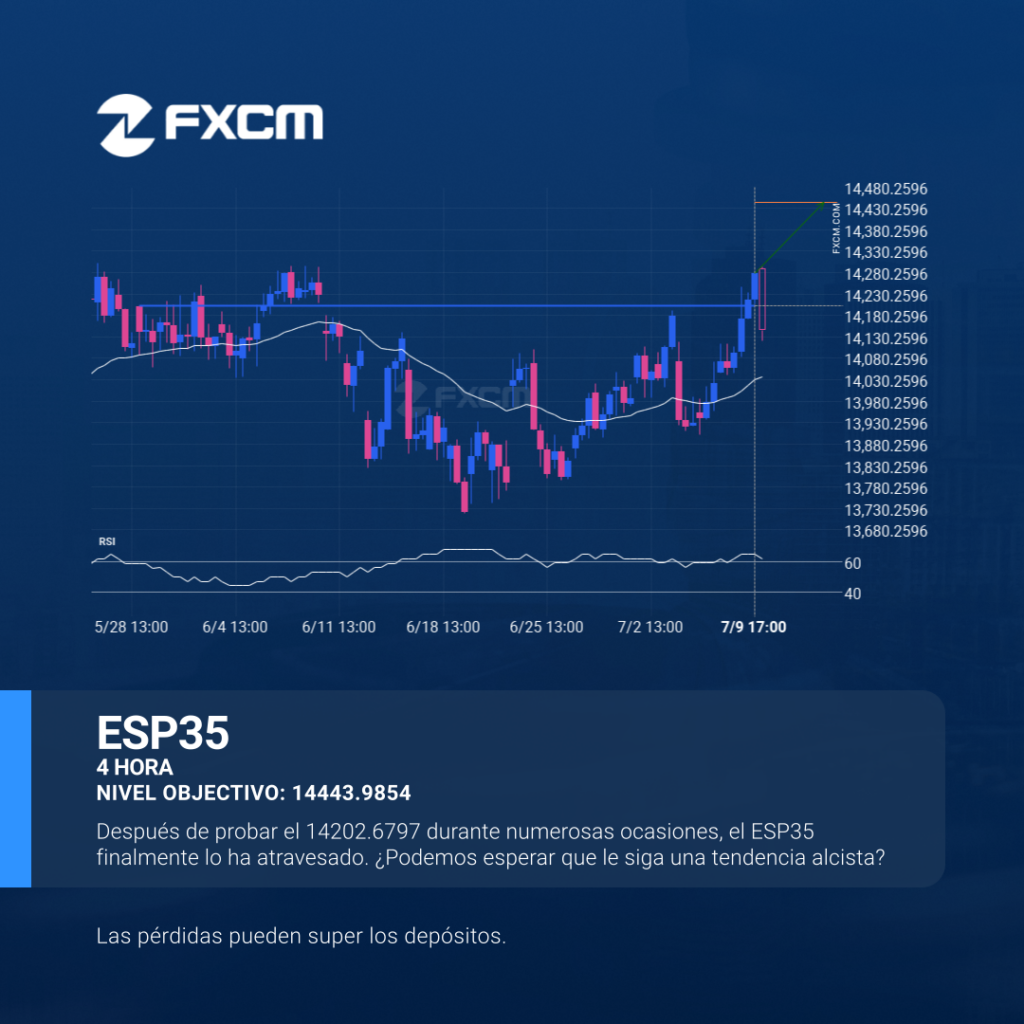
El precio de ESP35 en dirección a 14443.9854. A pesar de la reciente rotura a través de 14202.6797, es posible que tenga dificultades para ganar impulso hacia el precio previsto y que retroceda en la otra dirección. Esto ha sucedido muchas veces en el pasado, así que esté atento a un posible rebote. El rendimiento […]
Possible start of a bullish trend as ESP35 breaks resistance
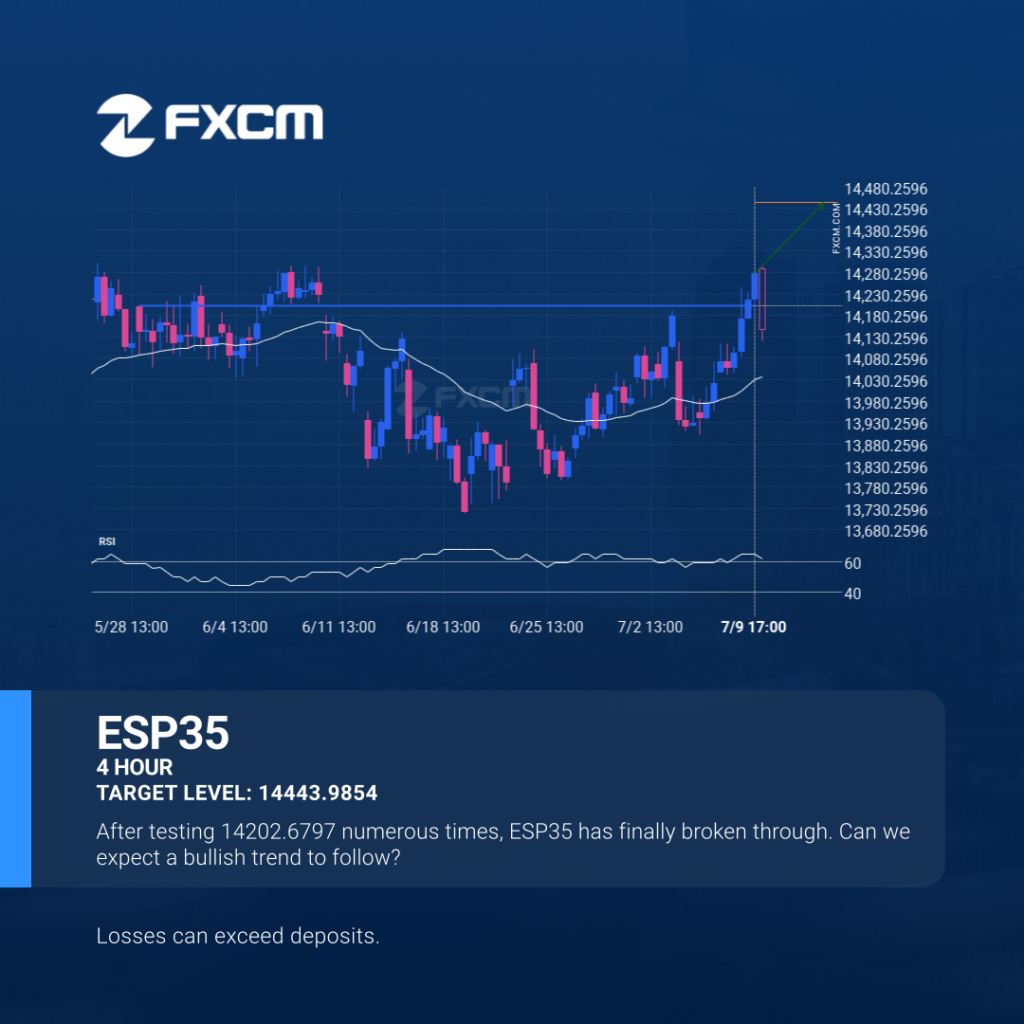
The price of ESP35 in heading in the direction of 14443.9854. Despite the recent breakout through 14202.6797 it is possible that it will struggle to gain momentum to the forecast price and move back in the other direction. This has happened many times in the past so watch for a possible bounce back. Past performance […]
USDJPY – acercándose a el soporte del Canal alcista
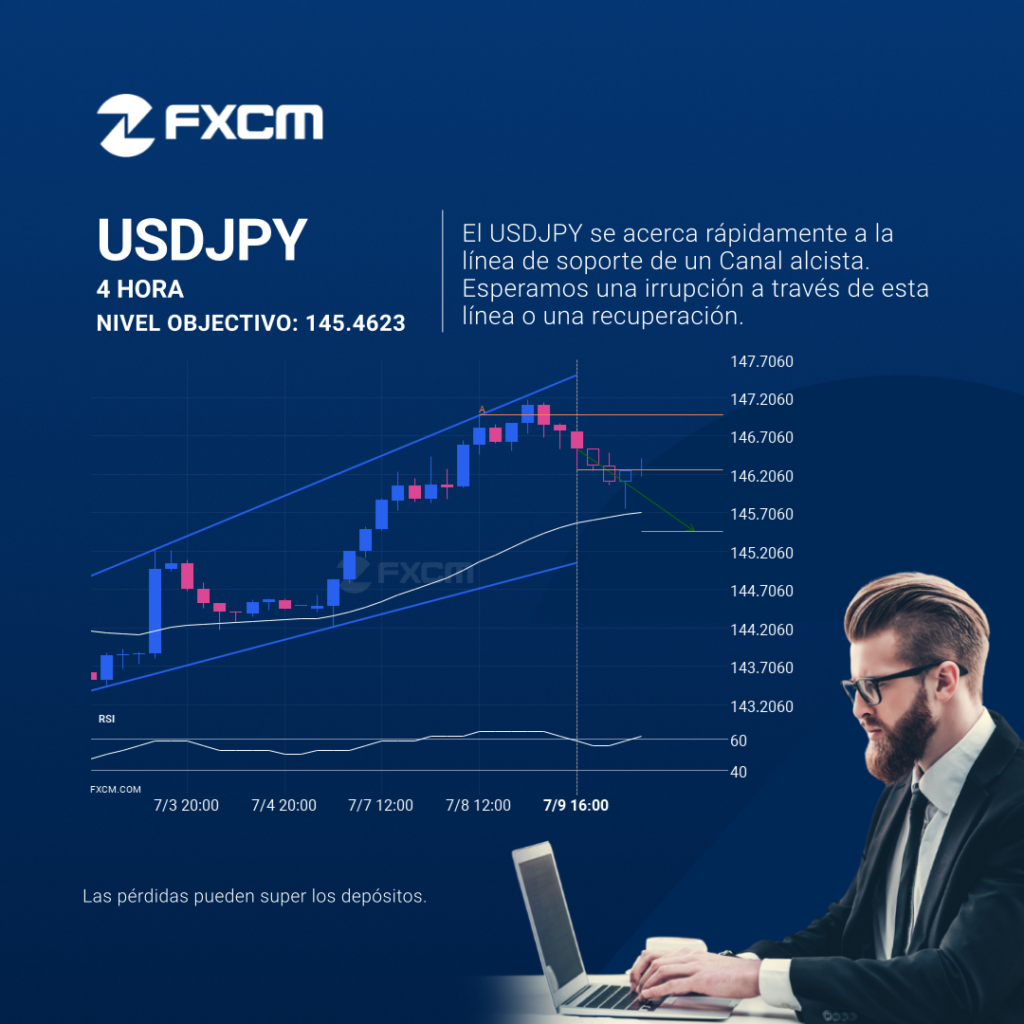
El USDJPY se está acercando a la línea de soporte de un Canal alcista. Ha llegado a esta línea en numerosas ocasiones durante los últimos 9 días. Si vuelve a probarla de nuevo, debería hacerlo en las próximas 21 horas. El rendimiento pasado no es indicativo de resultados futuros. Las pérdidas pueden exceder los fondos […]
Un posible movimiento alcista en BTCUSD
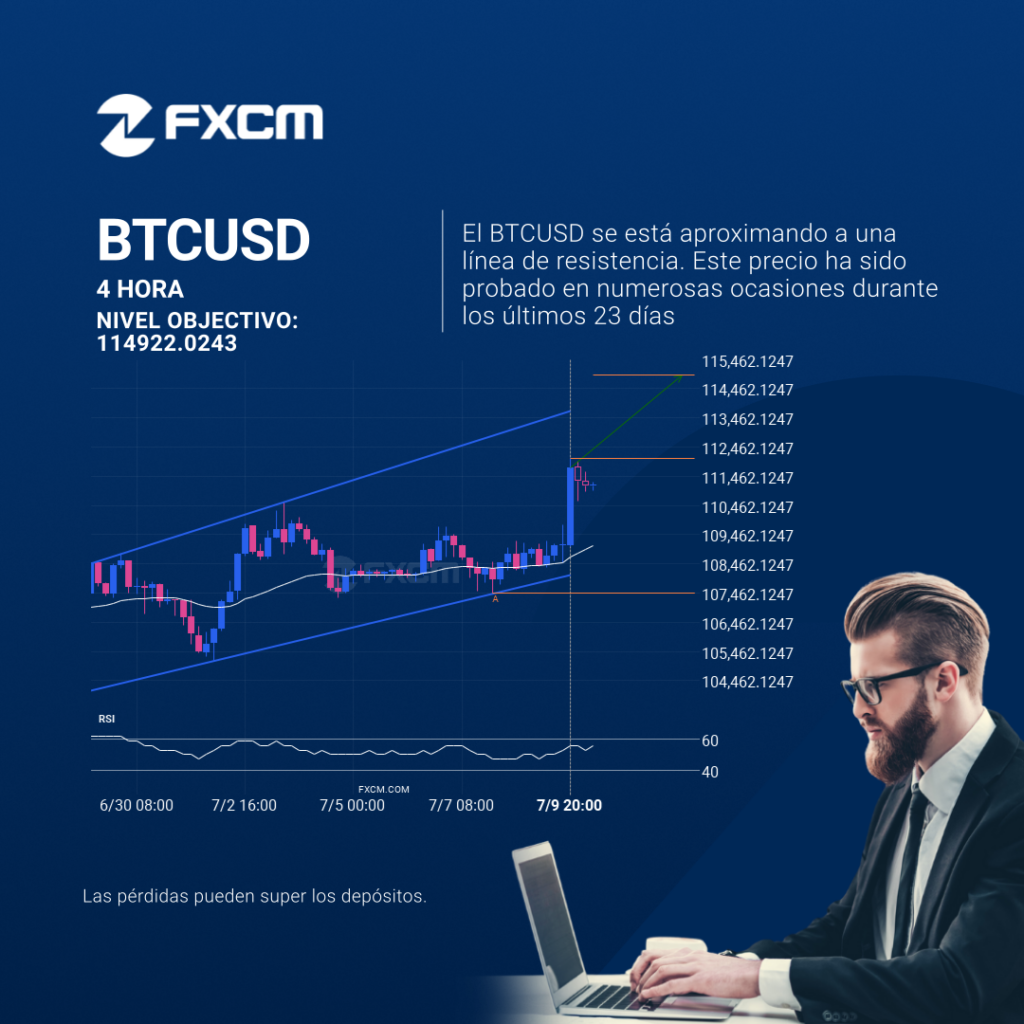
El movimiento del BTCUSD hacia la línea de resistencia de un Canal alcista es otra prueba más de la línea que ha alcanzado en numerosas ocasiones durante el pasado. Esta prueba de la línea podría ocurrir en las próximas 3 días, pero no sabemos si dará como resultado una ruptura a través de esta línea […]