BTCUSD: plan para operación alcista a corto plazo hasta 118455.2578
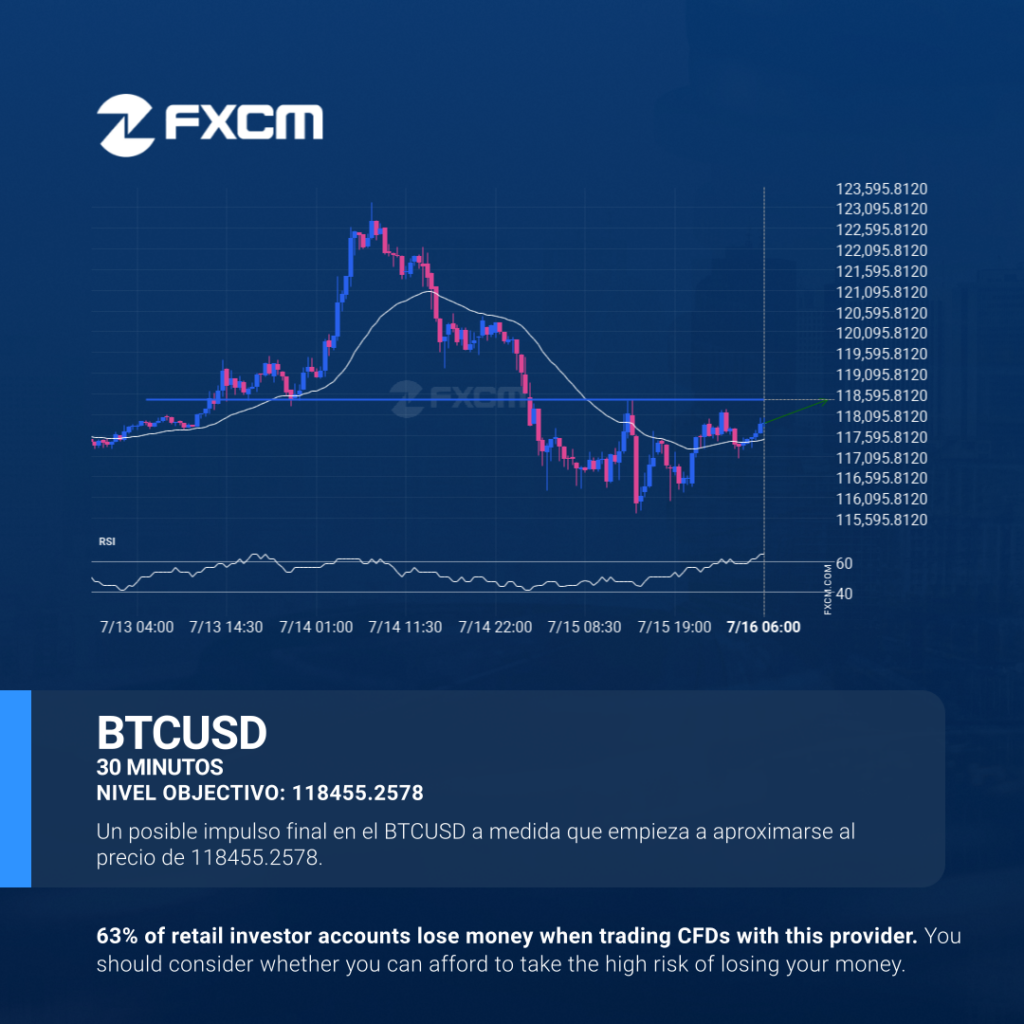
¡BTCUSD está en camino a una línea muy importante que definitivamente será un factor decisivo de lo que está por venir! Es posible que veamos que esta trayectoria continúa tocando el nivel en 118455.2578 y lo acabe rompiendo, a menos que se quede sin impulso y vuelva a los niveles actuales. El rendimiento pasado no […]
El USDCAD se aproxima a la resistencia de un Cuña ascendente
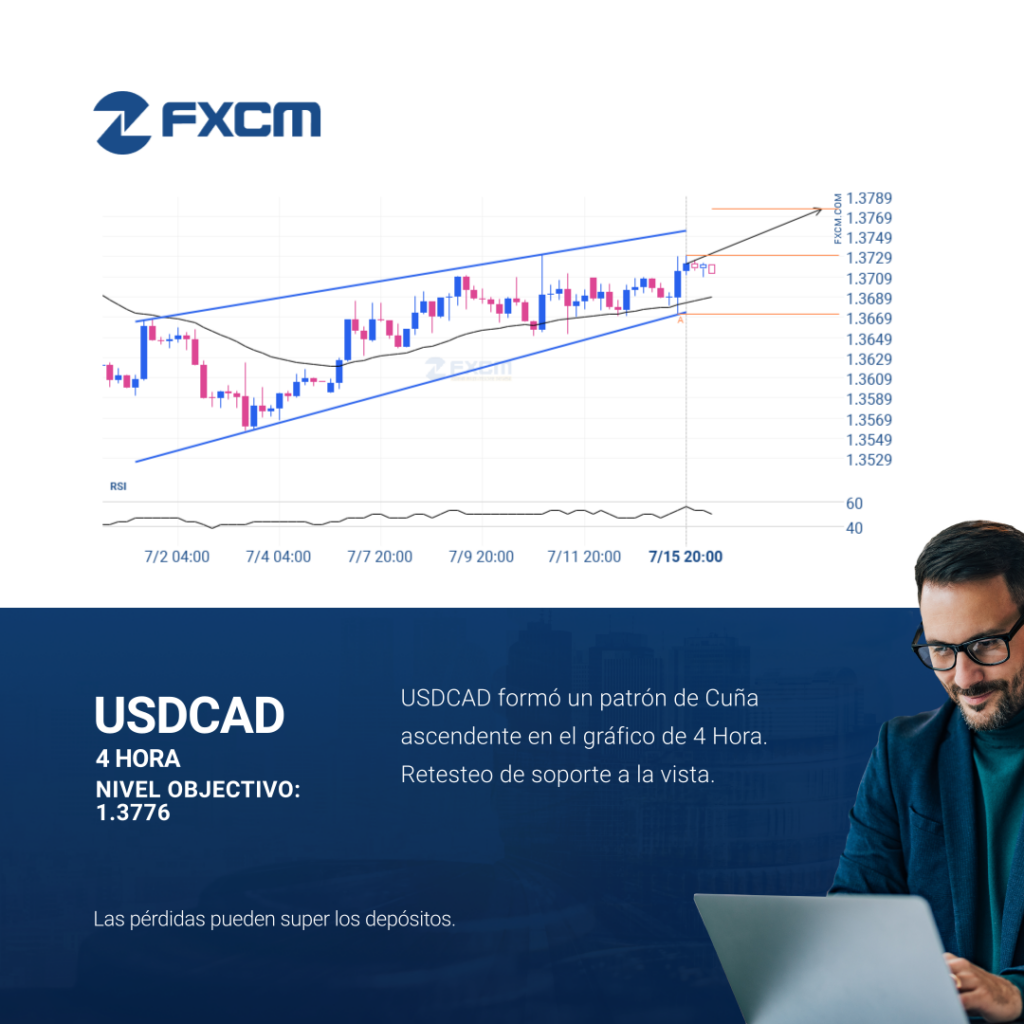
El USDCAD se dirige hacia la línea de resistencia de un Cuña ascendente y puede alcanzar este punto en las próximas 3 días. Ha probado esta línea ya en numerosas ocasiones en el pasado, y esta vez no tendría porqué ser diferente y terminar con una recuperación en lugar de una irrupción. Si ésta última […]
USDCAD approaching resistance of a Rising Wedge
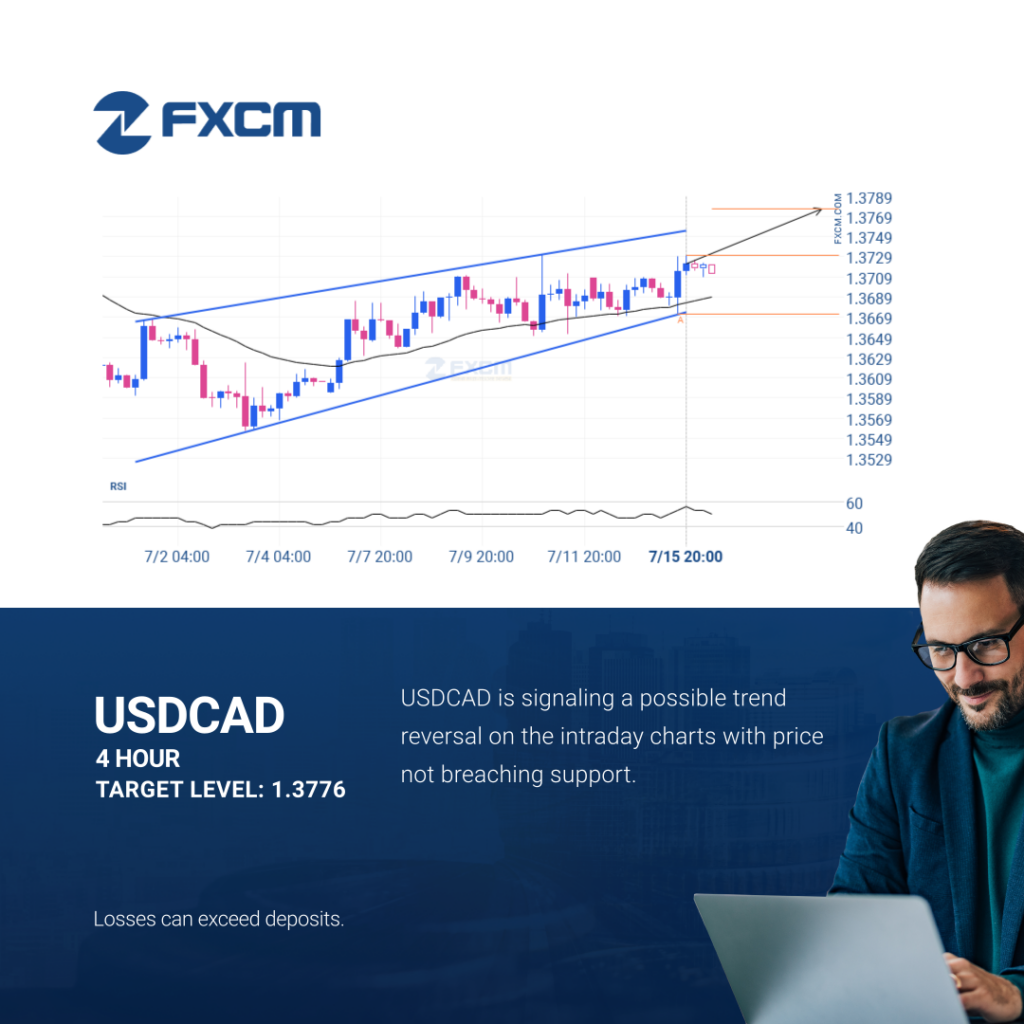
USDCAD is heading towards the resistance line of a Rising Wedge and could reach this point within the next 3 days. It has tested this line numerous times in the past, and this time could be no different from the past, ending in a rebound instead of a breakout. If the breakout doesn’t happen, we […]
Rotura confirmada en el gráfico de 4 Hora de AUDUSD
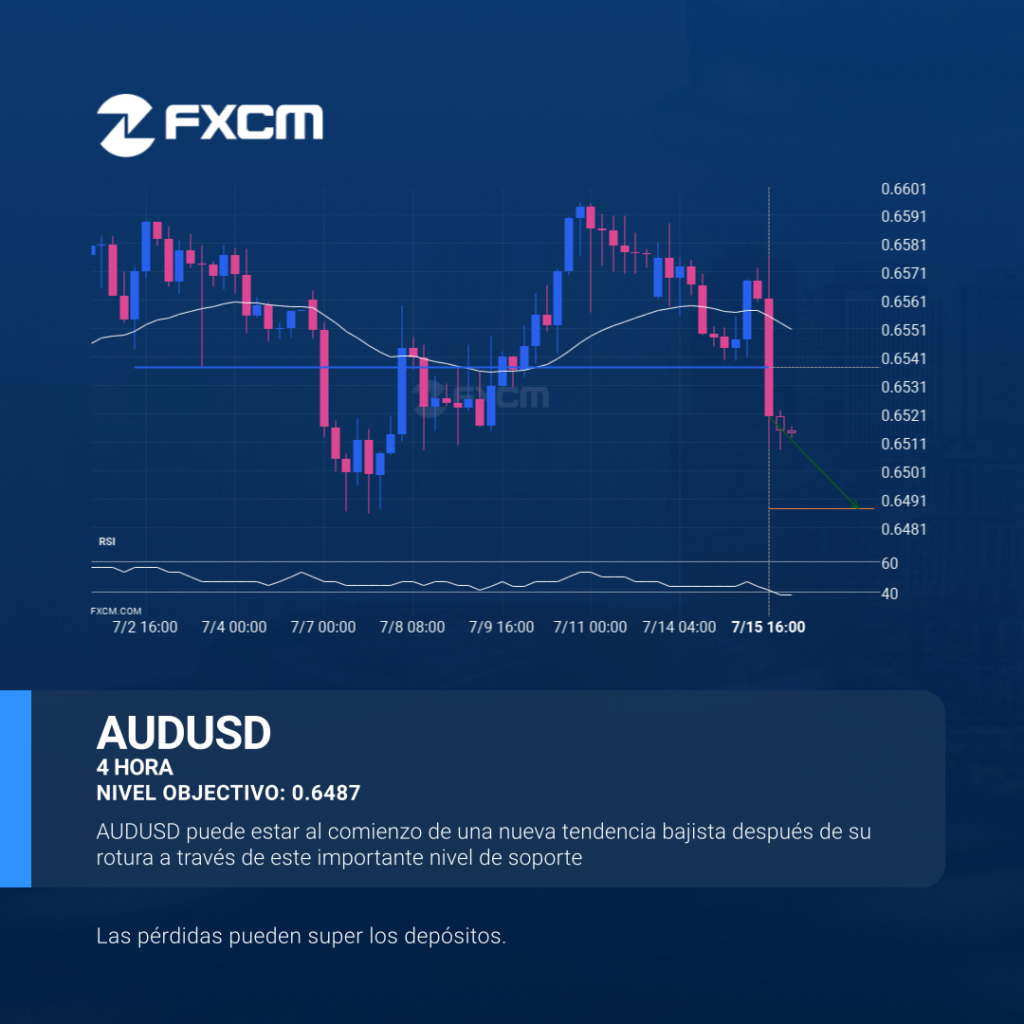
AUDUSD ha roto la línea de soporte en 0.6537. Puede continuar la tendencia bajista hacia 0.6487 o puede resultar ser otro testeo más de este nivel. El rendimiento pasado no es indicativo de resultados futuros. Las pérdidas pueden exceder los fondos depositados.
Confirmed breakout on AUDUSD 4 hour chart
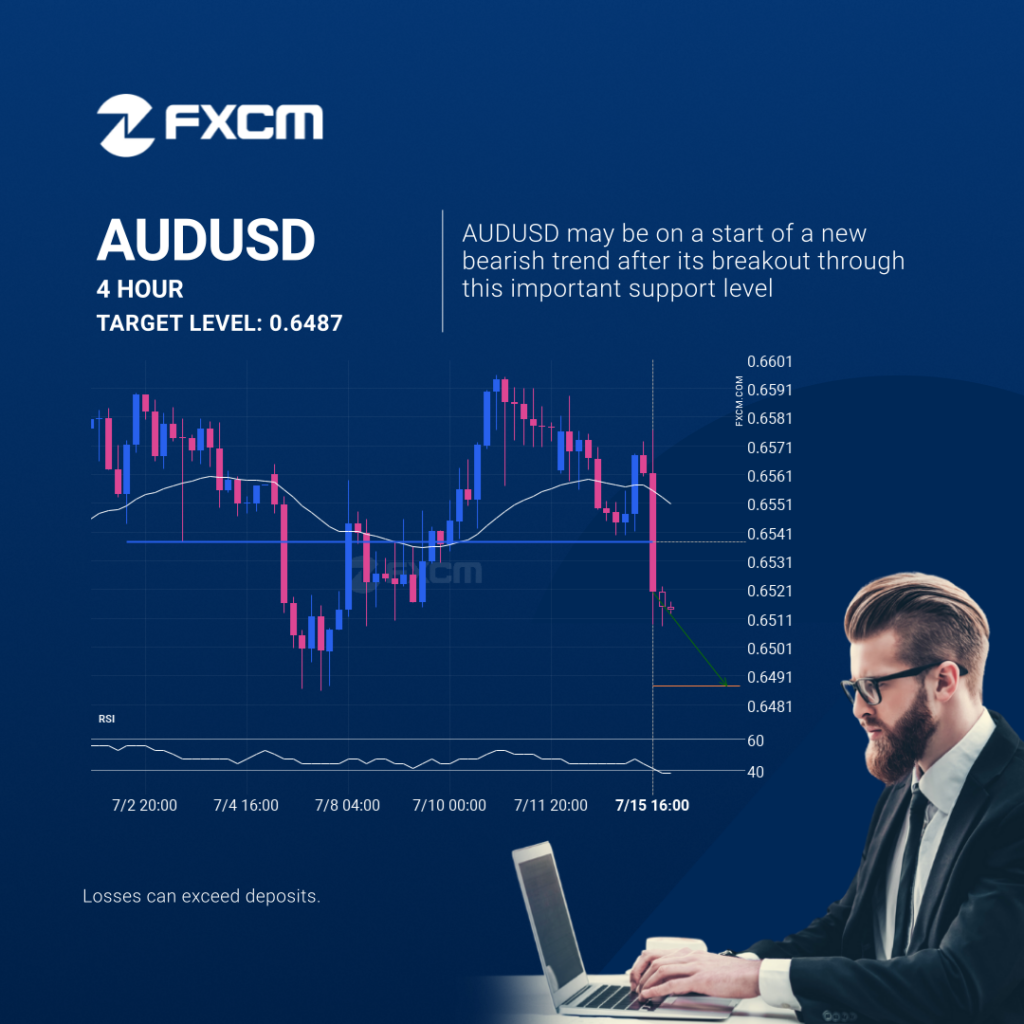
AUDUSD has breached the support line at 0.6537. It may continue the bearish trend towards 0.6487, or, it may prove to be yet another test of this level. Past performance is not an indicator of future results. Losses can exceed deposits.
Confirmed breakout on AUDUSD 4 hour chart
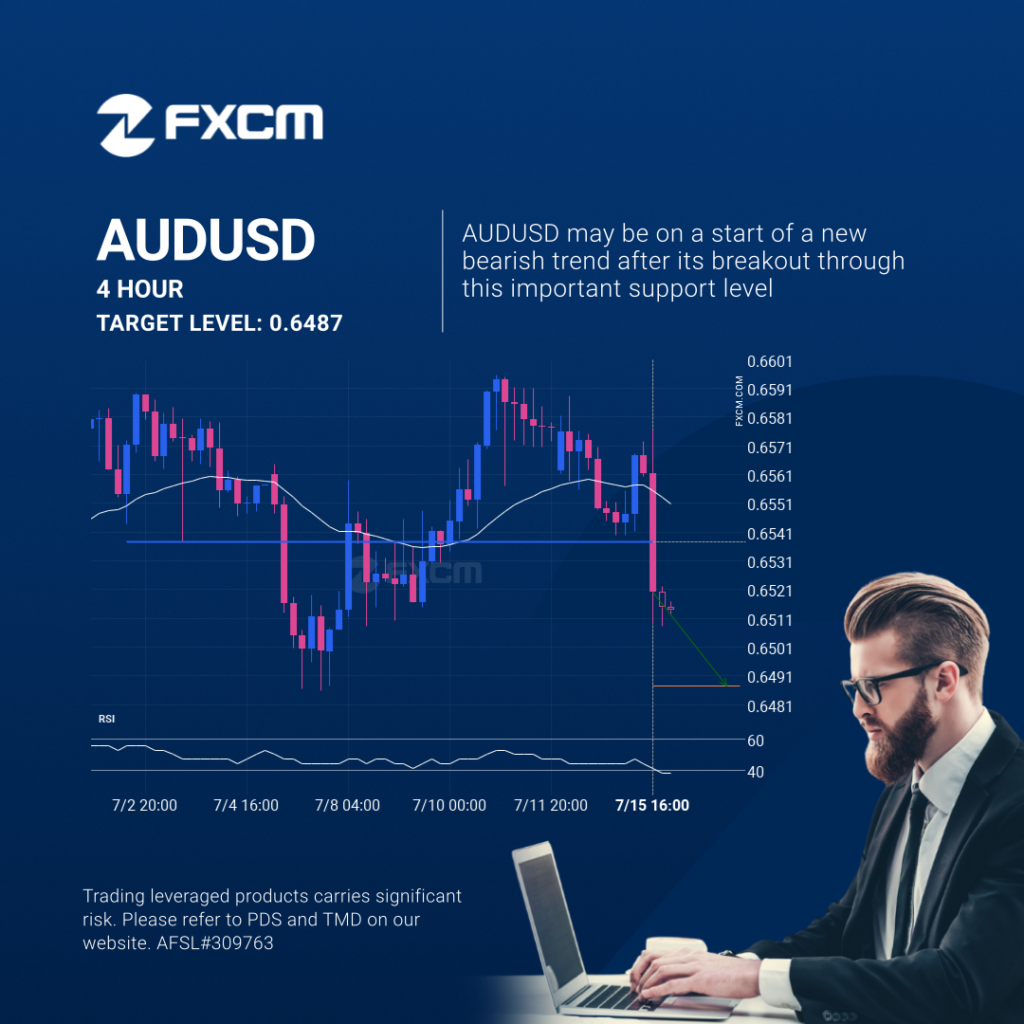
AUDUSD has breached the support line at 0.6537. It may continue the bearish trend towards 0.6487, or, it may prove to be yet another test of this level. Past performance is not an indicator of future results. Trading leveraged products carries significant risk. Please refer to PDS and TMD on our website. AFSL#309763
Should we expect a breakout or a rebound on EURJPY?
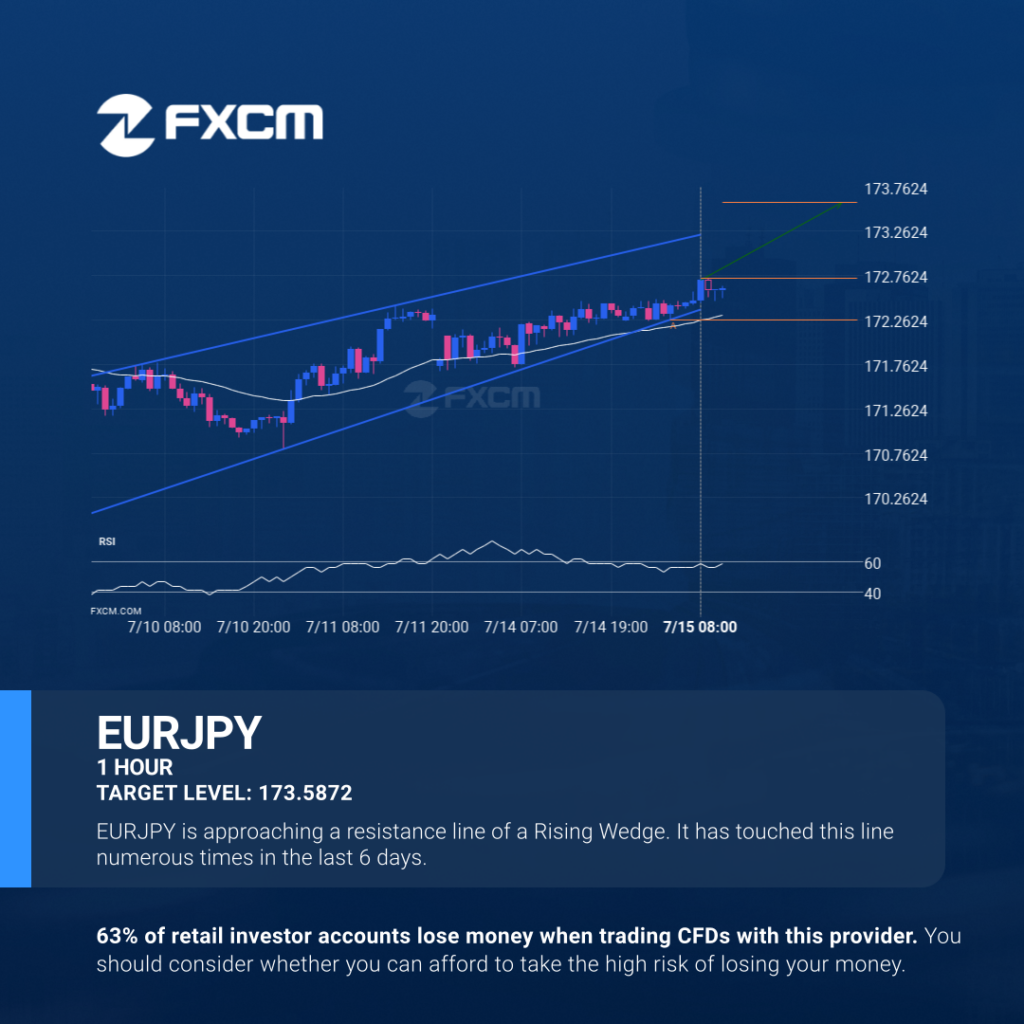
EURJPY is trapped in a Rising Wedge formation, implying that a breakout is Imminent. This is a great trade-setup for both trend and swing traders. It is now approaching a support line that has been tested in the past. Divergence opportunists may be very optimistic about a possible breakout and this may be the start […]
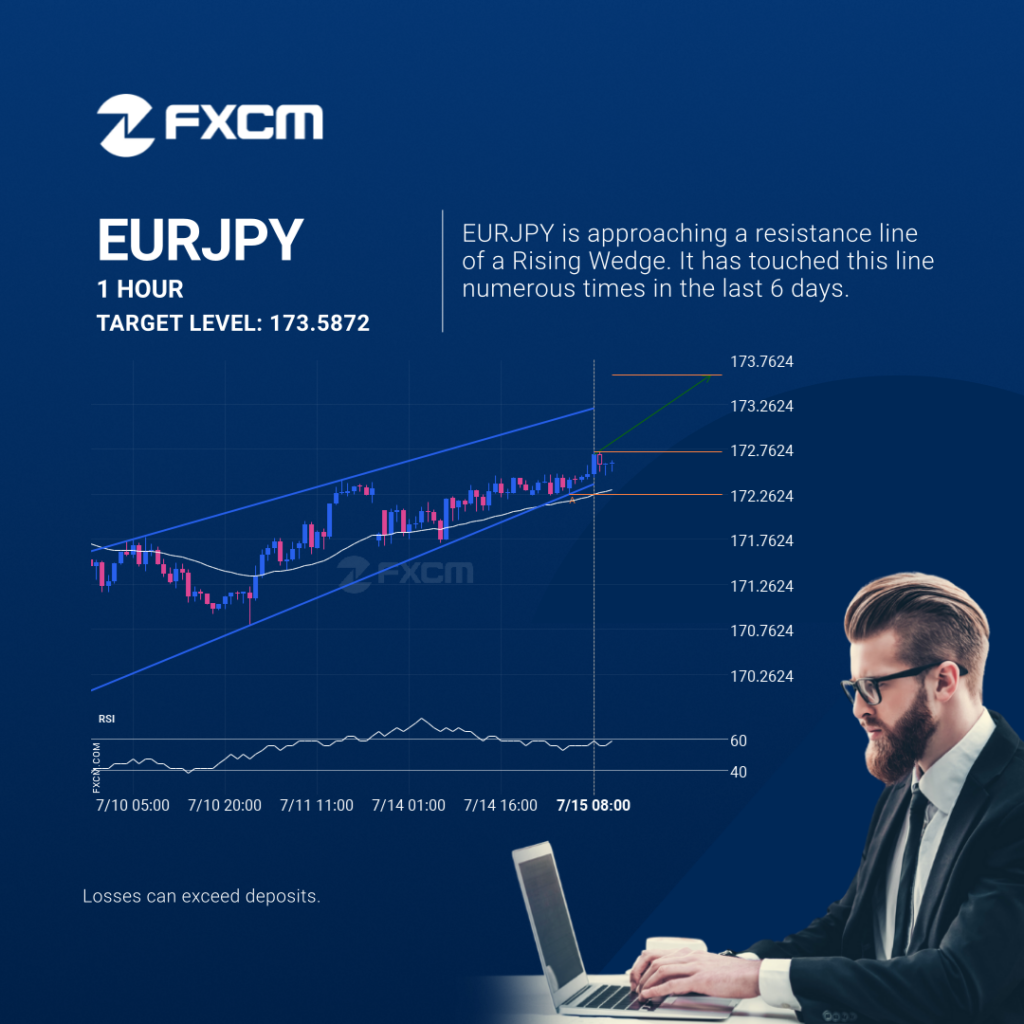
¿Deberíamos esperar una ruptura o una recuperación del EURJPY?

El patrón de Cuña ascendente emergente en su ola final se identificó en el gráfico de 1 Hora de EURJPY. Después de un fuerte movimiento alcista, encontramos que EURJPY se dirige hacia la línea del triángulo superior con una posible resistencia en 173.5872. Si resulta que el nivel de resistencia aguanta, el patrón de Cuña […]
Will ESP35 have enough momentum to break support?

The movement of ESP35 towards the support line of a Descending Triangle is yet another test of the line it reached numerous times in the past. This line test could happen in the next 22 hours, but it is uncertain whether it will result in a breakout through this line, or simply rebound back to […]
Should we expect a breakout or a rebound on EURJPY?
EURJPY is trapped in a Rising Wedge formation, implying that a breakout is Imminent. This is a great trade-setup for both trend and swing traders. It is now approaching a support line that has been tested in the past. Divergence opportunists may be very optimistic about a possible breakout and this may be the start […]