Possible breach of support level by GBPUSD
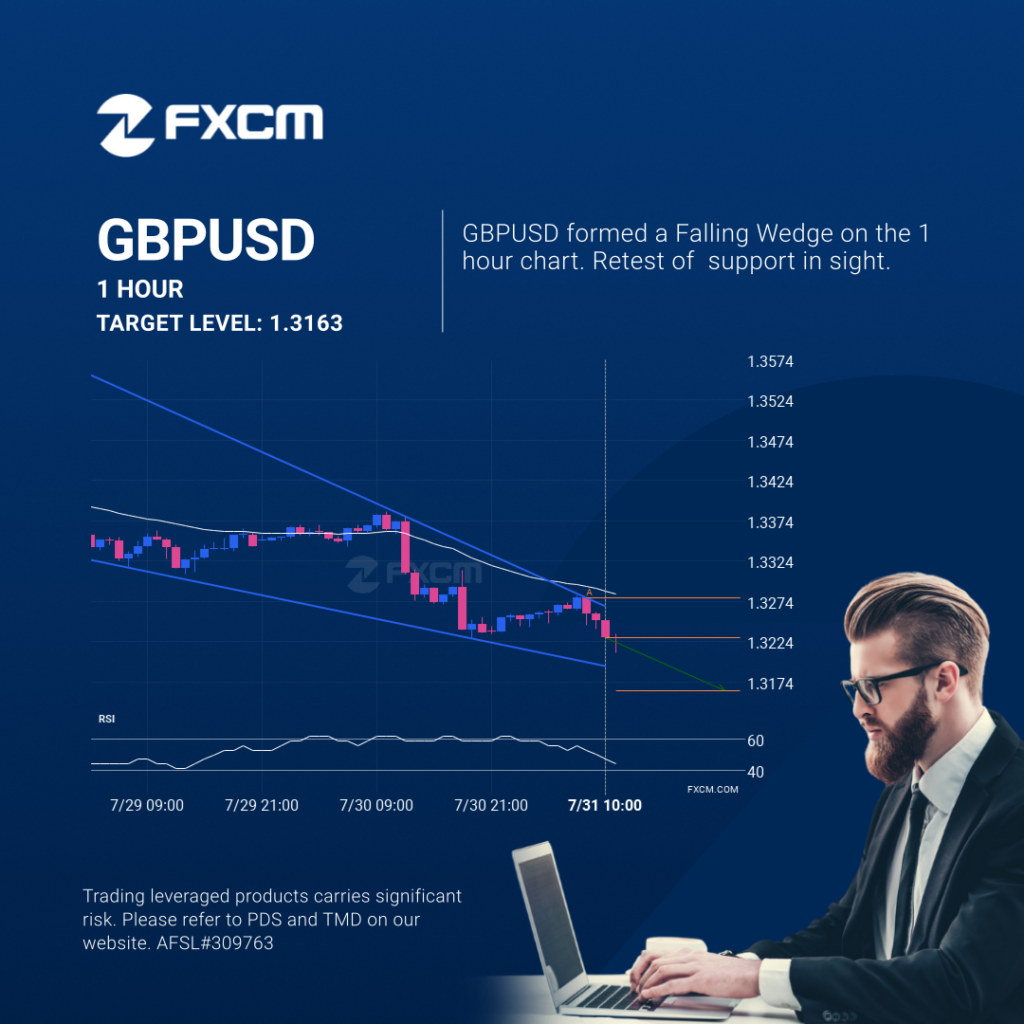
GBPUSD is heading towards the support line of a Falling Wedge and could reach this point within the next 15 hours. It has tested this line numerous times in the past, and this time could be no different from the past, ending in a rebound instead of a breakout. If the breakout doesn’t happen, we […]
A potential bearish movement on ESP35
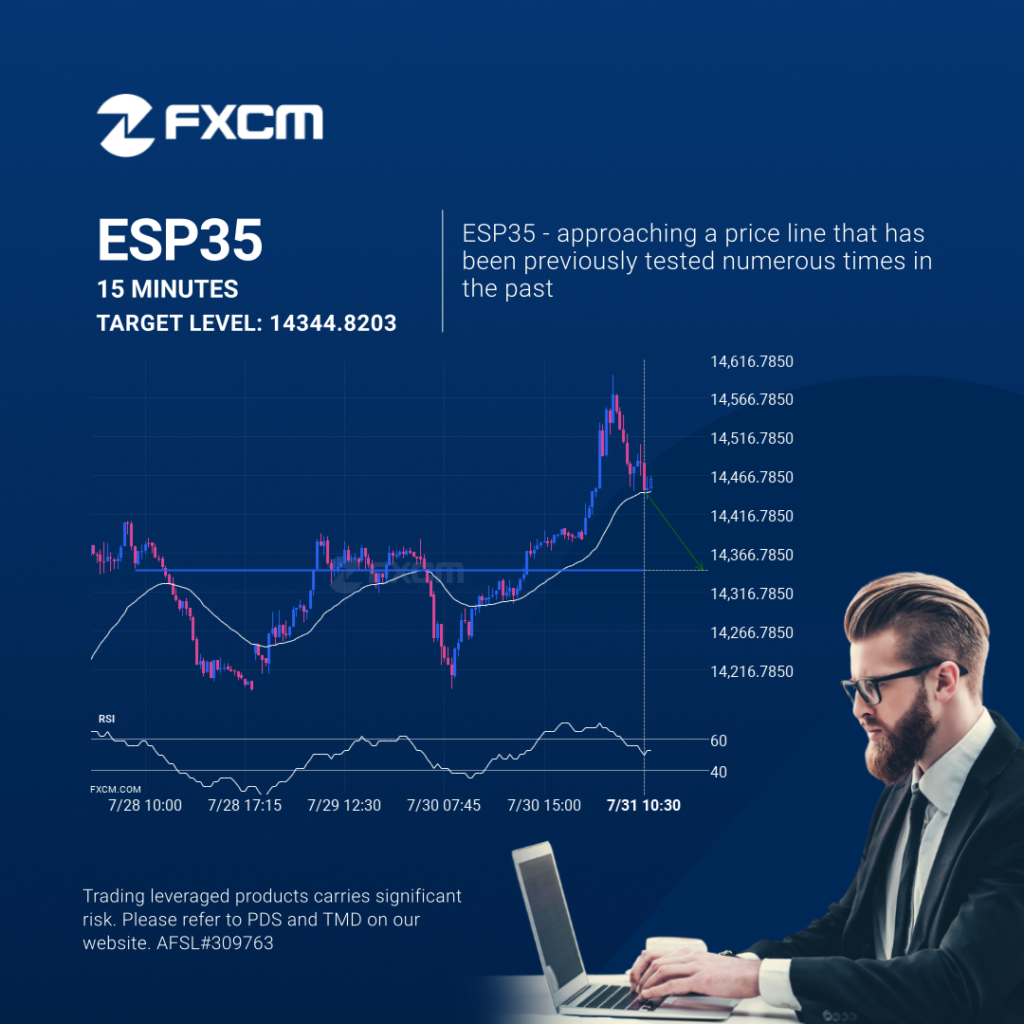
ESP35 is heading towards a line of 14344.8203. If this movement continues, the price of ESP35 could test 14344.8203 within the next 9 hours. But don’t be so quick to trade, it has tested this line numerous times in the past, so this movement could be short-lived and end up rebounding. Past performance is not […]
Un posible movimiento bajista en ESP35
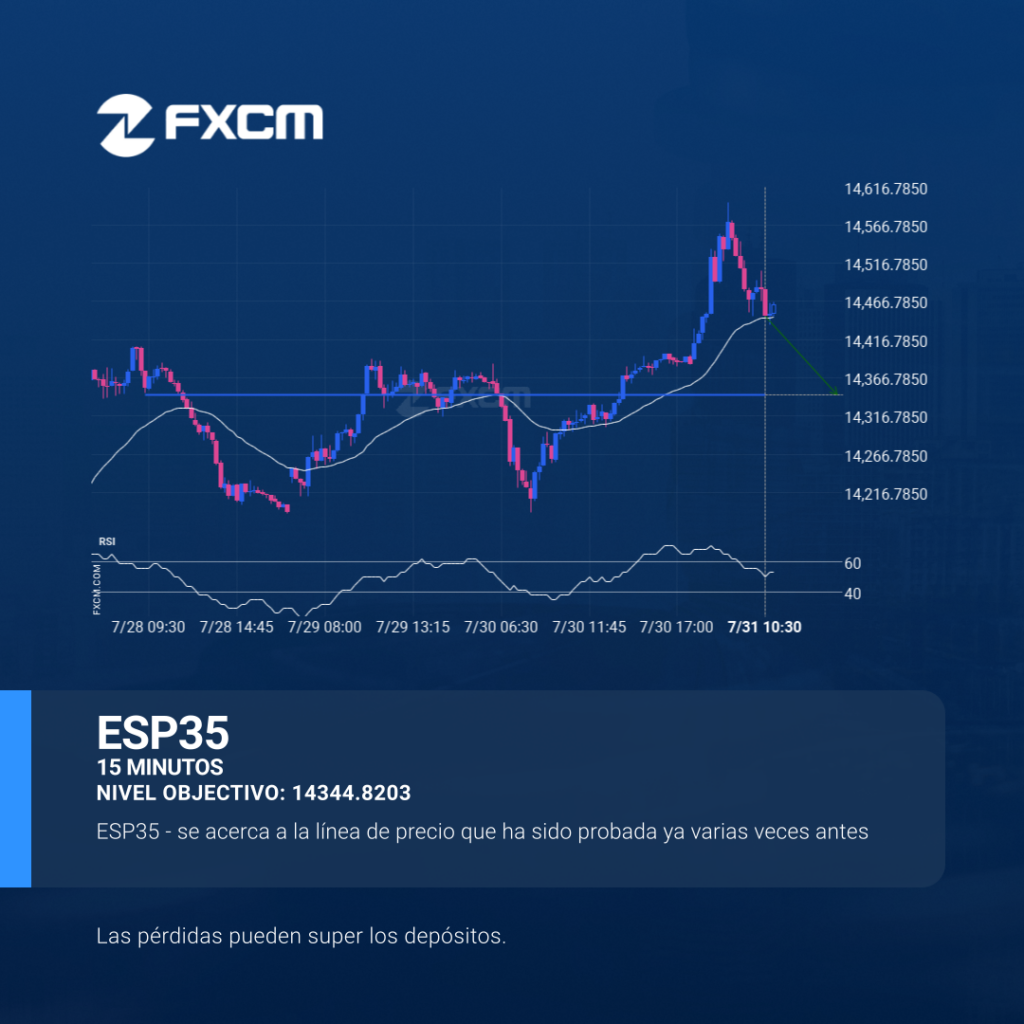
El ESP35 avanza hacia la línea de 14344.8203. Si este movimiento se mantiene, el precio del ESP35 podría probar el nivel de 14344.8203 en un plazo de 9 horas. Pero no se apresure a la hora de operar, porque el par ha probado esta línea en numerosas ocasiones durante el pasado, por lo que este […]
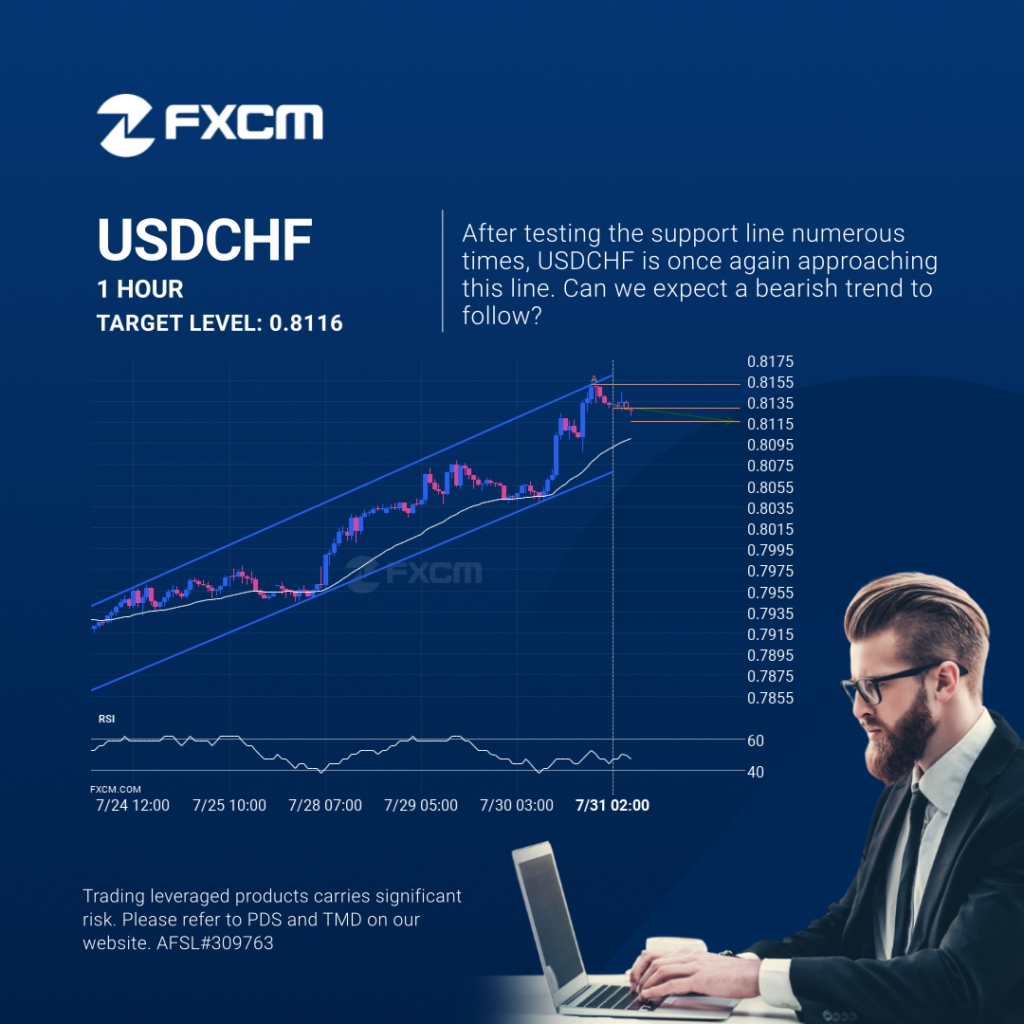
Inminente recuperación o irrupción del USDCHF
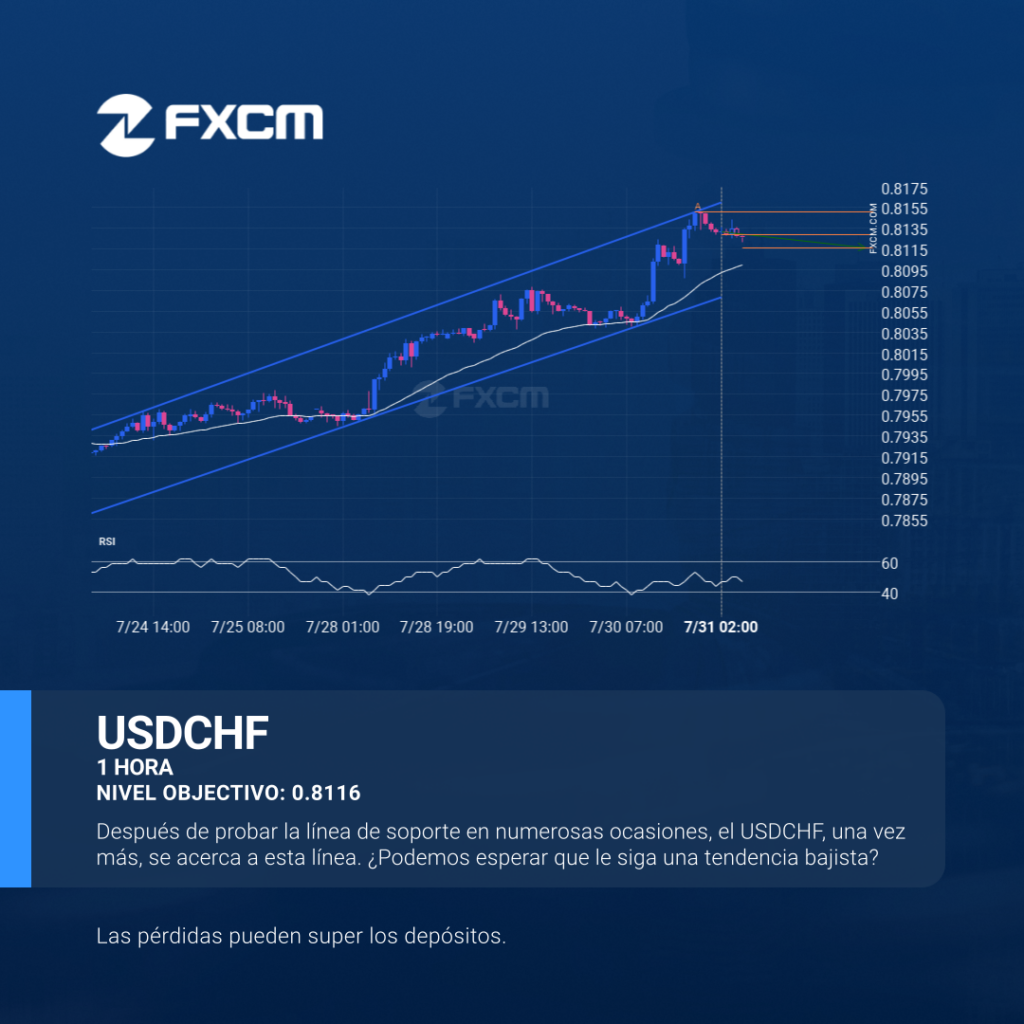
El USDCHF se dirige hacia la línea de soporte de un Canal alcista y puede alcanzar este punto en las próximas 2 días. Ha probado esta línea ya en numerosas ocasiones en el pasado, y esta vez no tendría porqué ser diferente y terminar con una recuperación en lugar de una irrupción. Si ésta última […]
Either a rebound or a breakout imminent on USDCHF
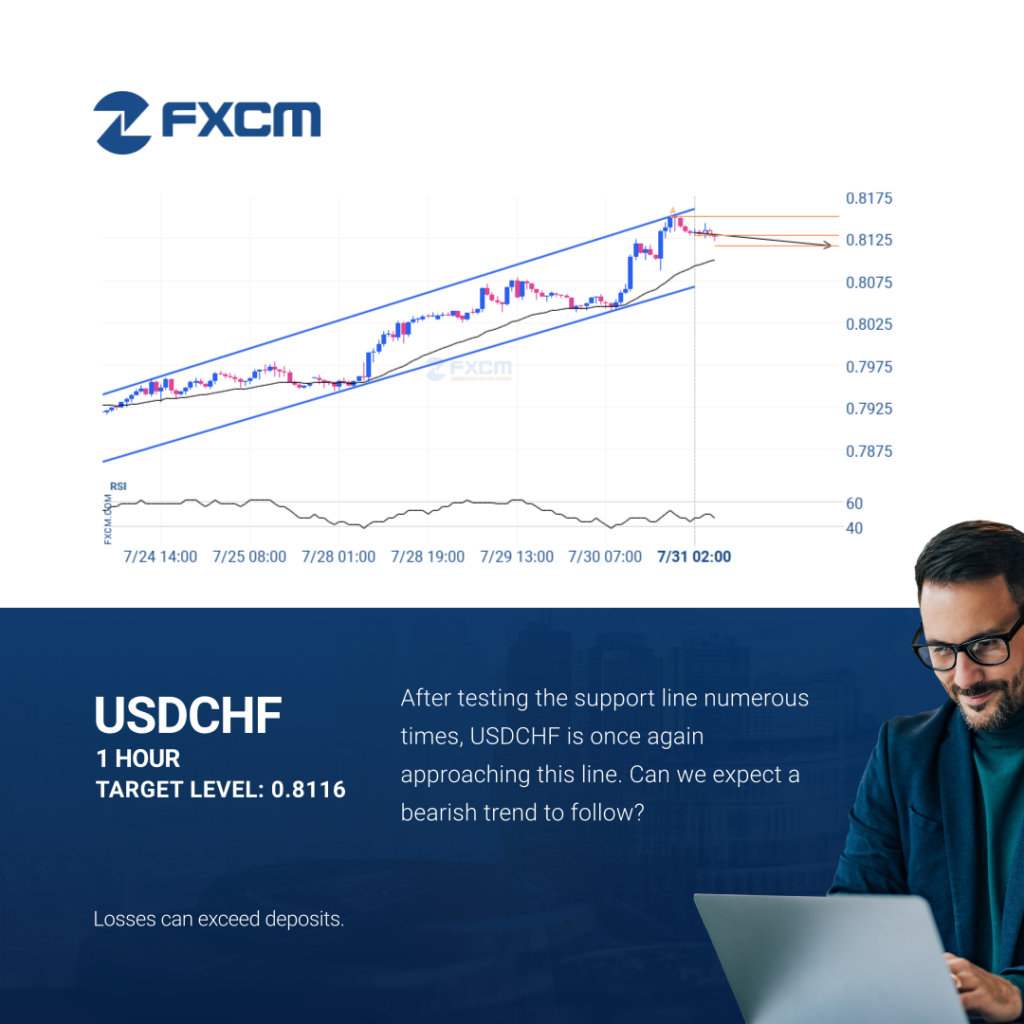
USDCHF is heading towards the support line of a Channel Up and could reach this point within the next 2 days. It has tested this line numerous times in the past, and this time could be no different from the past, ending in a rebound instead of a breakout. If the breakout doesn’t happen, we […]
Either a rebound or a breakout imminent on USDCHF
USDCHF is heading towards the support line of a Channel Up and could reach this point within the next 2 days. It has tested this line numerous times in the past, and this time could be no different from the past, ending in a rebound instead of a breakout. If the breakout doesn’t happen, we […]
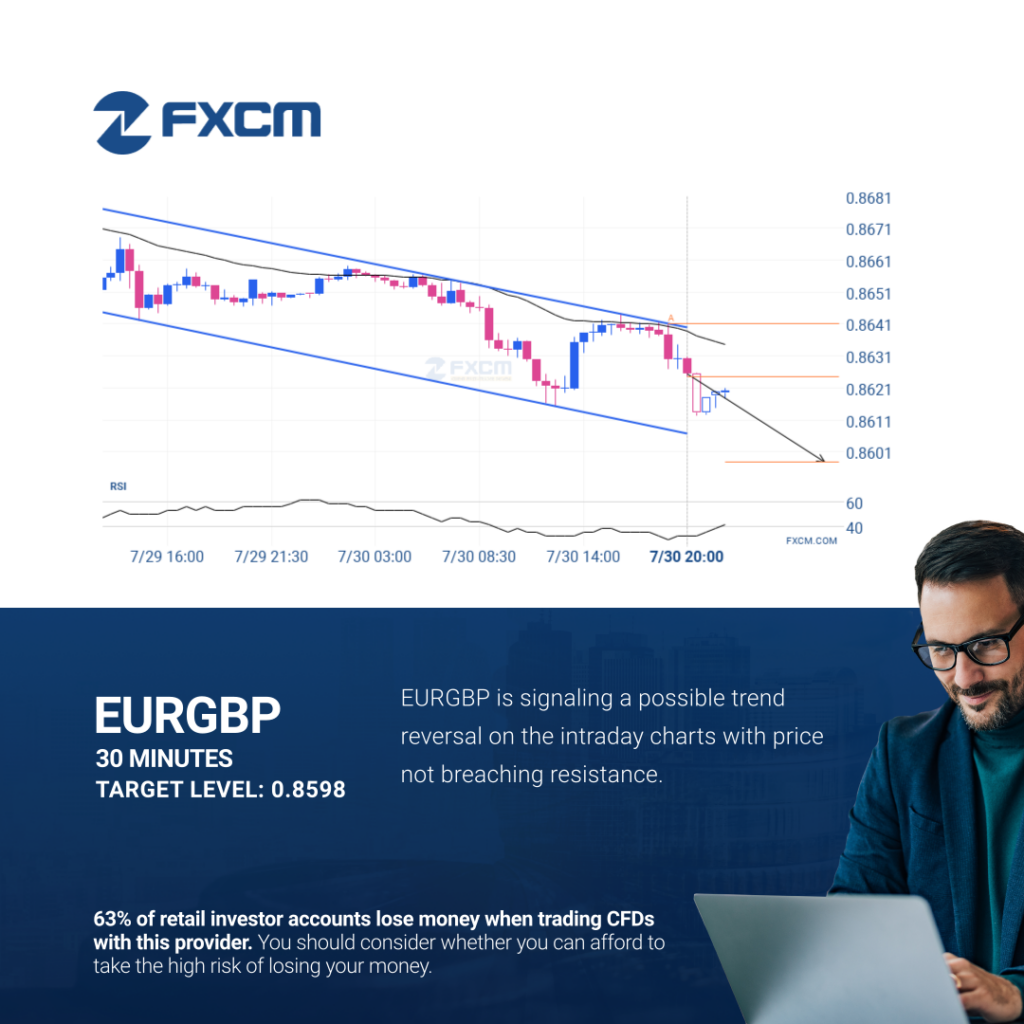
A potential bearish movement on EURGBP
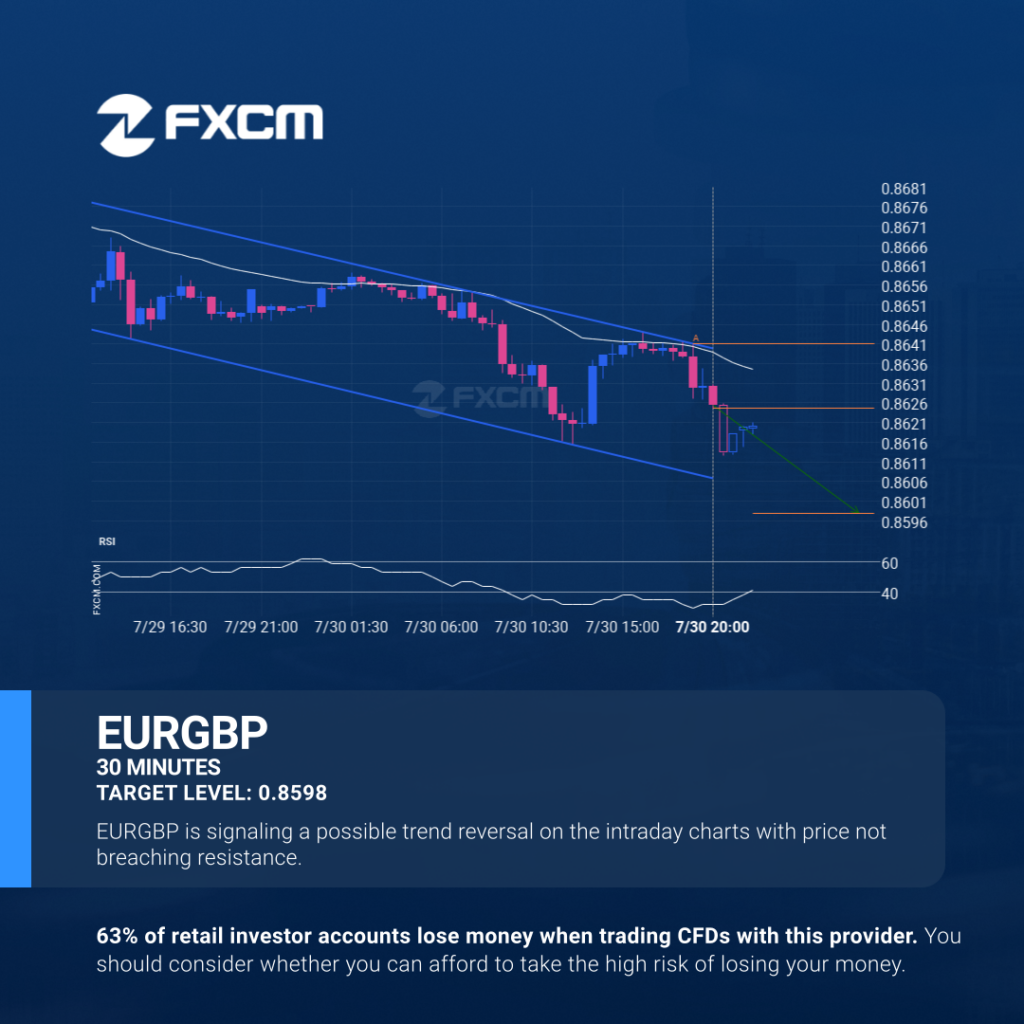
EURGBP is heading towards the support line of a Channel Down and could reach this point within the next 7 hours. It has tested this line numerous times in the past, and this time could be no different from the past, ending in a rebound instead of a breakout. If the breakout doesn’t happen, we […]
EURGBP – Patrón de gráfico Continuation – Canal bajista
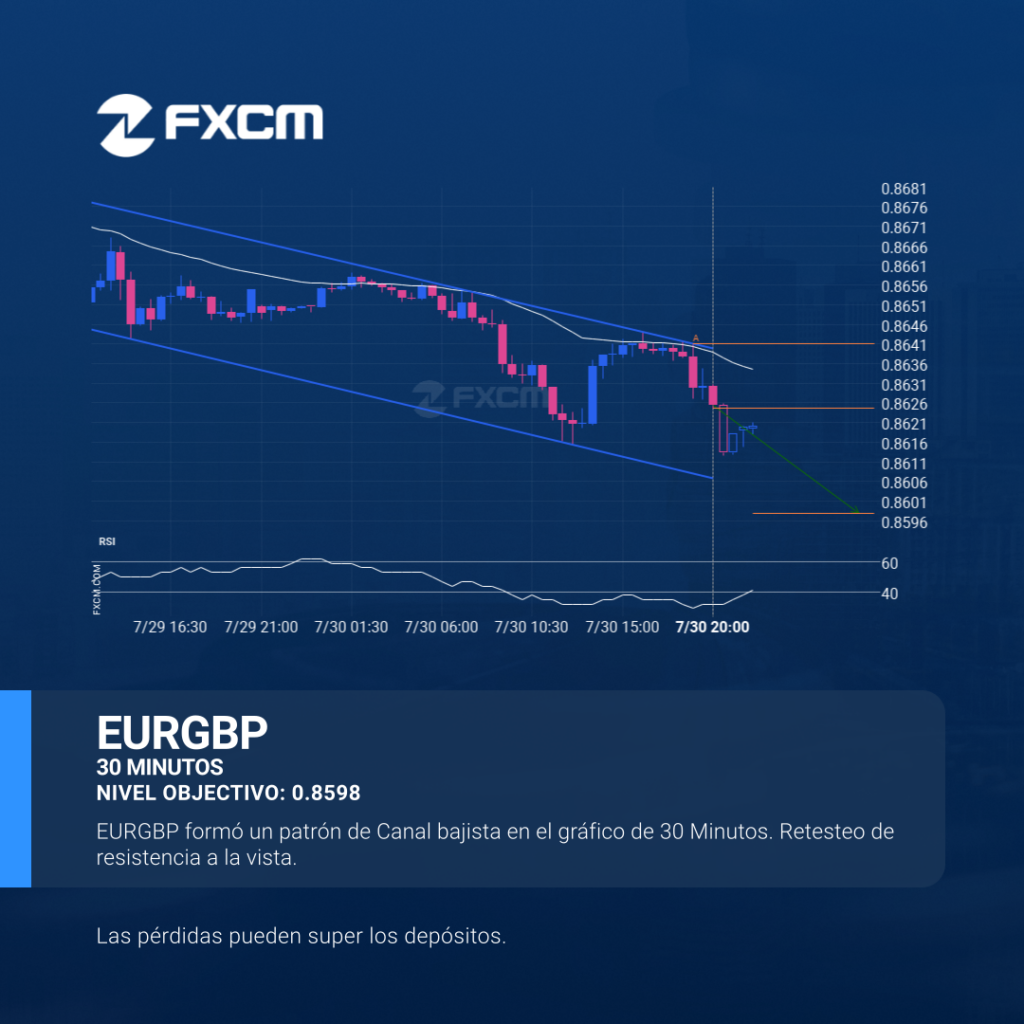
El EURGBP se dirige hacia la línea de soporte de un Canal bajista y puede alcanzar este punto en las próximas 7 horas. Ha probado esta línea ya en numerosas ocasiones en el pasado, y esta vez no tendría porqué ser diferente y terminar con una recuperación en lugar de una irrupción. Si ésta última […]
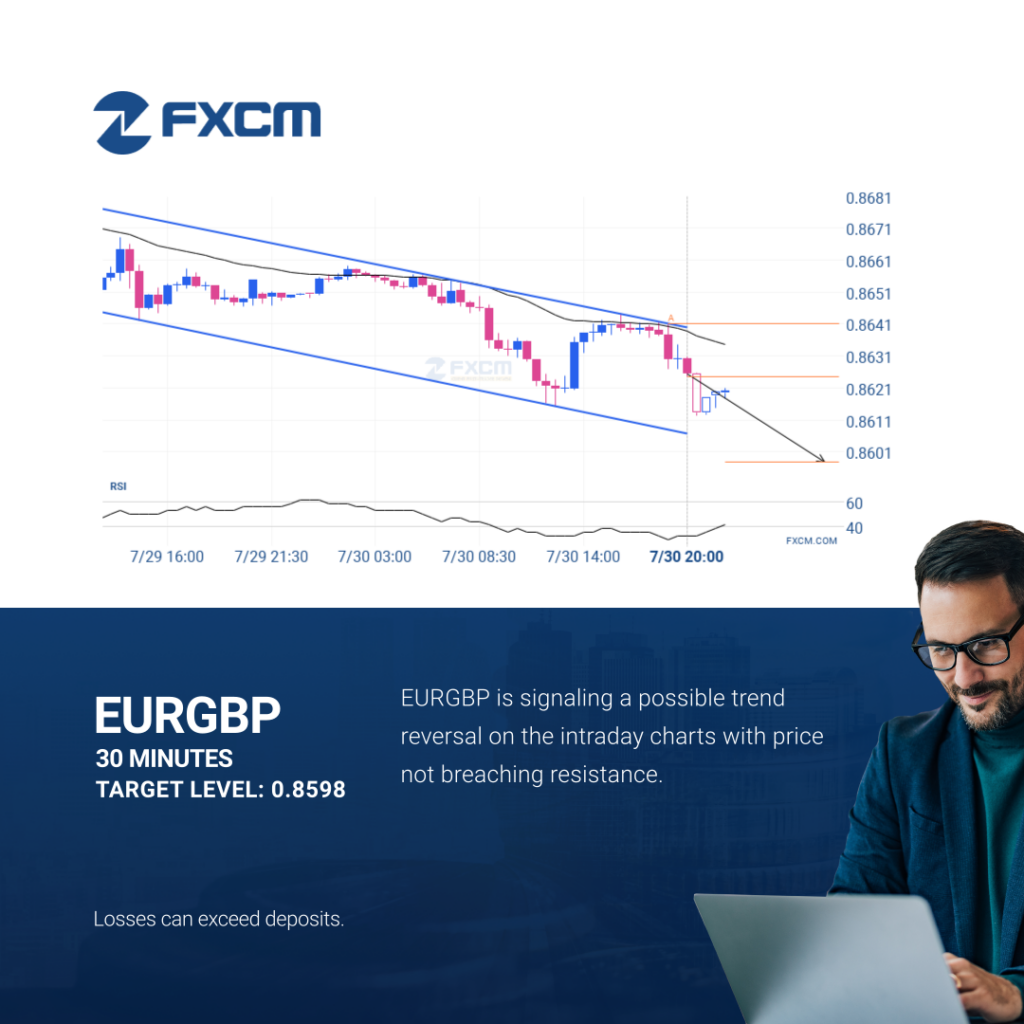
A potential bearish movement on EURGBP
EURGBP is heading towards the support line of a Channel Down and could reach this point within the next 7 hours. It has tested this line numerous times in the past, and this time could be no different from the past, ending in a rebound instead of a breakout. If the breakout doesn’t happen, we […]