A potential bearish movement on EURJPY
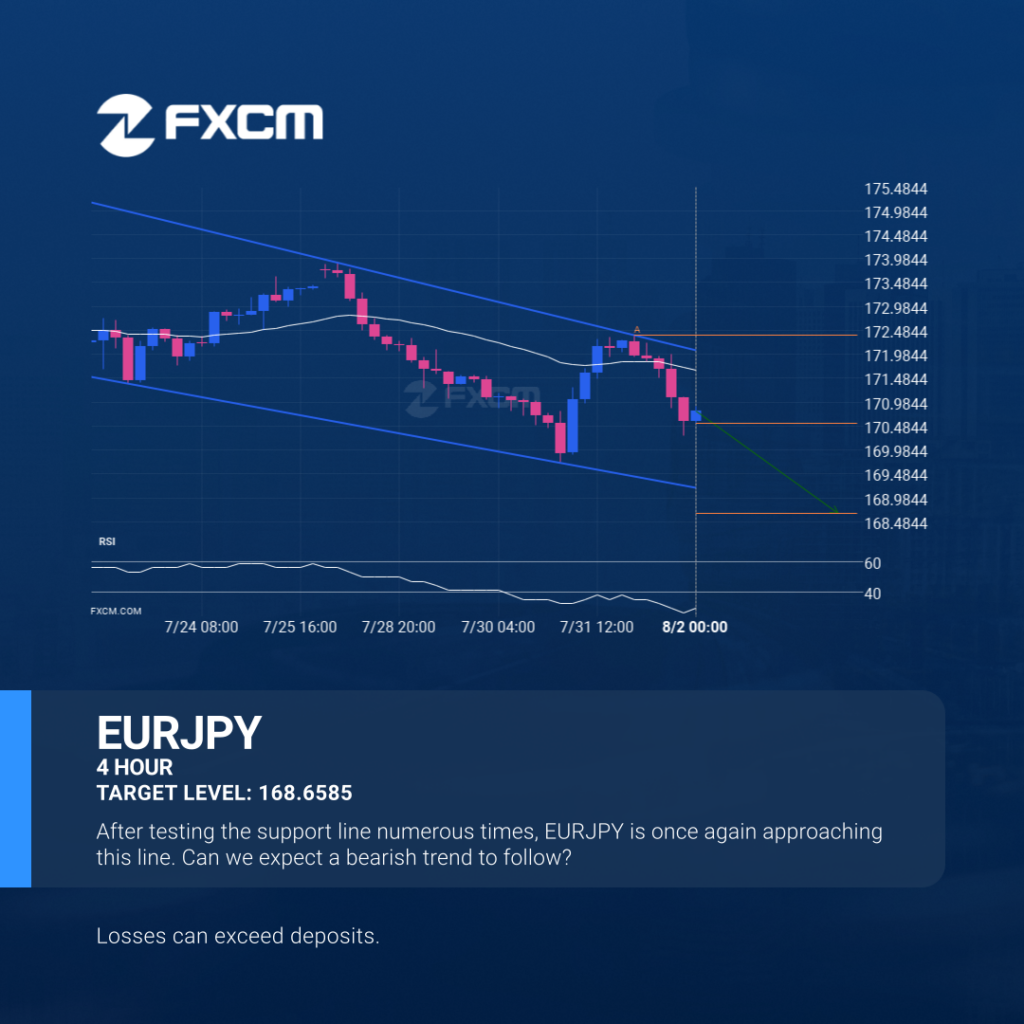
Emerging Channel Down pattern in its final wave was identified on the EURJPY 4 hour chart. After a strong bearish run, we find EURJPY heading towards the upper triangle line with a possible resistance at 168.6585. If the support shows to hold, the Channel Down pattern suggests a rebound back towards current levels. Past performance […]
Should we expect a breakout or a rebound on USDCHF?
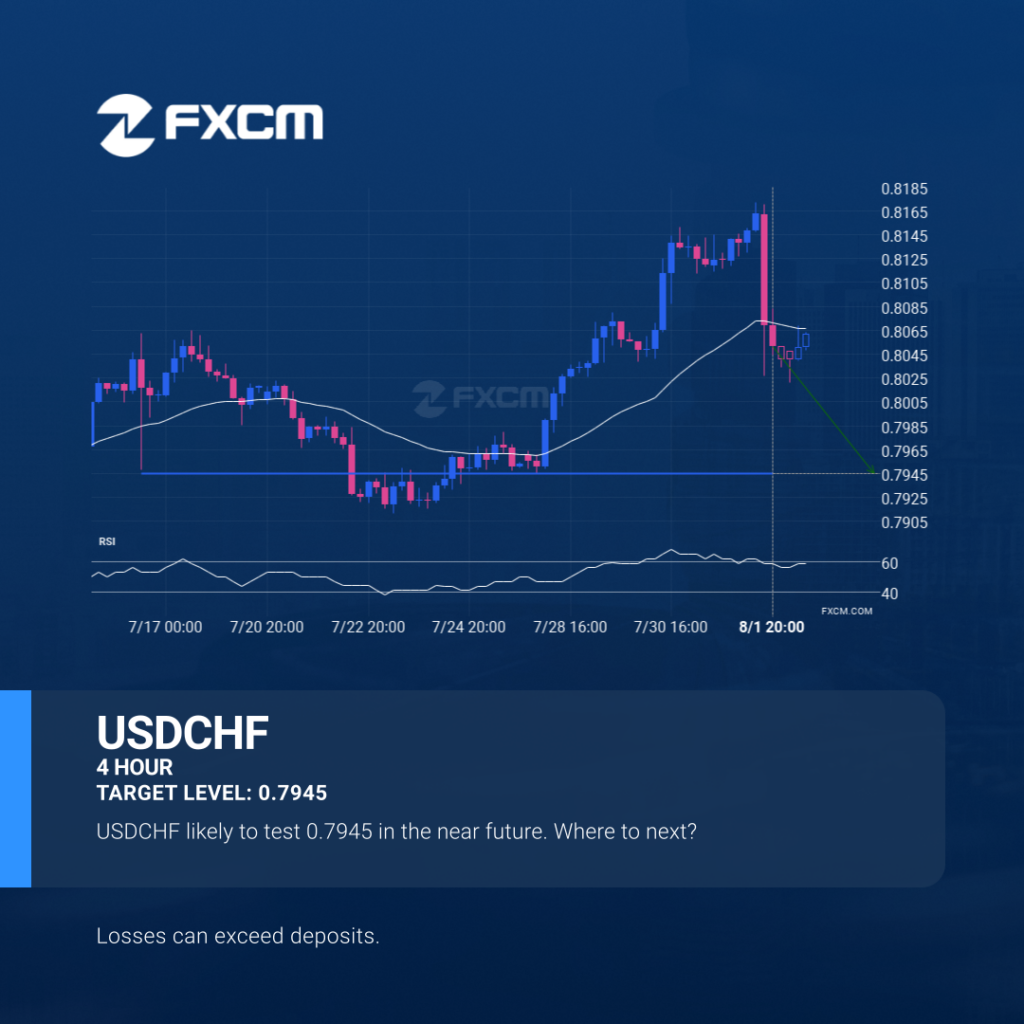
A strong support level has been identified at 0.7945 on the 4 hour USDCHF chart. USDCHF is likely to test it soon. Past performance is not an indicator of future results. Losses can exceed deposits.
Possibility of big movement expected on HKG33
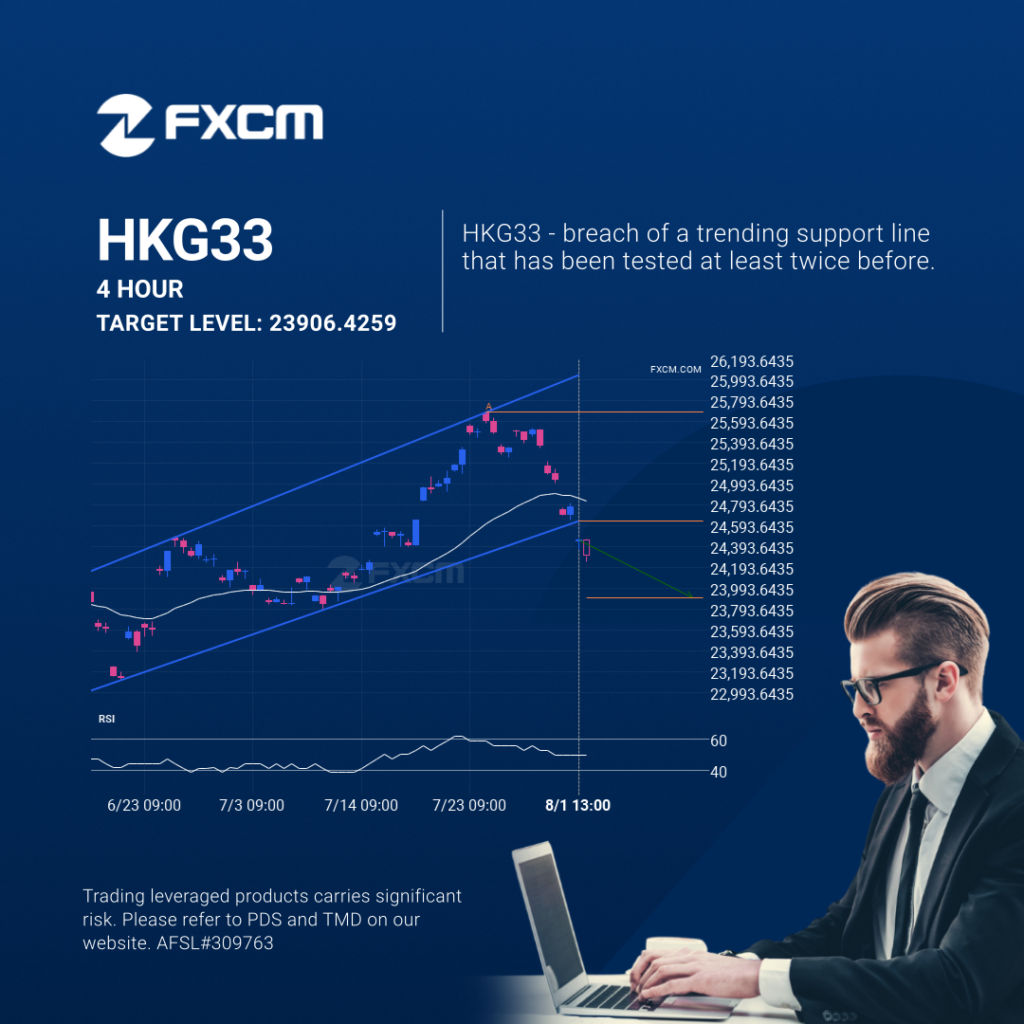
You would be well advised to confirm the breakout that has just occurred – do you believe the move through support to be significant? Do you have confirming indicators that the price momentum will continue? If so, look for a target of 23906.4259 but consider reducing the size of your position as the price gets […]
A potential bearish movement on EURJPY
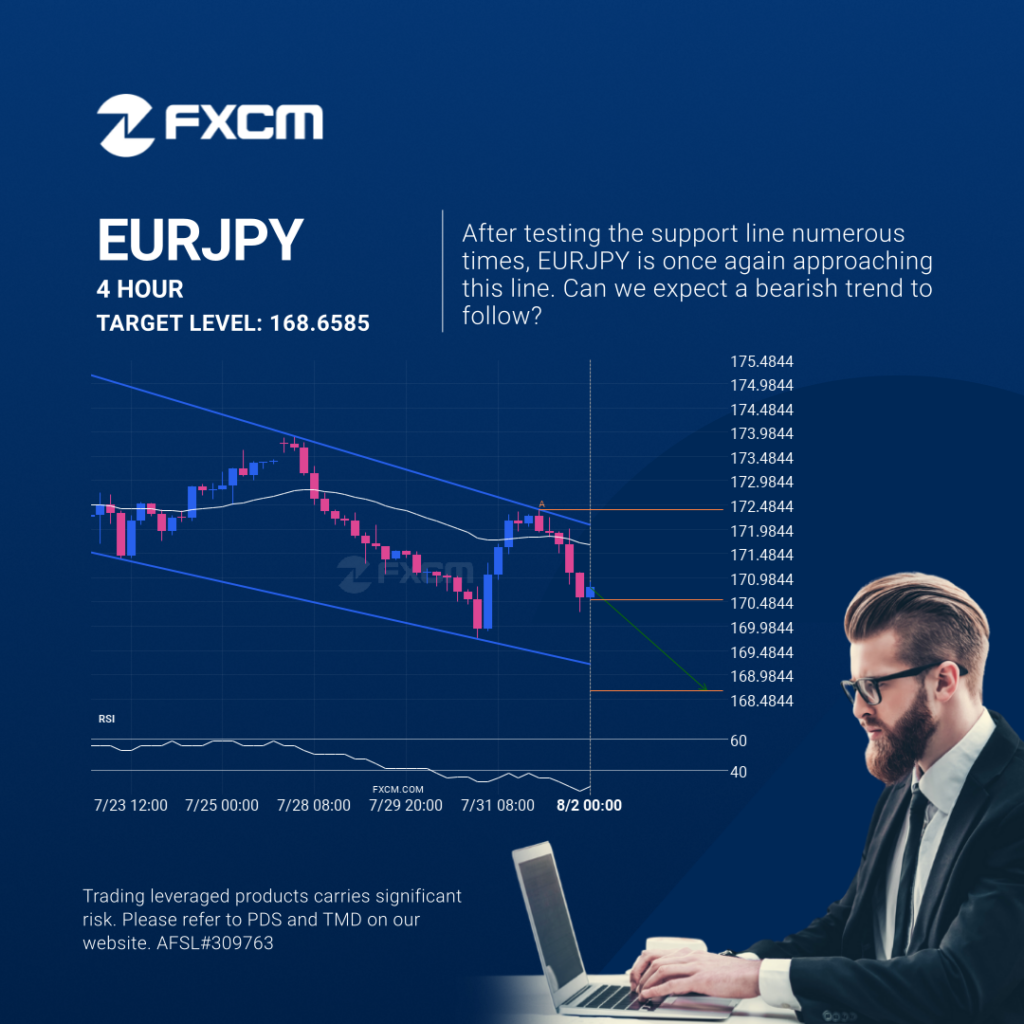
Emerging Channel Down pattern in its final wave was identified on the EURJPY 4 hour chart. After a strong bearish run, we find EURJPY heading towards the upper triangle line with a possible resistance at 168.6585. If the support shows to hold, the Channel Down pattern suggests a rebound back towards current levels. Past performance […]
EURJPY – Patrón de gráfico Continuation – Canal bajista
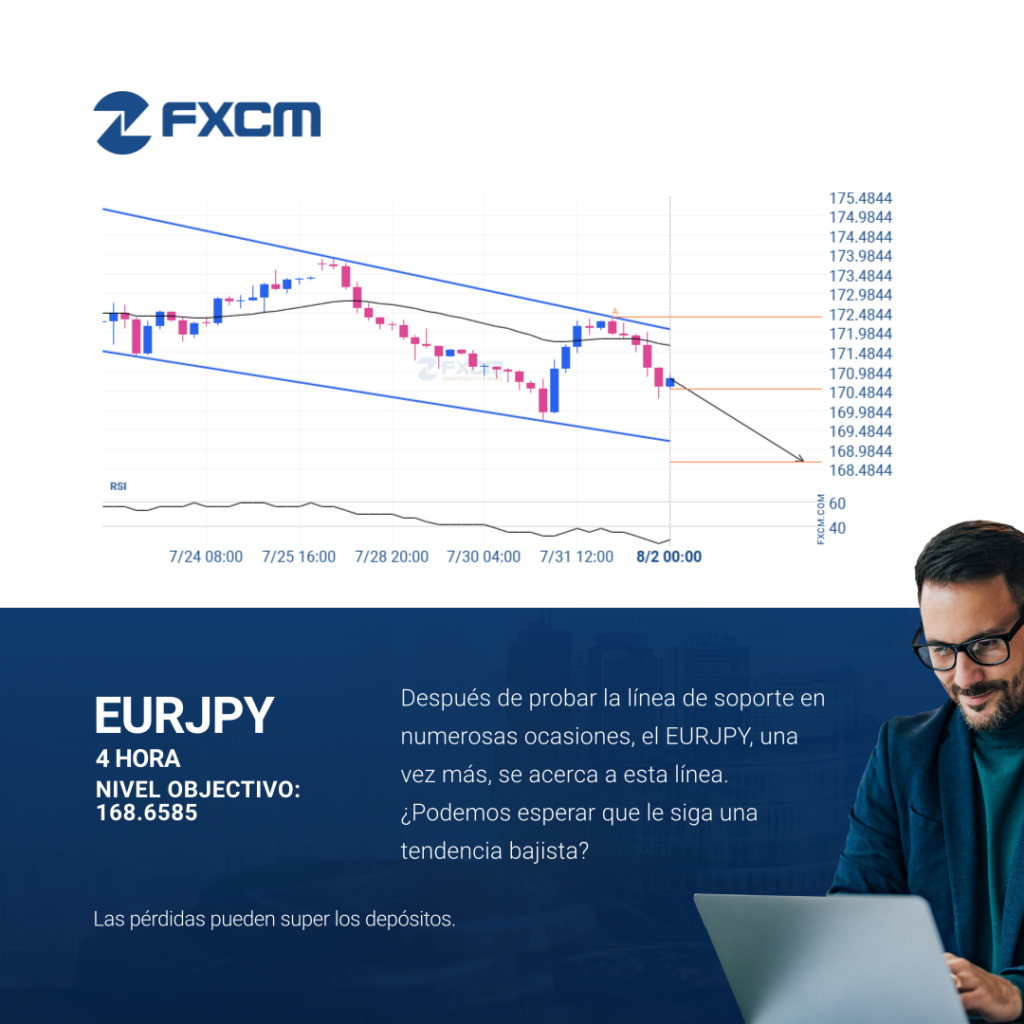
Se detectó un patrón de Canal bajista emergente en EURJPY en el gráfico de 4 Hora. Hay un posible movimiento hacia 168.6585 en las próximas velas. Una vez que alcance el nivel de resistencia, puede continuar su movimiento bajista o retroceder a los niveles de precios actuales. El rendimiento pasado no es indicativo de resultados […]
¿Deberíamos esperar una irrupción o una recuperación del USDCHF?
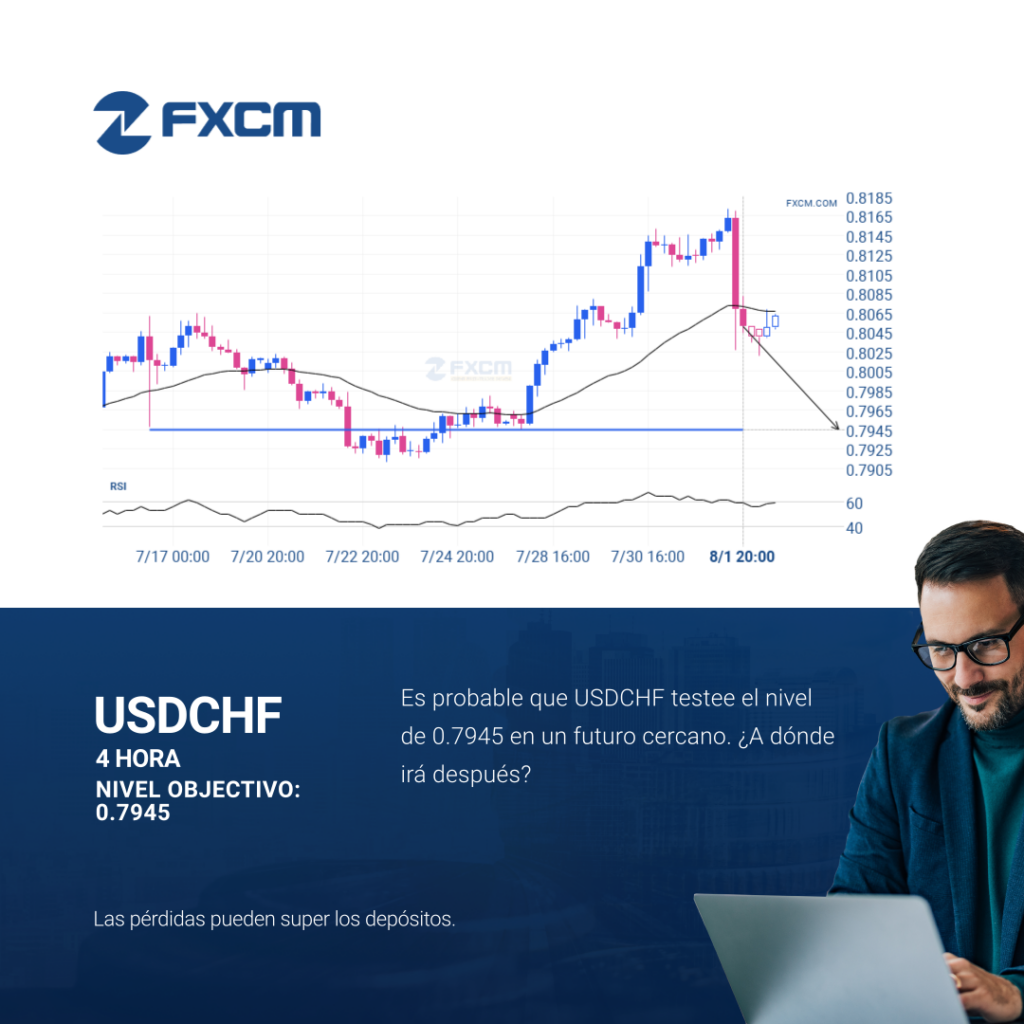
Se identificó un fuerte nivel de soporte en 0.7945 en el gráfico de 4 Hora de USDCHF. Es probable que USDCHF lo testee pronto. El rendimiento pasado no es indicativo de resultados futuros. Las pérdidas pueden exceder los fondos depositados.
Should we expect a breakout or a rebound on USDCHF?
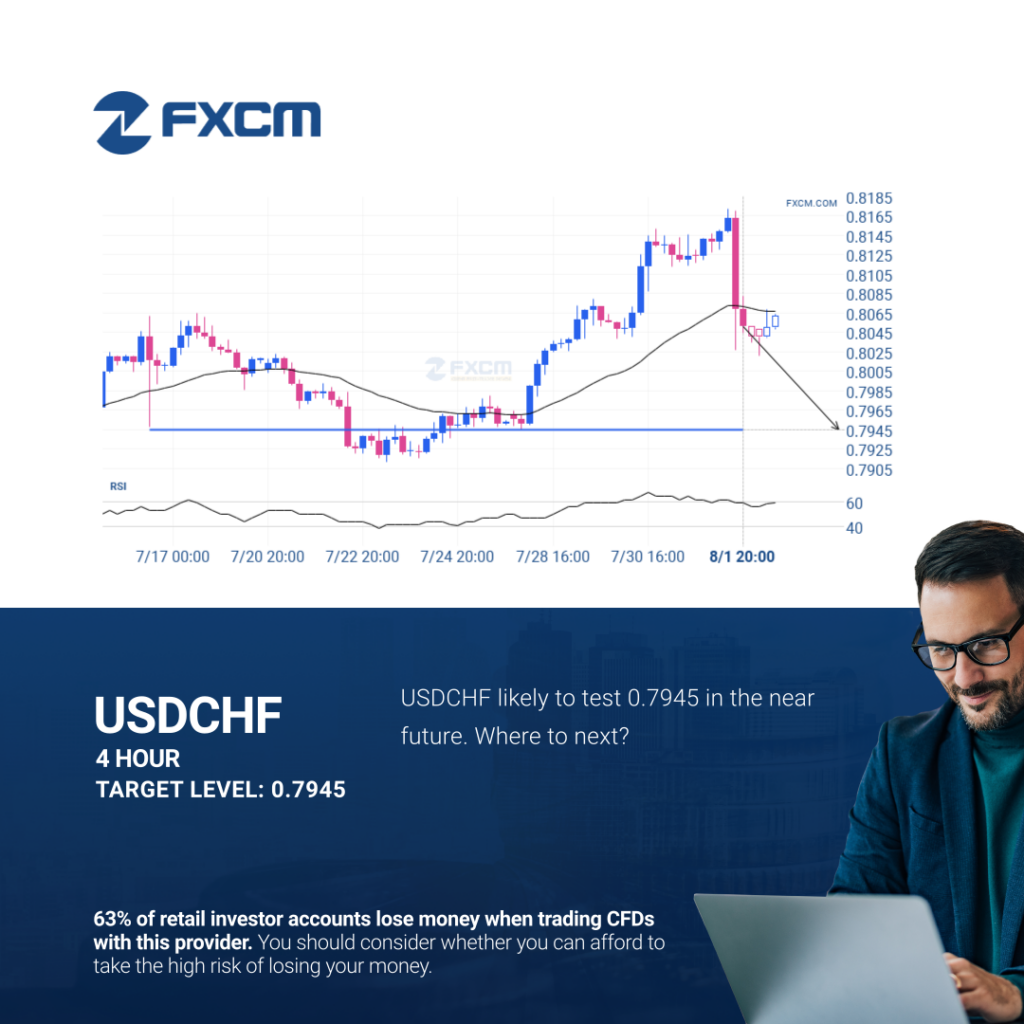
A strong support level has been identified at 0.7945 on the 4 hour USDCHF chart. USDCHF is likely to test it soon. Past performance is not an indicator of future results. Trading leveraged products carries significant risk. Please refer to PDS and TMD on our website. AFSL#309763
Se espera la posibilidad de un gran movimiento en el HKG33

Le recomendamos que confirme la rotura que acaba de ocurrir. ¿Cree que el movimiento a través del nivel de soporte es significativo? ¿Tiene indicadores que confirmen que el impulso de los precios continuará? Si es así, busque objetivo en 23906.4259, pero considere reducir el tamaño de su posición a medida que el precio se acerque […]
¿Tendrá el BTCUSD suficiente impulso como para irrumpir la resistencia?
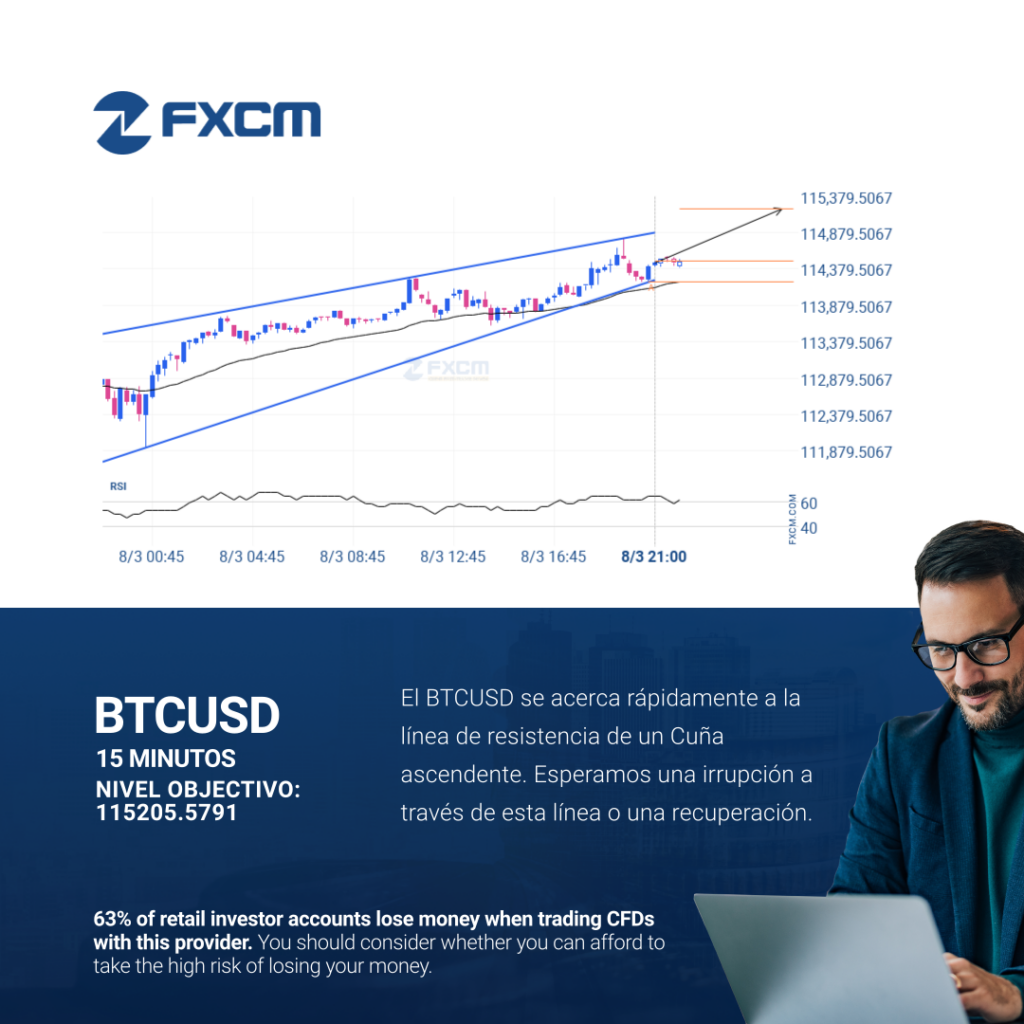
El BTCUSD avanza hacia la línea de resistencia de un Cuña ascendente, que ya ha probado varias veces en el pasado. Hemos visto un retroceso antes desde esta línea, así que en esta etapa no está claro si atravesará esta línea o se recuperará como lo ha hecho anteriormente. Si el BTCUSD continúa con esta […]
Should we expect a breakout or a rebound on ESP35?
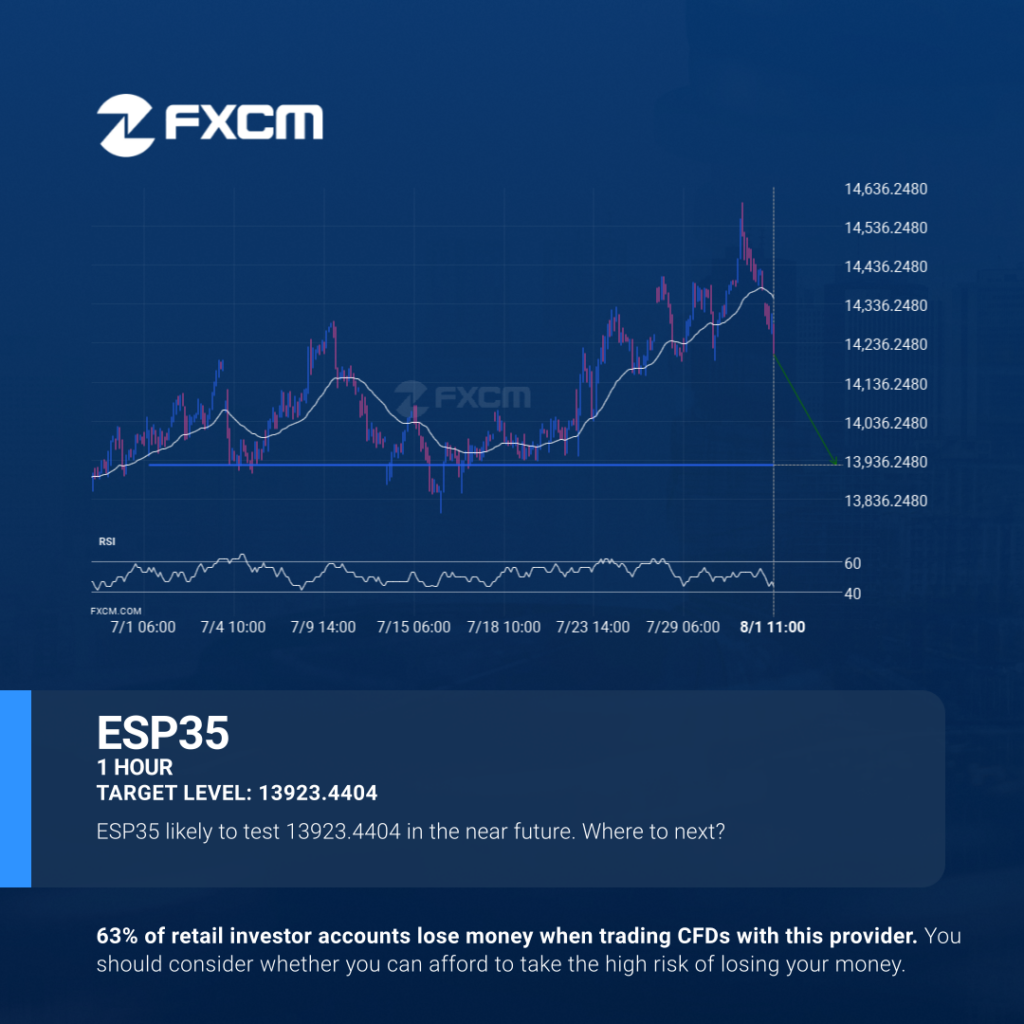
The price of ESP35 in heading back to the support area. It is possible that it will struggle to break through it and move back in the other direction. The price may eventually break through, but typically the price retreats from the level a number of times before doing so. Past performance is not an […]