Big move on XAUUSD
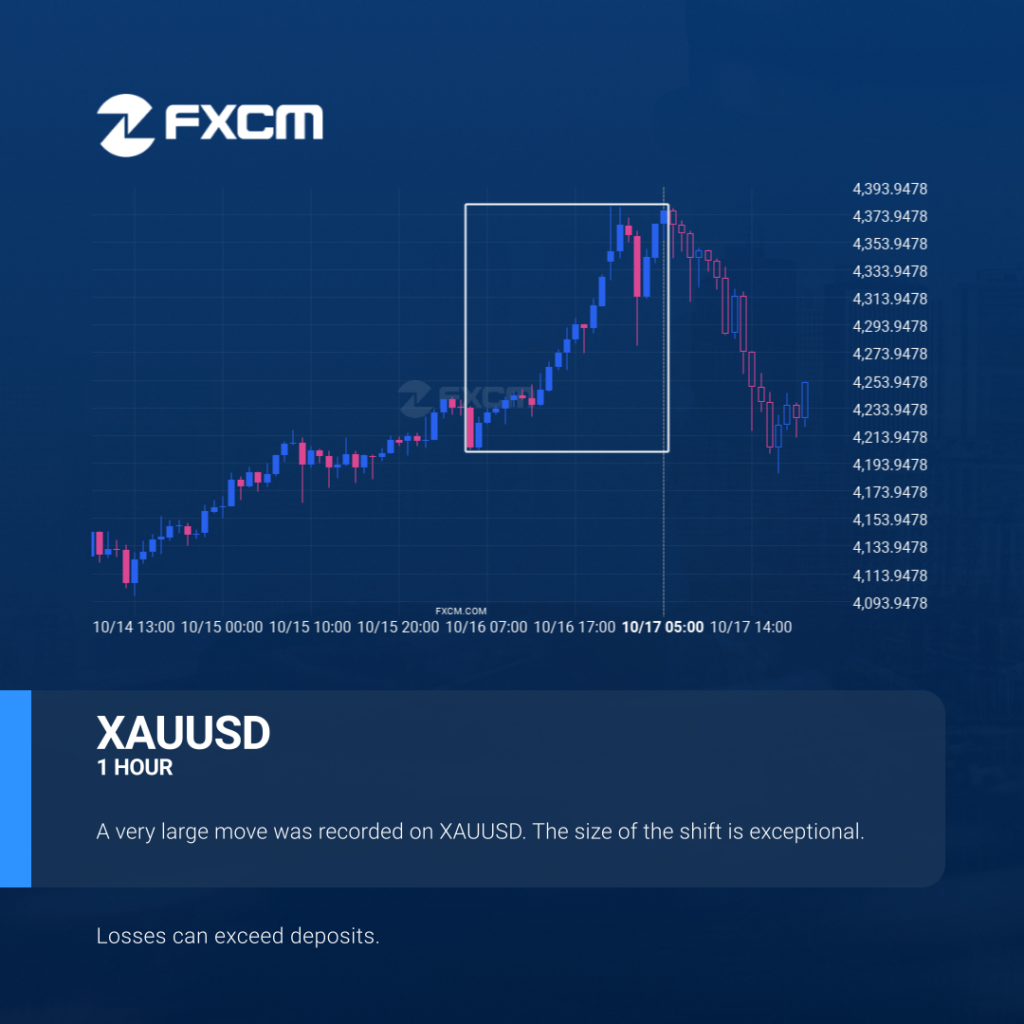
An unexpected large move occurred on XAUUSD 1 hour chart, starting at 4204.975 and reaching 4376.485. It stands out in recent trading activity. Past performance is not an indicator of future results. Losses can exceed deposits.
Gran movimiento en XAUUSD
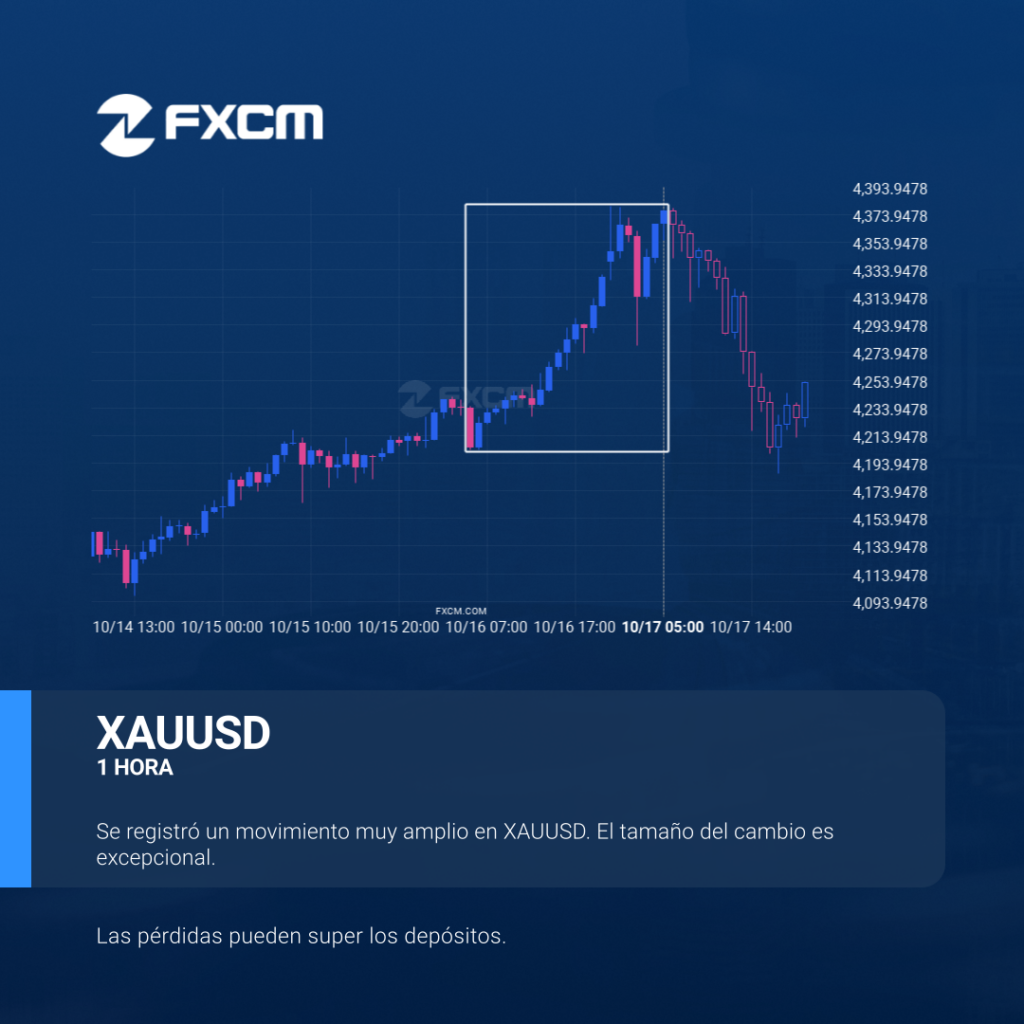
Se produjo un movimiento inesperado de gran magnitud en el gráfico 1 Hora de XAUUSD, comenzando en 4204.975 y alcanzando 4376.485. Destaca claramente en la actividad reciente. El rendimiento pasado no es indicativo de resultados futuros. Las pérdidas pueden exceder los fondos depositados.
Big move on XAUUSD
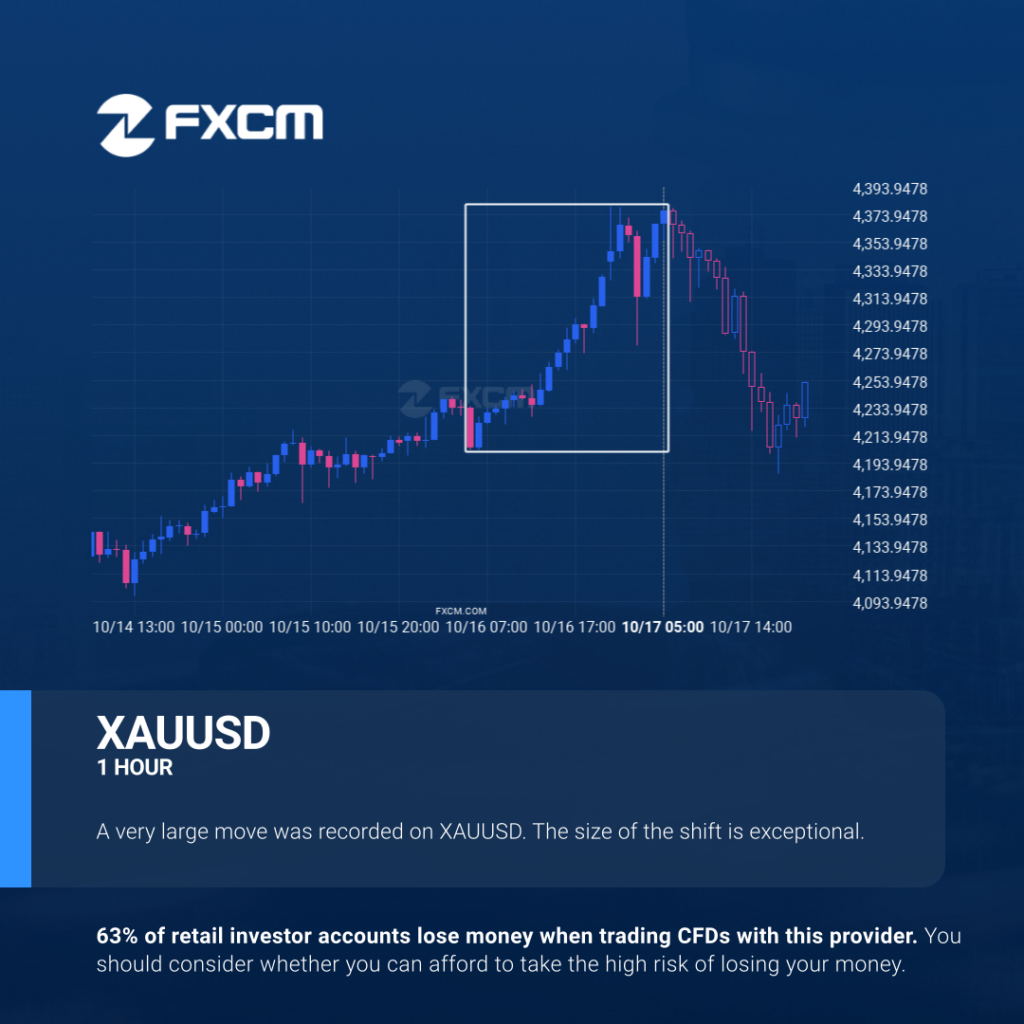
An unexpected large move occurred on XAUUSD 1 hour chart, starting at 4204.975 and reaching 4376.485. It stands out in recent trading activity. Past performance is not an indicator of future results. Trading leveraged products carries significant risk. Please refer to PDS and TMD on our website. AFSL#309763
Possible start of a bullish trend as ESP35 breaks resistance
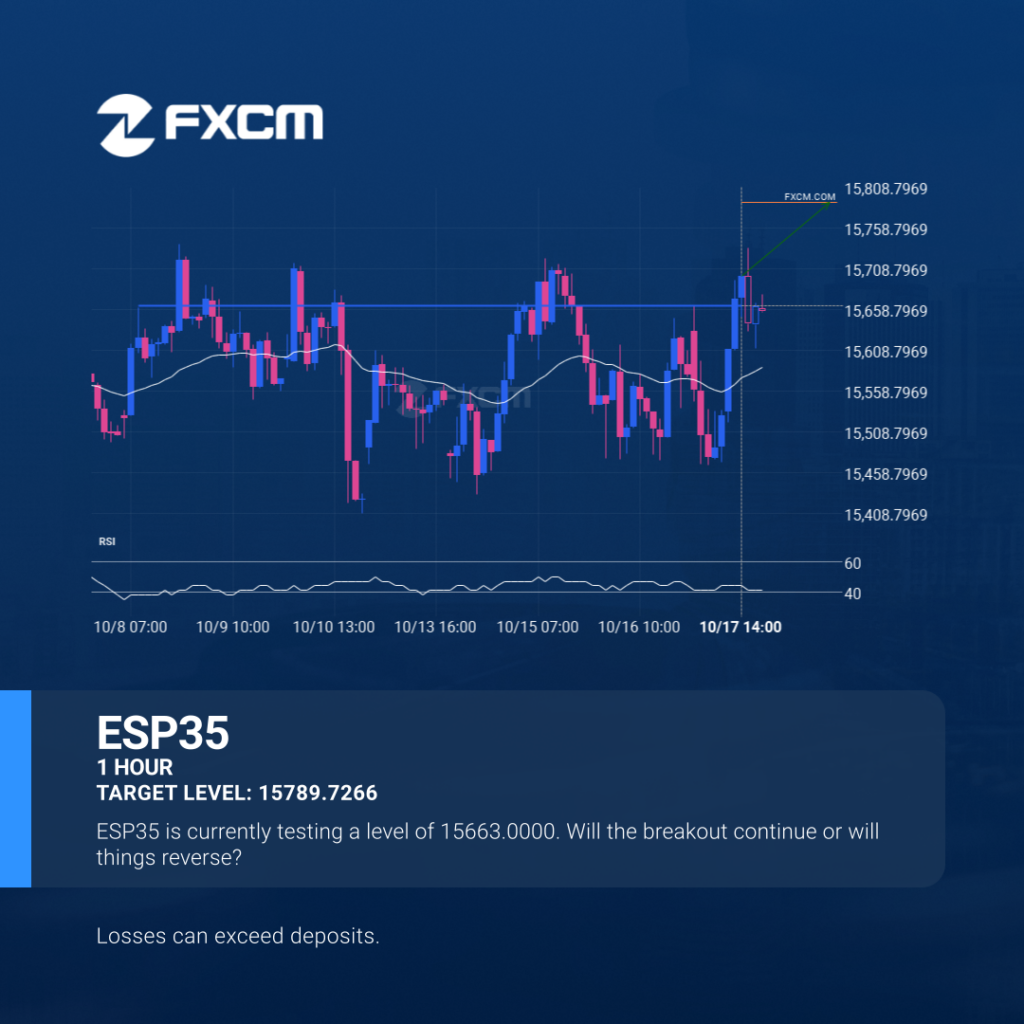
ESP35 has broken through a line of 15663.0000. If this breakout holds true, we could see the price of ESP35 heading towards 15789.7266 within the next 18 hours. But don’t be so quick to trade, it has tested this line numerous times in the past, so you should probably confirm the breakout before placing any […]
Possible start of a bullish trend as ESP35 breaks resistance

ESP35 has broken through a line of 15663.0000. If this breakout holds true, we could see the price of ESP35 heading towards 15789.7266 within the next 18 hours. But don’t be so quick to trade, it has tested this line numerous times in the past, so you should probably confirm the breakout before placing any […]
Posible comienzo de una tendencia alcista cuando ESP35 rompa el nivel de resistencia

El ESP35 ha atravesado una línea de 15663.0000. Si esta rotura se mantiene, podríamos ver el precio del ESP35 dirigiéndose al nivel de 15789.7266 en las próximas 18 horas. Pero no debe apresurarse a la hora de operar, porque ya ha probado esta línea en numerosas ocasiones durante el pasado, por lo que probablemente debería […]
Patrón técnico alcista en BTCUSD 4 Hora

El BTCUSD ha atravesado una línea de resistencia de un Cuña descendente y sugiere un movimiento posible a 111786.3094 dentro de las próximas 3 días. Ya ha probado esta línea en el pasado, por lo que deberíamos esperar la confirmación de esta irrupción antes de entrar en acción. Si dicha ruptura no se confirma, podríamos […]
AUDUSD approaching resistance level

AUDUSD is moving towards a key resistance level at 0.6497. AUDUSD has previously tested this level 3 times and on each occasion it has bounced back off this level. Is this finally the time it will break through? Past performance is not an indicator of future results. Trading leveraged products carries significant risk. Please refer […]
AUDUSD approaching resistance level
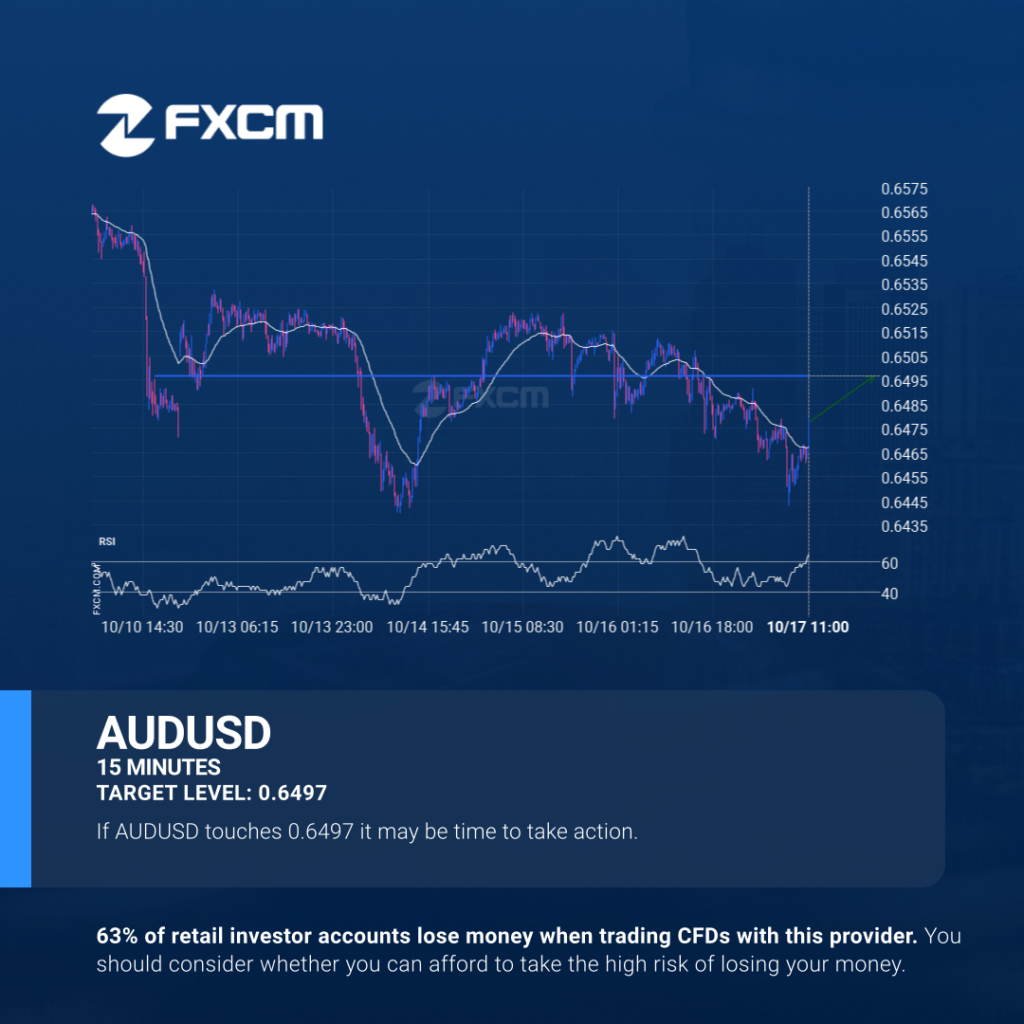
AUDUSD is moving towards a key resistance level at 0.6497. AUDUSD has previously tested this level 3 times and on each occasion it has bounced back off this level. Is this finally the time it will break through? Past performance is not an indicator of future results. Trading leveraged products carries significant risk. Please refer […]
AUDUSD approaching resistance level

AUDUSD is moving towards a key resistance level at 0.6497. AUDUSD has previously tested this level 3 times and on each occasion it has bounced back off this level. Is this finally the time it will break through? Past performance is not an indicator of future results. Losses can exceed deposits.