ESP35 – getting close to resistance of a Rising Wedge
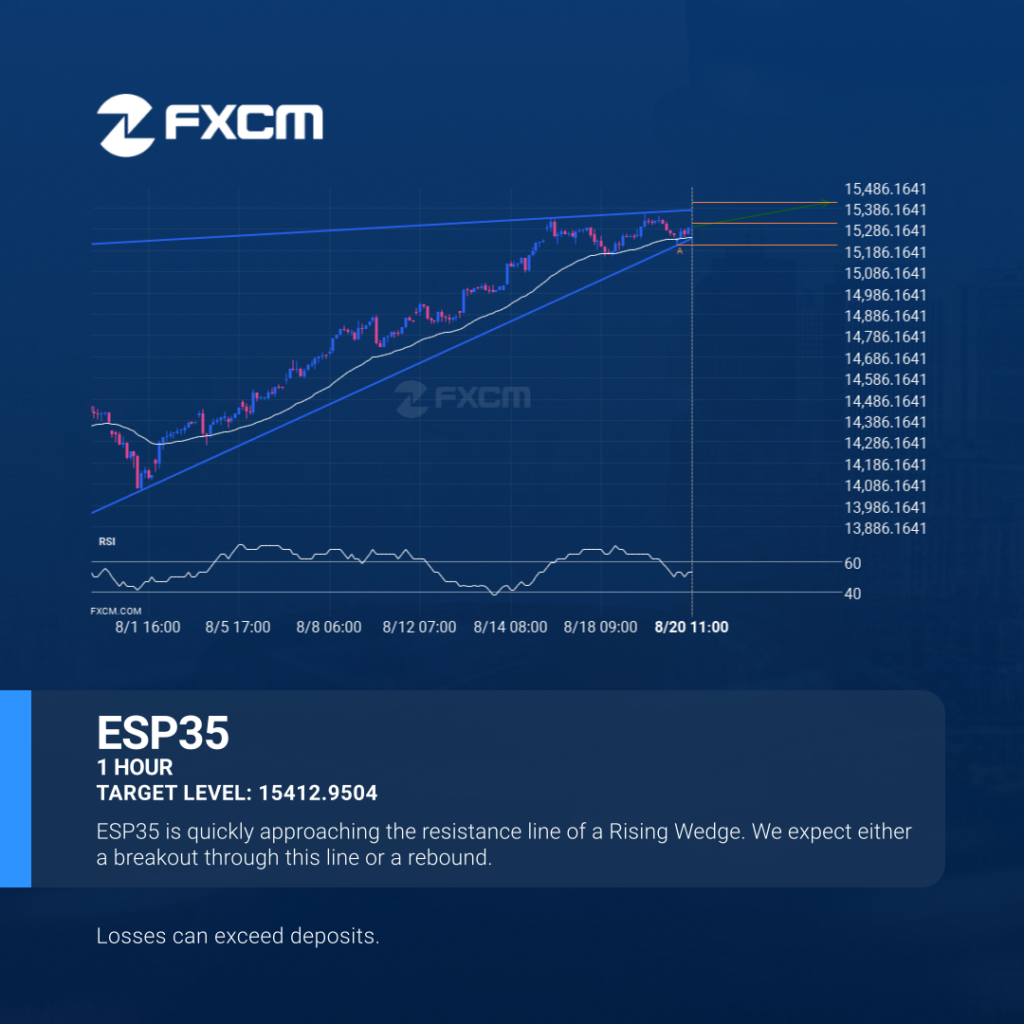
ESP35 was identified at around 15314.74 having recently rebounded of the support on the 1 hour data interval. Ultimately, the price action of the stock has formed a Rising Wedge pattern. This squeeze may increases the chances of a strong breakout. The projected movement will potentially take the price to around the 15412.9504 level. Past […]
ESP35 – acercándose a la resistencia del Cuña ascendente
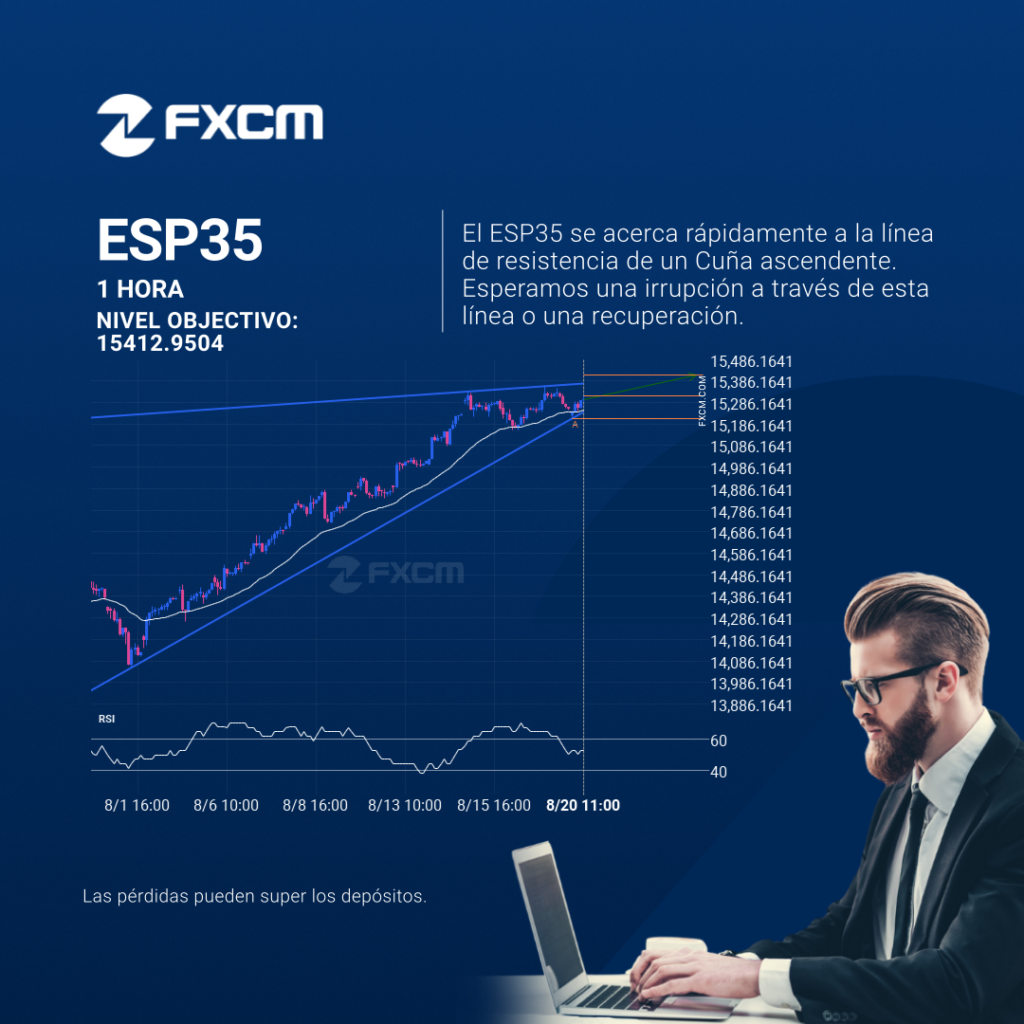
Se identificó un patrón de Cuña ascendente en ESP35 en 15314.74, lo que generó la expectativa de que podría moverse a la línea de resistencia en 15412.9504. Puede atravesar esa línea y continuar la tendencia alcista o puede girarse desde esa línea. El rendimiento pasado no es indicativo de resultados futuros. Las pérdidas pueden exceder […]
ESP35 – getting close to resistance of a Rising Wedge

ESP35 was identified at around 15314.74 having recently rebounded of the support on the 1 hour data interval. Ultimately, the price action of the stock has formed a Rising Wedge pattern. This squeeze may increases the chances of a strong breakout. The projected movement will potentially take the price to around the 15412.9504 level. Past […]
USDCHF short term bullish trade setup to 0.8097
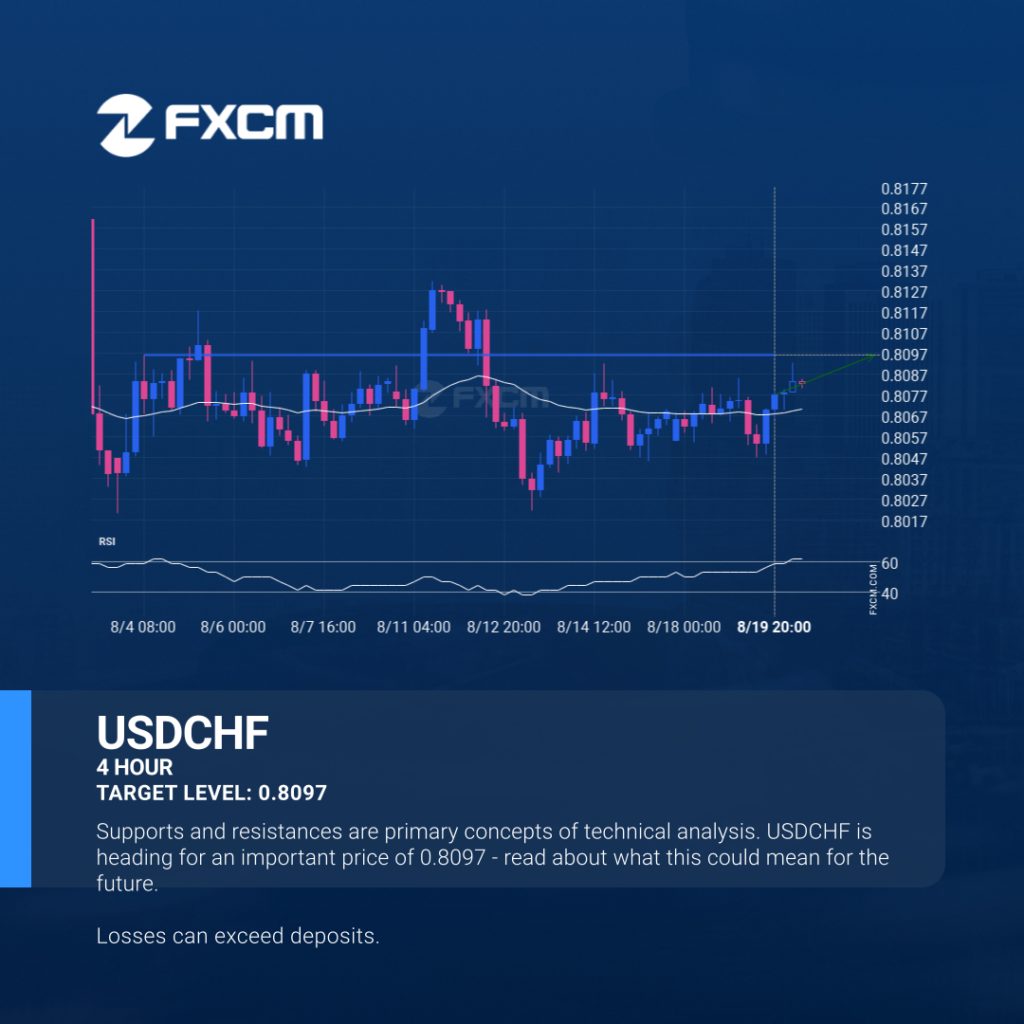
USDCHF is heading towards a line of 0.8097. If this movement continues, the price of USDCHF could test 0.8097 within the next 3 days. But don’t be so quick to trade, it has tested this line numerous times in the past, so this movement could be short-lived and end up rebounding. Past performance is not […]
USDCHF: plan para operación alcista a corto plazo hasta 0.8097
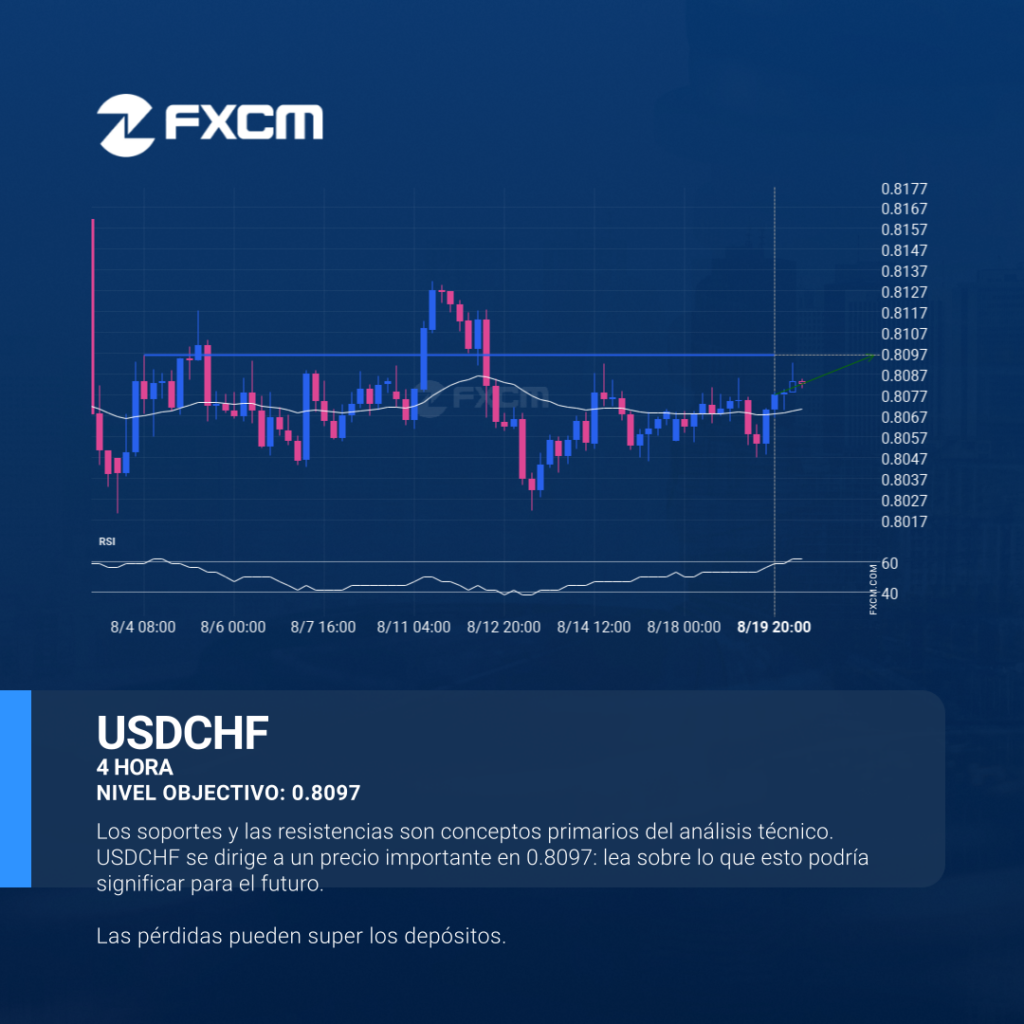
El USDCHF avanza hacia la línea de 0.8097. Si este movimiento se mantiene, el precio del USDCHF podría probar el nivel de 0.8097 en un plazo de 3 días. Pero no se apresure a la hora de operar, porque el par ha probado esta línea en numerosas ocasiones durante el pasado, por lo que este […]
Un posible movimiento alcista en BTCUSD
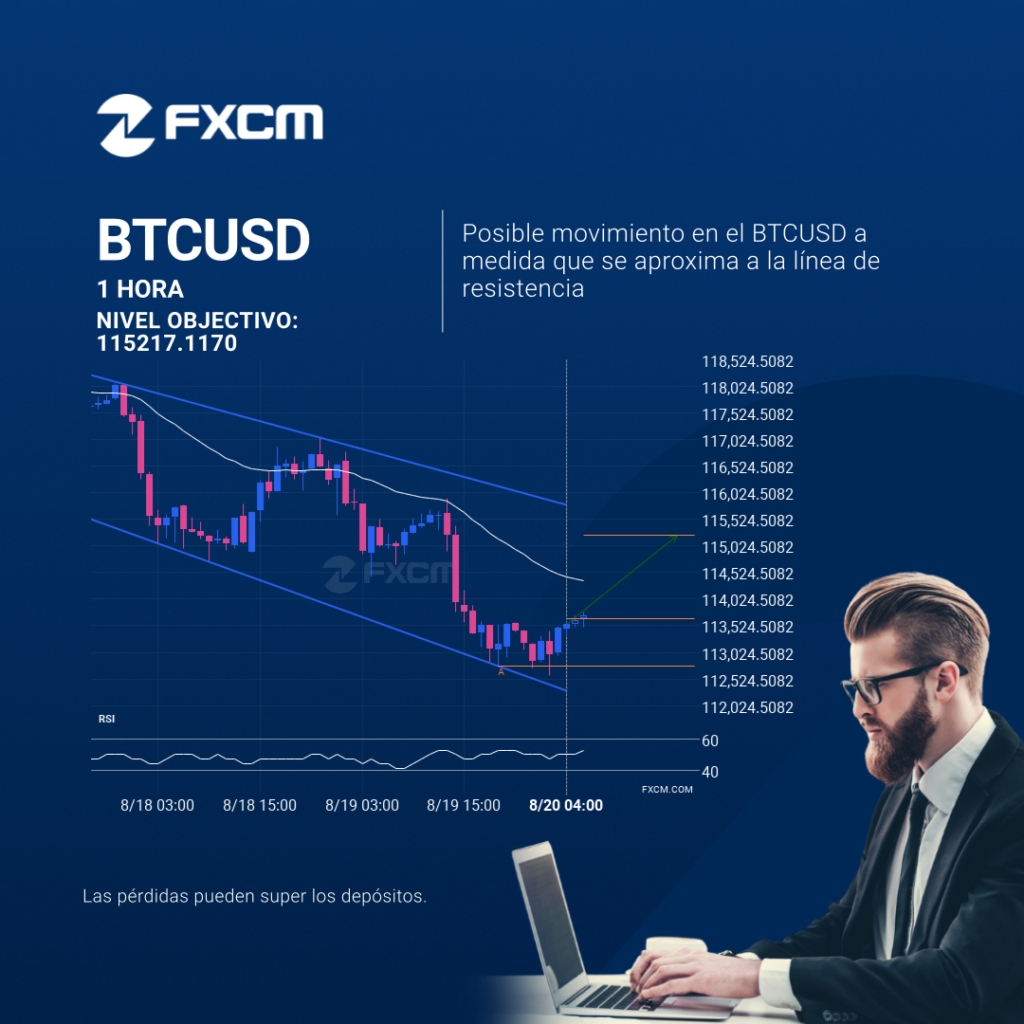
Se ha detectado un patrón Canal bajista en formación en BTCUSD en el gráfico de 1 Hora. Existe la posibilidad de un movimiento hacia 115217.1170 en las próximas velas. Una vez que alcance support, el precio puede continuar su tendencia alcista o revertir a los niveles actuales de precio. El rendimiento pasado no es indicativo […]
EURUSD – support line broken at 2025-08-19T22:30:00.000Z
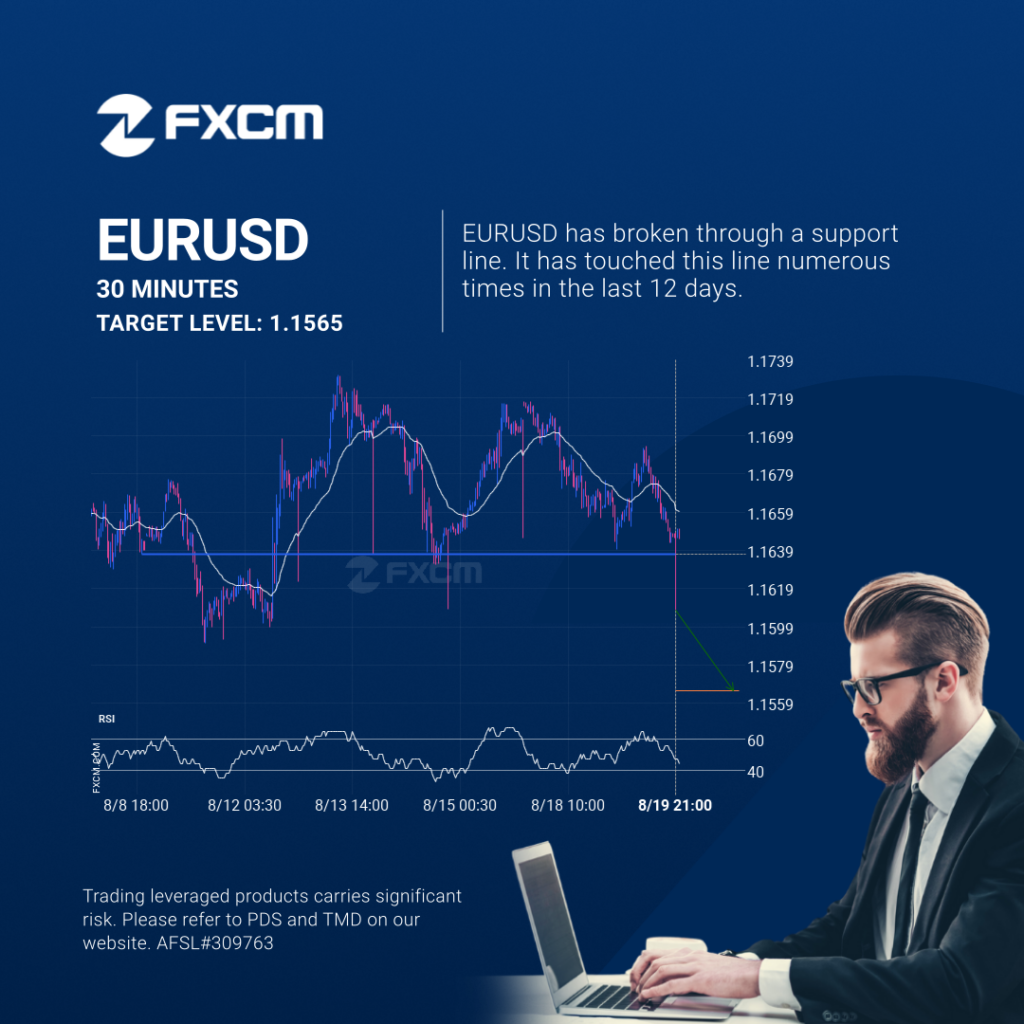
The price of EURUSD in heading in the direction of 1.1565. Despite the recent breakout through 1.1636 it is possible that it will struggle to gain momentum to the forecast price and move back in the other direction. This has happened many times in the past so watch for a possible bounce back. Past performance […]
EURUSD: línea de soporte rota a las 2025-08-19T22:30:00.000Z

El precio de EURUSD en dirección a 1.1565. A pesar de la reciente rotura a través de 1.1636, es posible que tenga dificultades para ganar impulso hacia el precio previsto y que retroceda en la otra dirección. Esto ha sucedido muchas veces en el pasado, así que esté atento a un posible rebote. El rendimiento […]
Possible breach of support level by AUDUSD
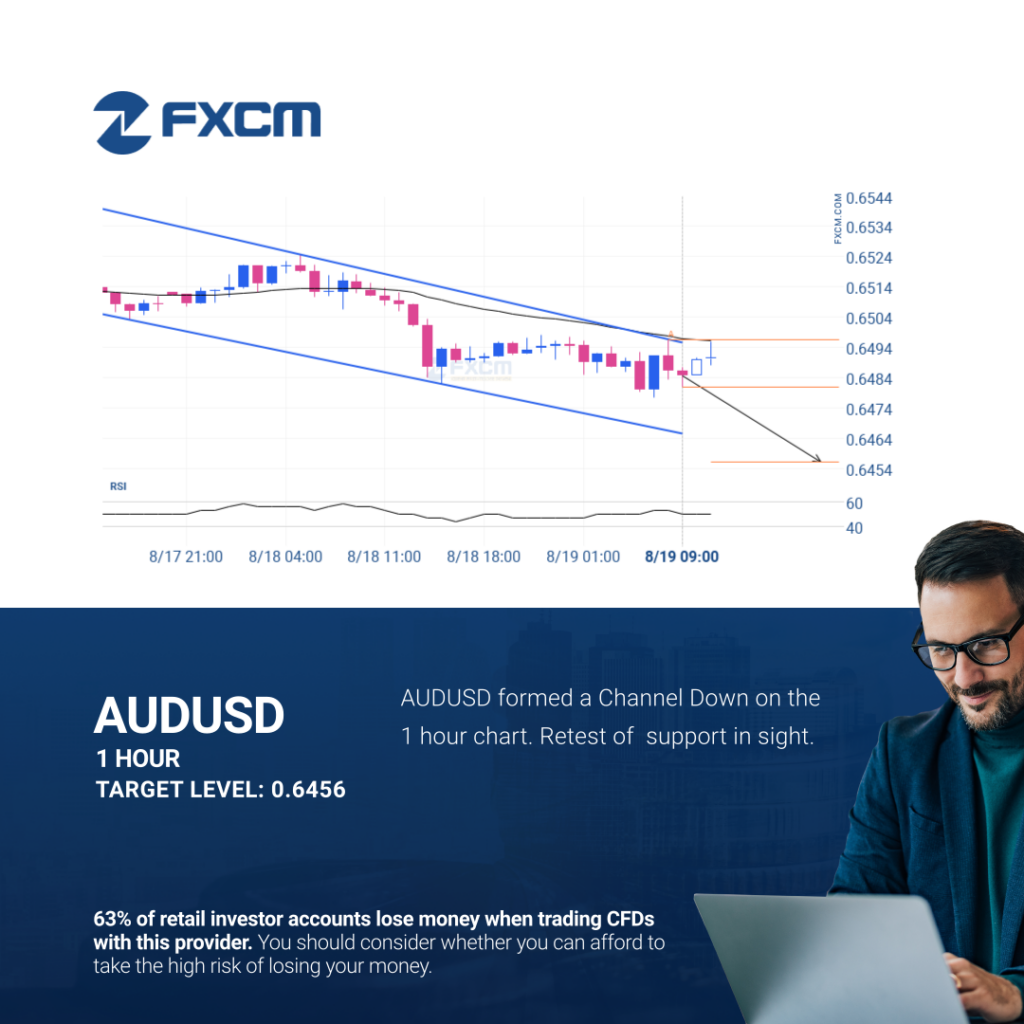
AUDUSD is heading towards the support line of a Channel Down and could reach this point within the next 10 hours. It has tested this line numerous times in the past, and this time could be no different from the past, ending in a rebound instead of a breakout. If the breakout doesn’t happen, we […]