O bien, una inminente recuperación o una ruptura del HKG33

HKG33 está a punto de volver a testear un nivel de soporte horizontal clave, cerca de 25648.5801. Ha testeado este nivel 3 veces recientemente y podría simplemente rebotar como lo hizo la última vez. Sin embargo, después de tantos intentos, tal vez esté listo para empezar una nueva tendencia. El rendimiento pasado no es indicativo […]
Either a rebound or a breakout imminent on AUDUSD
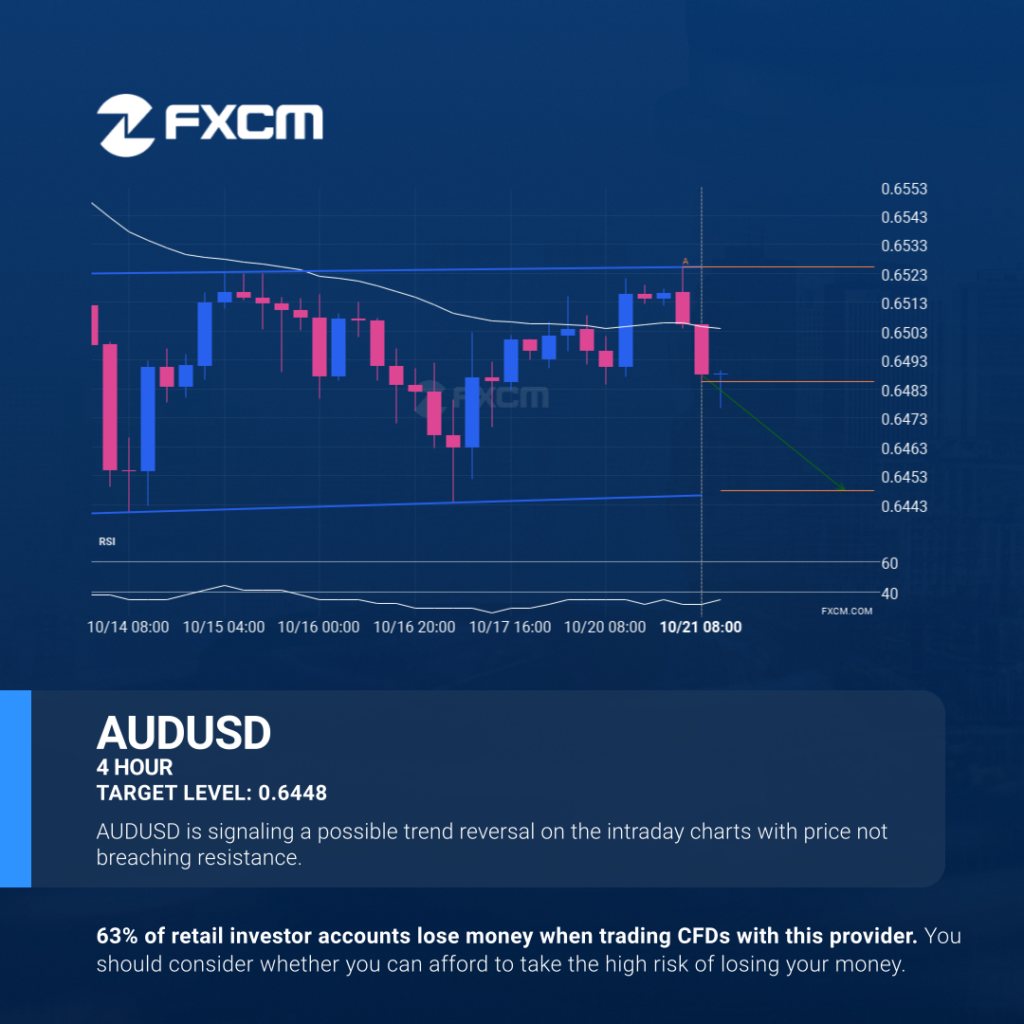
Emerging Flag pattern in its final wave was identified on the AUDUSD 4 hour chart. After a strong bearish run, we find AUDUSD heading towards the upper triangle line with a possible resistance at 0.6448. If the support shows to hold, the Flag pattern suggests a rebound back towards current levels. Past performance is not […]
Either a rebound or a breakout imminent on HKG33

HKG33 is about to retest a key horizontal support level near 25648.5801. It has tested this level 3 times in the recent past and could simply bounce off like it did last time. However, after this many tries, maybe it’s ready to start a new trend. Past performance is not an indicator of future results. […]
Either a rebound or a breakout imminent on HKG33
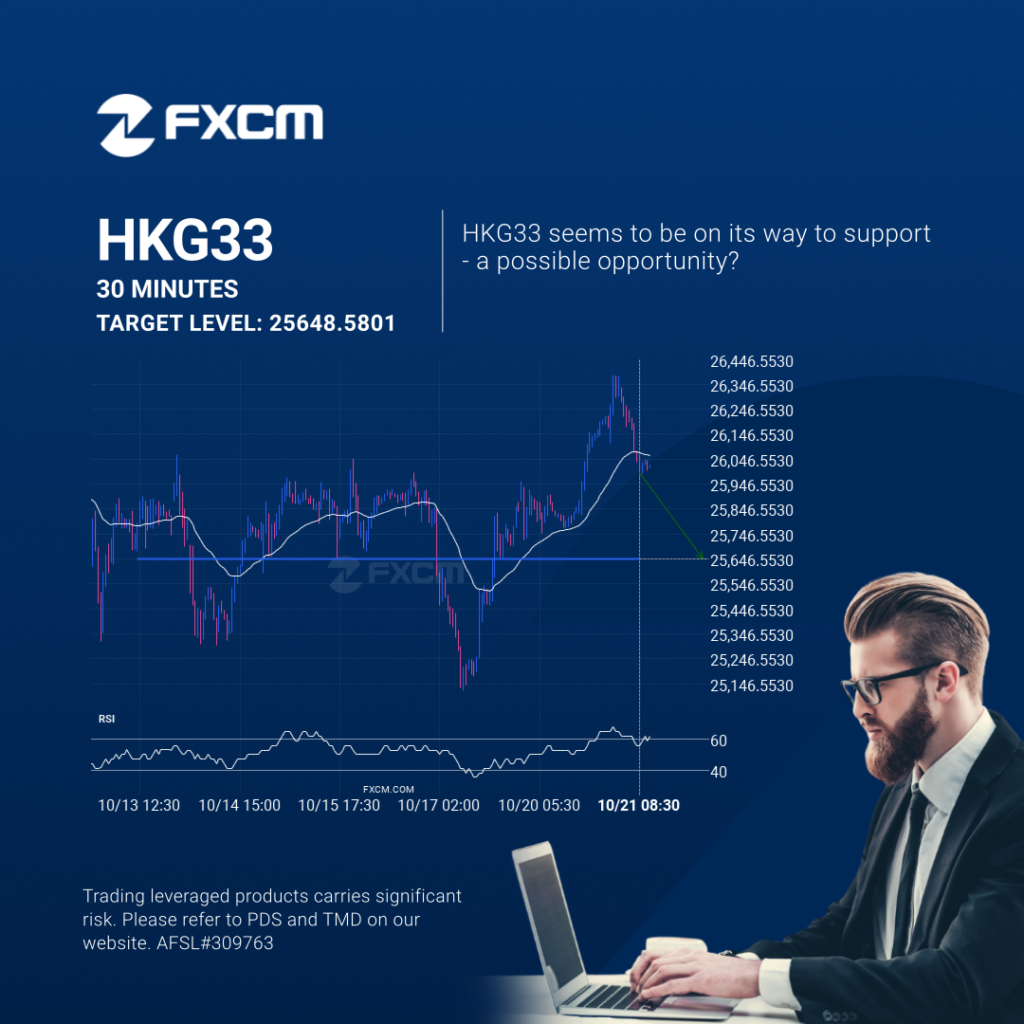
HKG33 is about to retest a key horizontal support level near 25648.5801. It has tested this level 3 times in the recent past and could simply bounce off like it did last time. However, after this many tries, maybe it’s ready to start a new trend. Past performance is not an indicator of future results. […]
Will EURJPY have enough momentum to break resistance?

A Inverse Head and Shoulders pattern was identified on EURJPY at 175.821, creating an expectation that it may move to the resistance line at 176.2594. It may break through that line and continue the bullish trend or it may reverse from that line. Past performance is not an indicator of future results. Trading leveraged products […]
Will EURJPY have enough momentum to break resistance?

A Inverse Head and Shoulders pattern was identified on EURJPY at 175.821, creating an expectation that it may move to the resistance line at 176.2594. It may break through that line and continue the bullish trend or it may reverse from that line. Past performance is not an indicator of future results. Losses can exceed […]
Will EURJPY have enough momentum to break resistance?
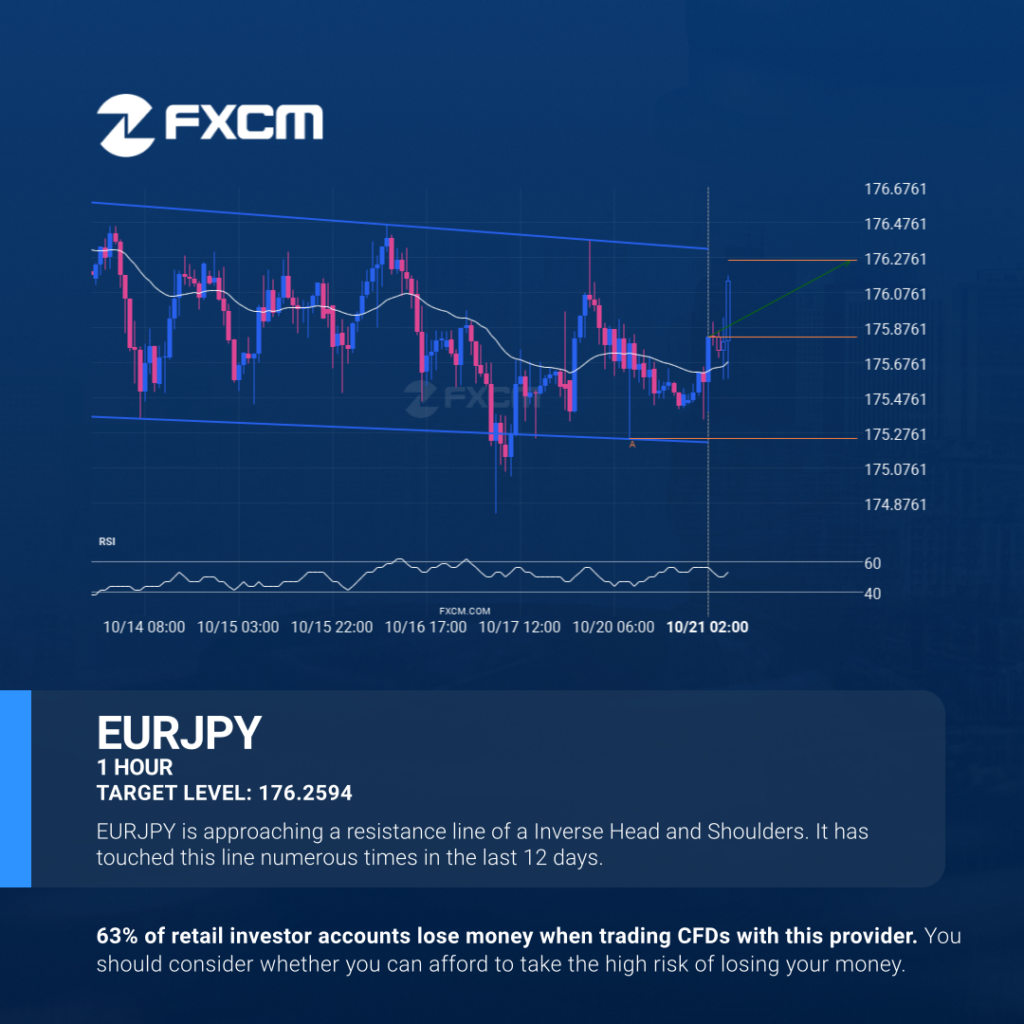
A Inverse Head and Shoulders pattern was identified on EURJPY at 175.821, creating an expectation that it may move to the resistance line at 176.2594. It may break through that line and continue the bullish trend or it may reverse from that line. Past performance is not an indicator of future results. Trading leveraged products […]
¿Tendrá el EURJPY suficiente impulso como para irrumpir la resistencia?

EURJPY está atrapado en una formación de Hombro – cabeza – hombro invertido, lo que implica que una rotura es inminente. Esta es una excelente configuración de trading tanto para los operadores de tendencia como para los de swing. Ahora se está acercando a una línea de soporte que se testeó en el pasado. Los […]
Patrón Continuation en BTCUSD

El BTCUSD ha atravesado una línea de soporte de un Canal alcista y sugiere un movimiento posible a 106550.7236 dentro de las próximas 2 días. Ya ha probado esta línea en el pasado, por lo que deberíamos esperar la confirmación de esta irrupción antes de entrar en acción. Si dicha ruptura no se confirma, podríamos […]
El NZDUSD se aproxima a la resistencia de un Cuña ascendente

NZDUSD se identificó alrededor de 0.574885 después de haber rebotado recientemente en un nivel de soporte en el intervalo temporal de 15 Minutos. En última instancia, la acción del precio del activo ha formado un patrón de Cuña ascendente. Esta presión puede aumentar las posibilidades de una fuerte rotura. El movimiento proyectado potencialmente llevará el […]