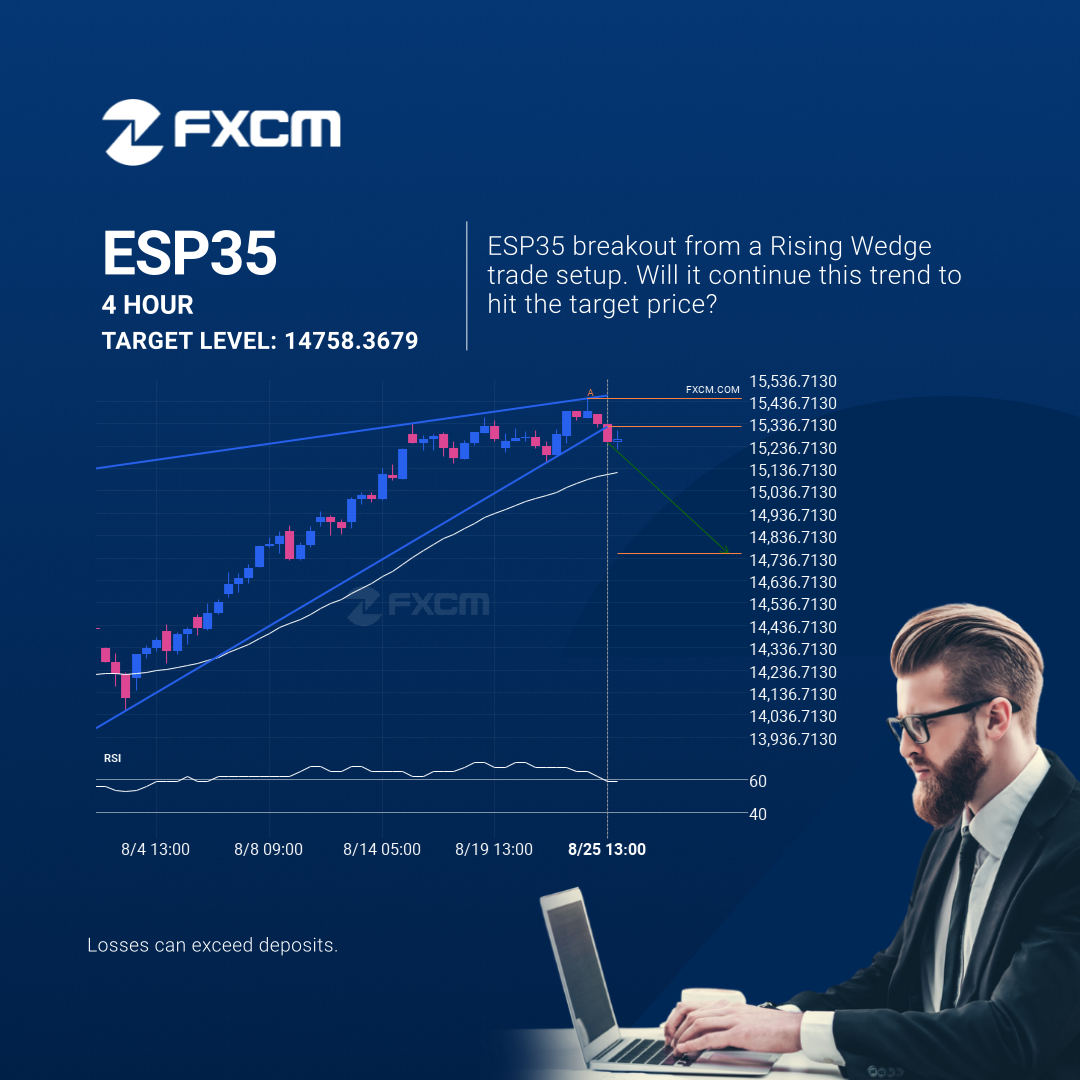
ESP35 moved through the support line of a Rising Wedge at 15326.56243902439 on the 4 hour chart. This line has been tested a number of times in the past and this breakout could mean an upcoming change from the current trend. It may continue in its current direction toward 14758.3679.
Past performance is not an indicator of future results.
Losses can exceed deposits.