Possible start of a bullish trend as EURCHF breaks resistance
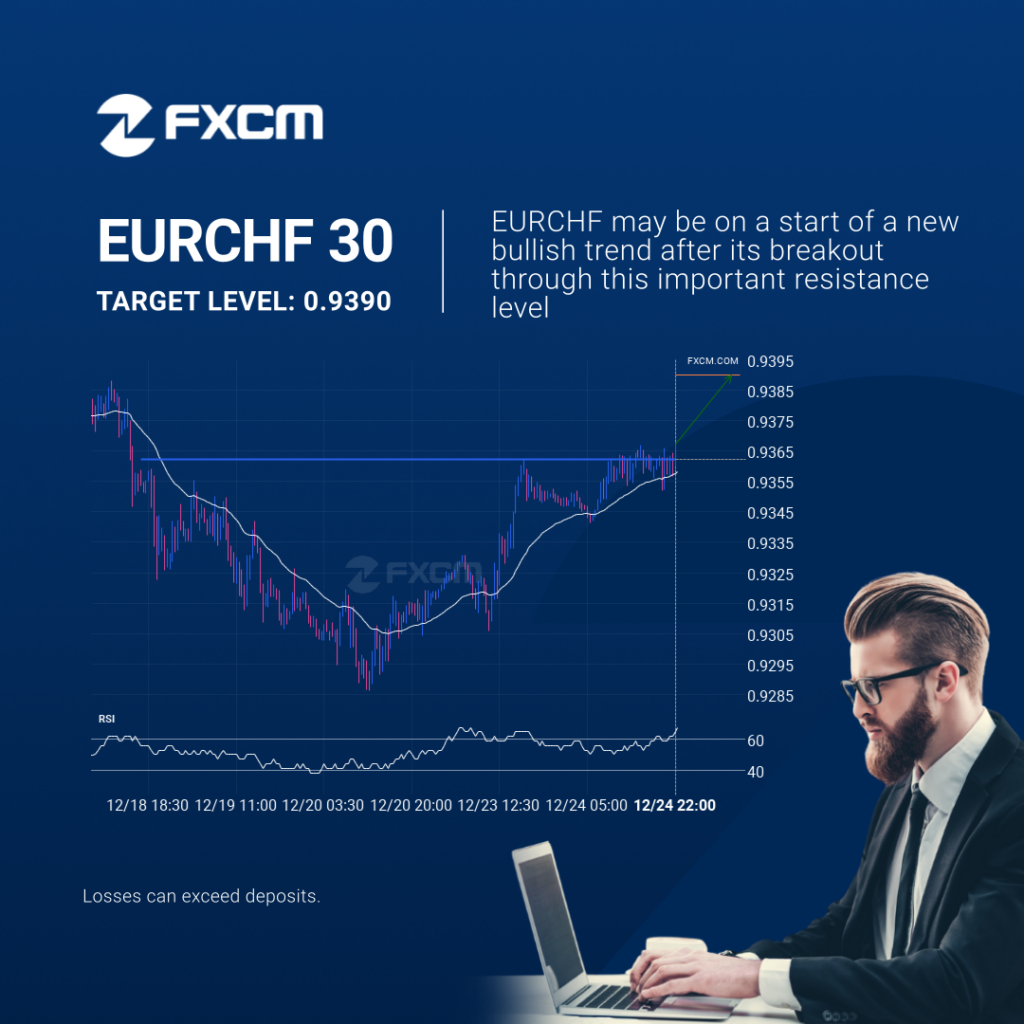
EURCHF has broken through a resistance line. It has touched this line numerous times in the last 7 days. This breakout shows a potential move to 0.9390 within the next 2 days. Because we have seen it retrace from this level in the past, one should wait for confirmation of the breakout. Past performance is […]
XAGUSD approaching important level of 29.7170
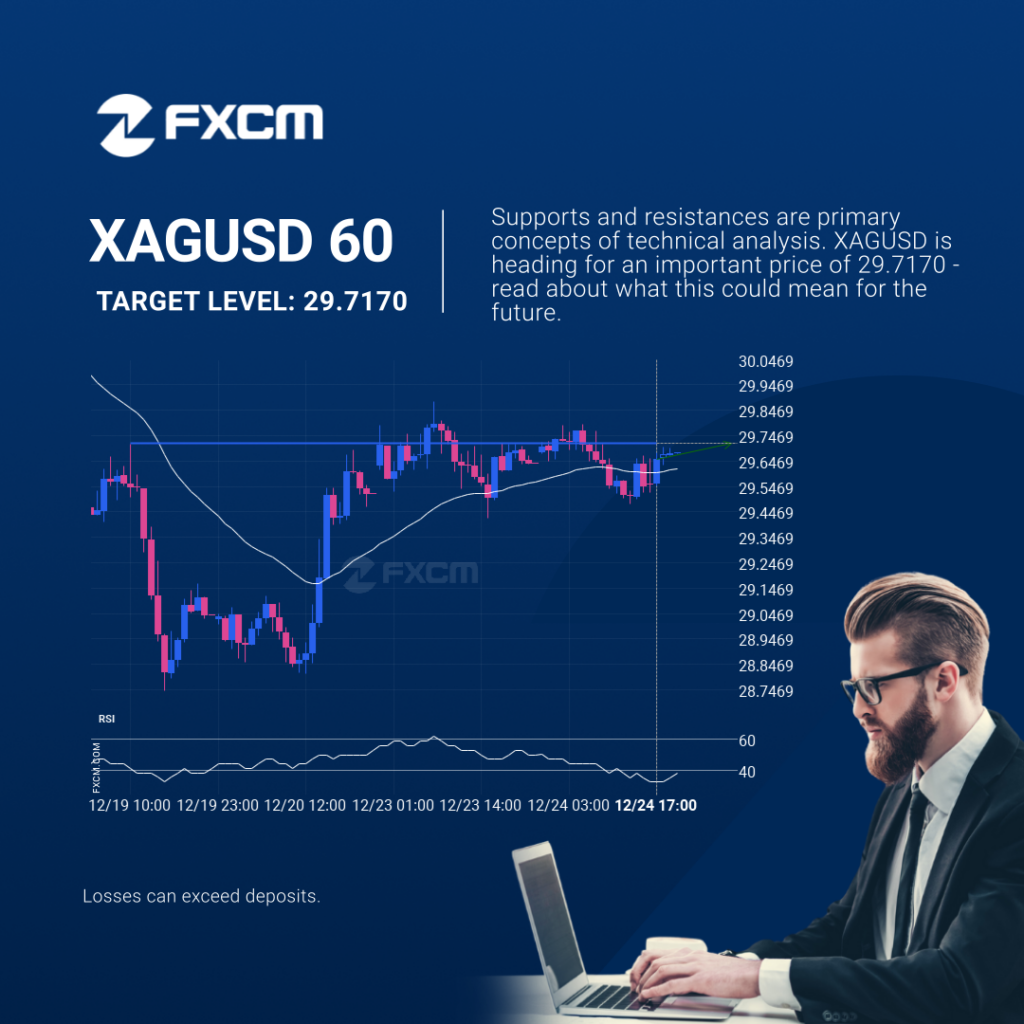
A strong resistance level has been identified at 29.7170 on the 1 hour XAGUSD chart. XAGUSD is likely to test it soon. Past performance is not an indicator of future results. Losses can exceed deposits.
Extreme movement on AUDUSD

AUDUSD dropped sharply for 25 days – which is an excessively big movement for this instrument; exceeding the 98% of past price moves. Even if this move is a sign of a new trend in AUDUSD there is a chance that we will witness a correction, no matter how brief. Past performance is not an […]
A potential bearish movement on GBPUSD
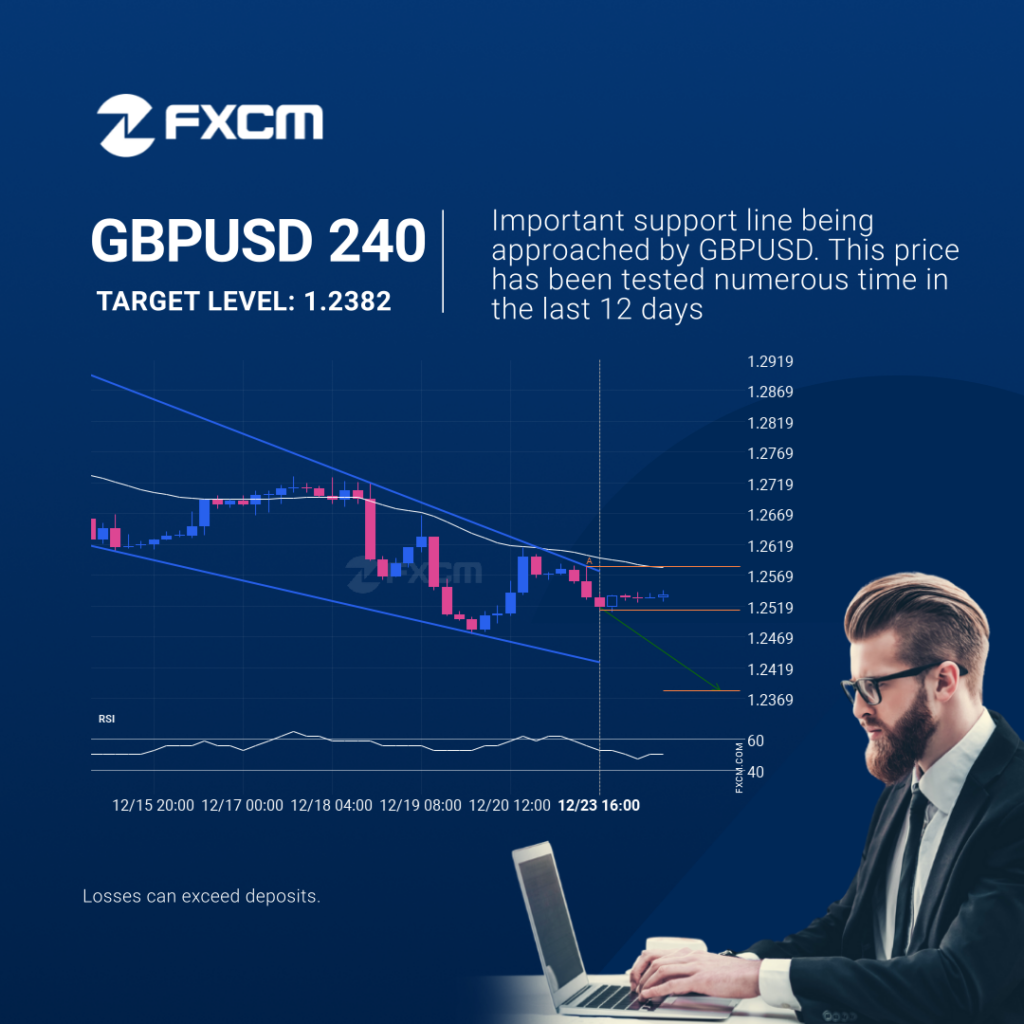
GBPUSD was identified at around 1.25125 having recently rebounded of the resistance on the 4 hour data interval. Ultimately, the price action of the stock has formed a Falling Wedge pattern. This squeeze may increases the chances of a strong breakout. The projected movement will potentially take the price to around the 1.2382 level. Past […]
Dramatic change in NZDUSD. A sign of things to come?
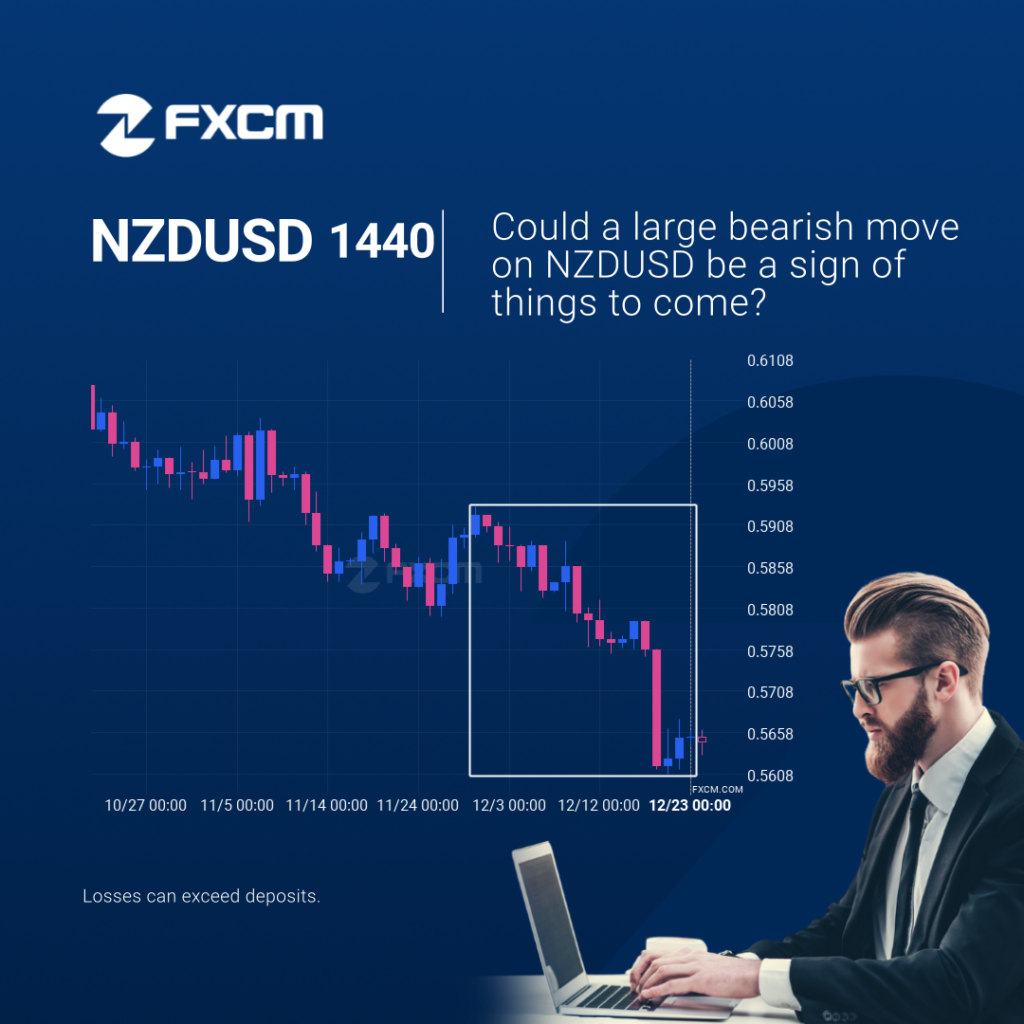
NZDUSD dropped sharply for 24 days – which is an excessively big movement for this instrument; exceeding the 98% of past price moves. Even if this move is a sign of a new trend in NZDUSD there is a chance that we will witness a correction, no matter how brief. Past performance is not an […]
USDCAD was on its way up
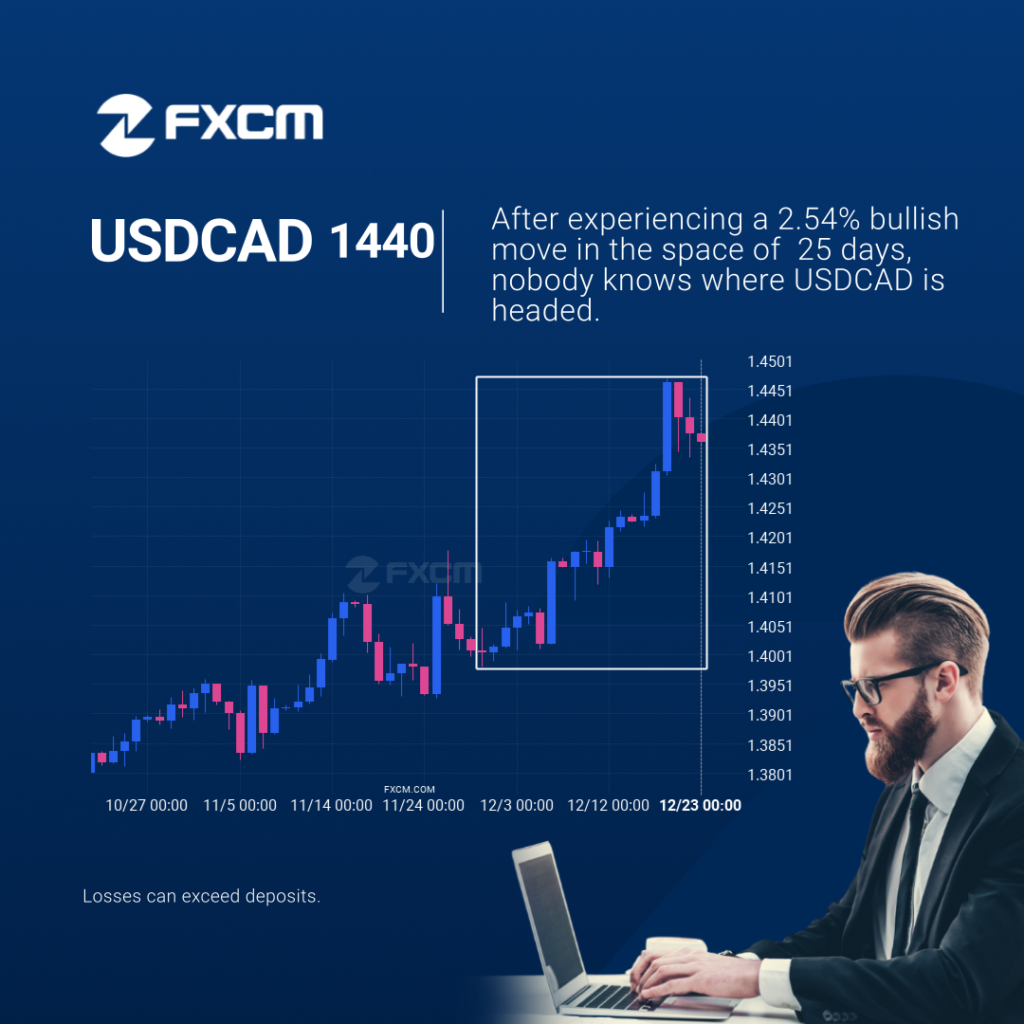
An unexpected large move has occurred on USDCAD Daily chart beginning at 1.40045 and ending at 1.43604. Is this a sign of something new? What can we expect in the future? Past performance is not an indicator of future results. Losses can exceed deposits.
Extreme movement on AUDUSD

AUDUSD hits 0.62546 after a 3.95% move spanning 25 days. Past performance is not an indicator of future results. Losses can exceed deposits.
Dramatic change in EURJPY. A sign of things to come?

An unexpected large move has occurred on EURJPY Daily chart beginning at 157.25 and ending at 163.337. Is this a sign of something new? What can we expect in the future? Past performance is not an indicator of future results. Losses can exceed deposits.
Should we expect a breakout or a rebound on EURGBP?
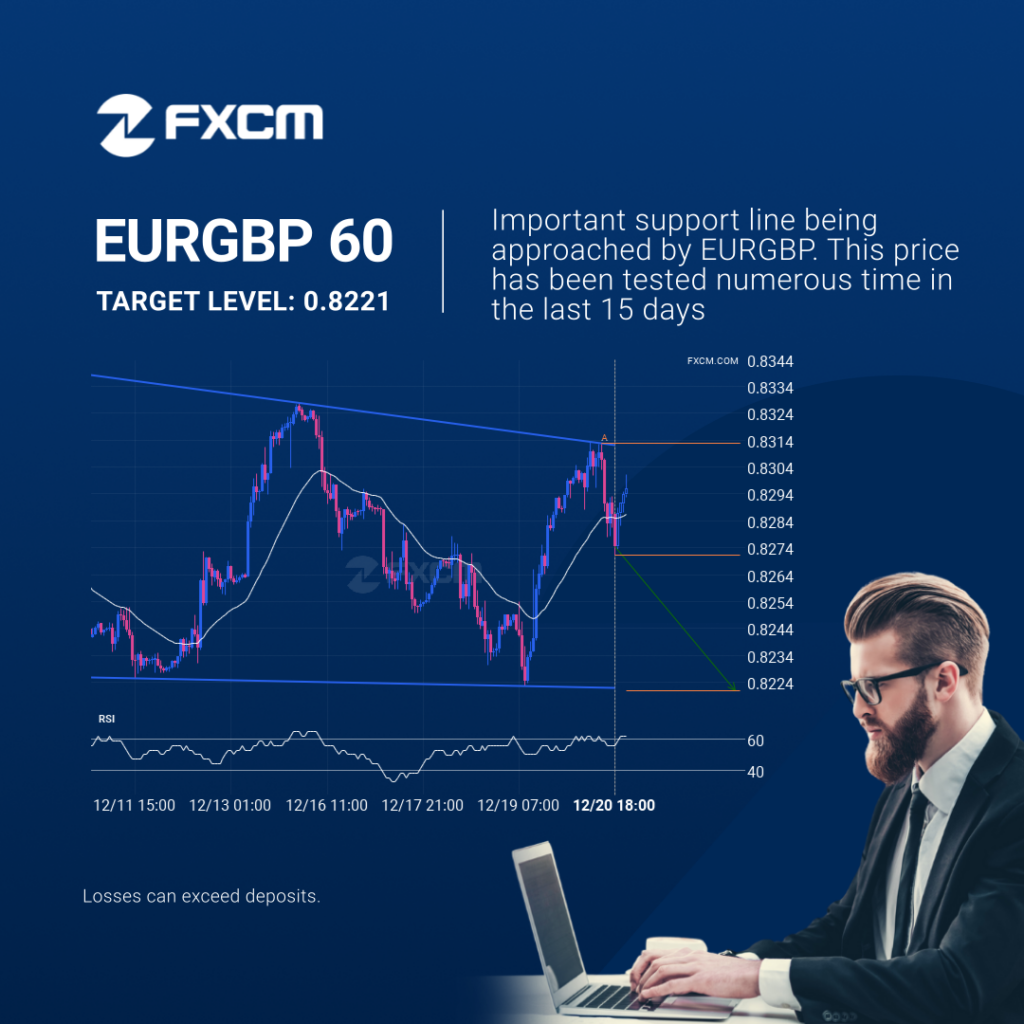
EURGBP is approaching the support line of a Descending Triangle. It has touched this line numerous times in the last 15 days. If it tests this line again, it should do so in the next 3 days. Past performance is not an indicator of future results. Losses can exceed deposits.
EURJPY is moving, act now

EURJPY has moved higher by 3.91% from 157.25 to 163.392 in the last 18 days. Past performance is not an indicator of future results. Losses can exceed deposits.