NZDUSD is moving, act now
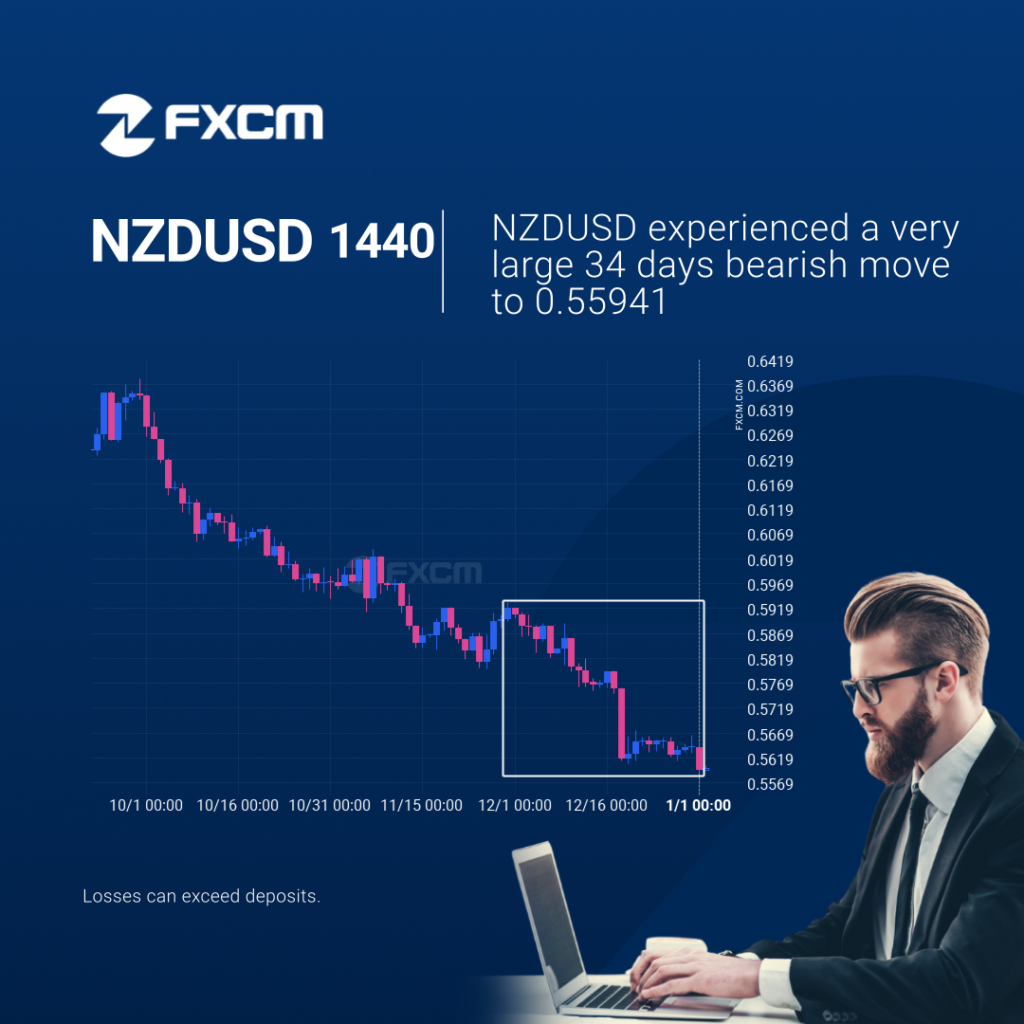
Those of you that are trend followers are probably eagerly watching NZDUSD to see if its latest 5.51% move continues. If not, the mean-reversion people out there will be delighted with this exceptionally large 34 days move. Past performance is not an indicator of future results. Losses can exceed deposits.
Where is USDCHF moving to?
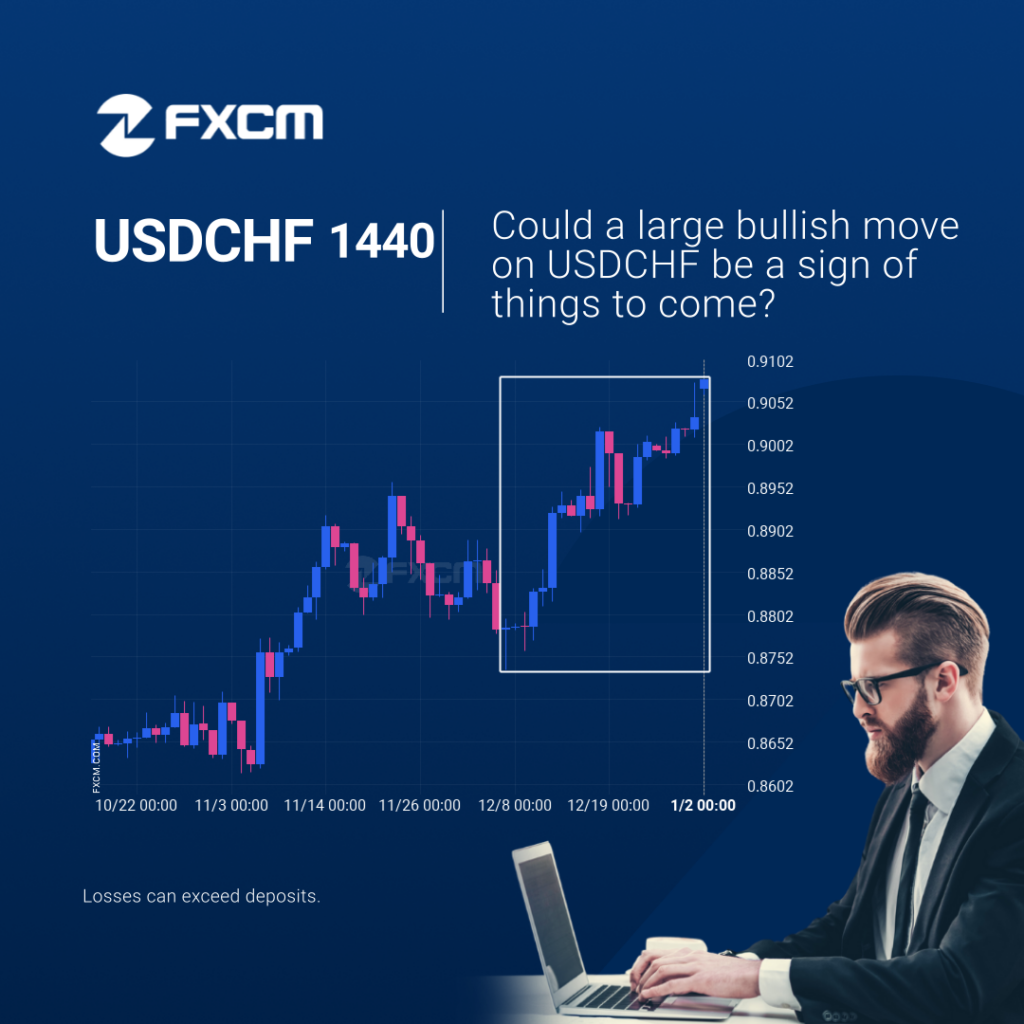
A movement of 3.31% over 28 days on USDCHF doesn’t go unnoticed. You may start considering where it’s heading next, a continuation of the current upward trend, or a reversal in the previous direction. Past performance is not an indicator of future results. Losses can exceed deposits.
Should we expect a breakout or a rebound on USDJPY?
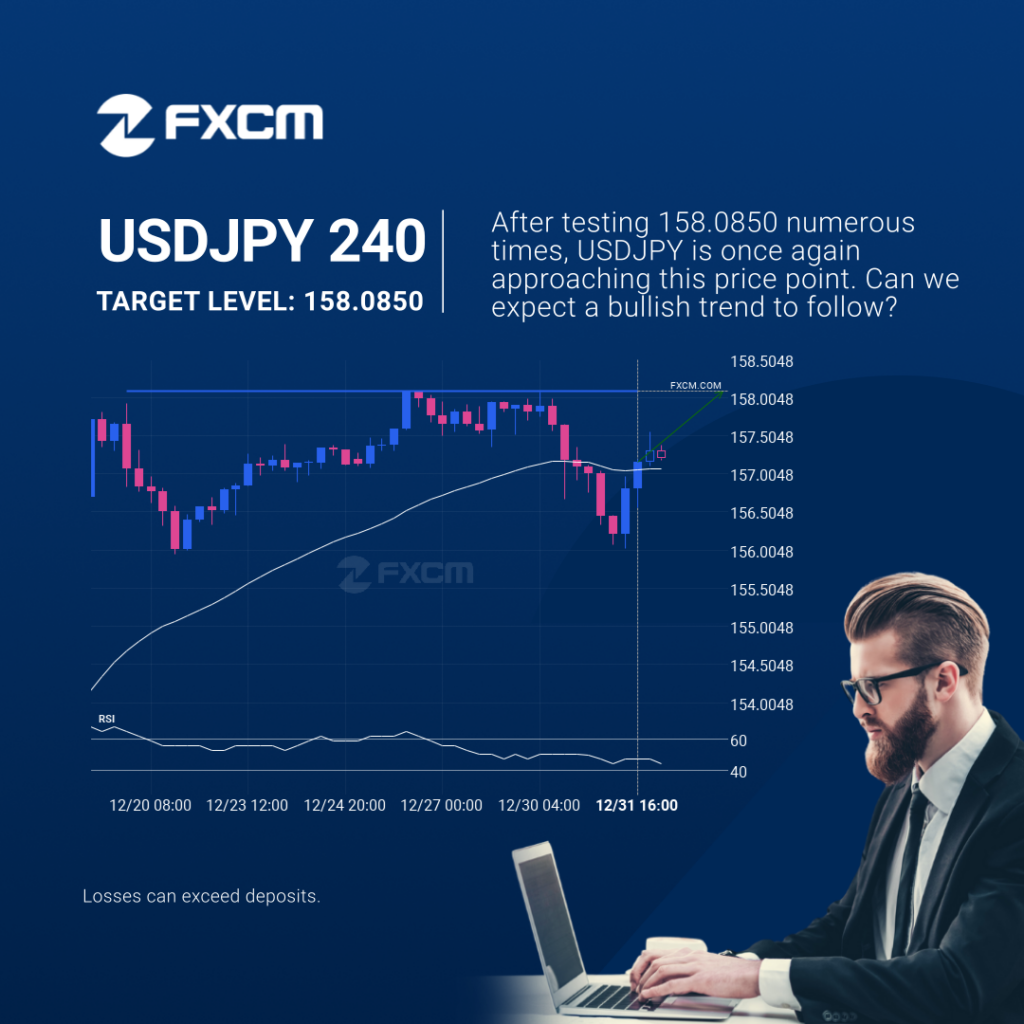
USDJPY is heading towards a line of 158.0850. If this movement continues, the price of USDJPY could test 158.0850 within the next 2 days. But don’t be so quick to trade, it has tested this line numerous times in the past, so this movement could be short-lived and end up rebounding. Past performance is not […]
Continuation pattern on AUDUSD
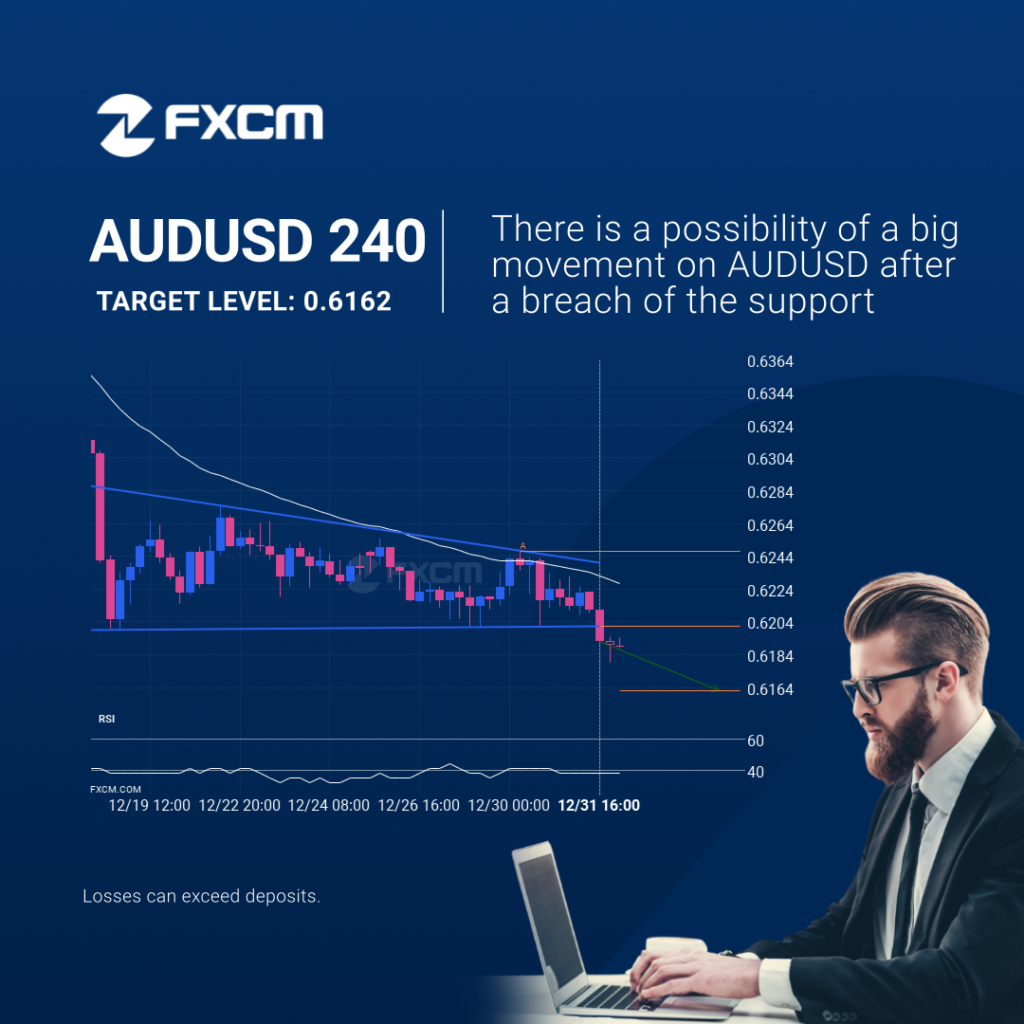
AUDUSD has broken through a support line. It has touched this line at least twice in the last 15 days. This breakout may indicate a potential move to 0.6162 within the next 3 days. Because we have seen it retrace from this position in the past, one should wait for confirmation of the breakout before […]
Big movement possible on NZDUSD
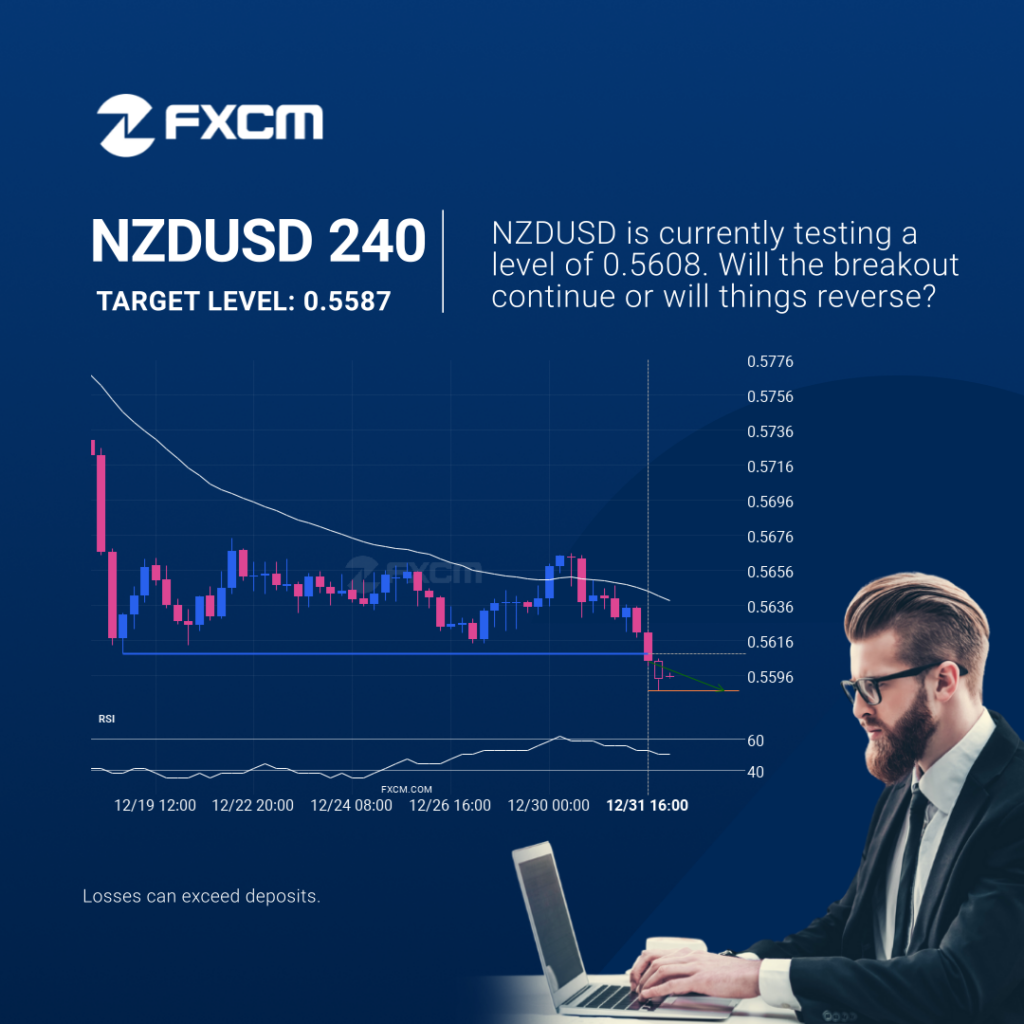
NZDUSD has broken through a support line. Because we have seen it retrace from this price in the past, one should wait for confirmation of the breakout before trading. It has touched this line numerous times in the last 13 days and suggests a possible target level to be around 0.5587 within the next 2 […]
EURJPY approaching support level

A strong support level has been identified at 162.3450 on the 1 hour EURJPY chart. EURJPY is likely to test it soon. Past performance is not an indicator of future results. Losses can exceed deposits.
EURCHF – Continuation Chart Pattern – Rising Wedge
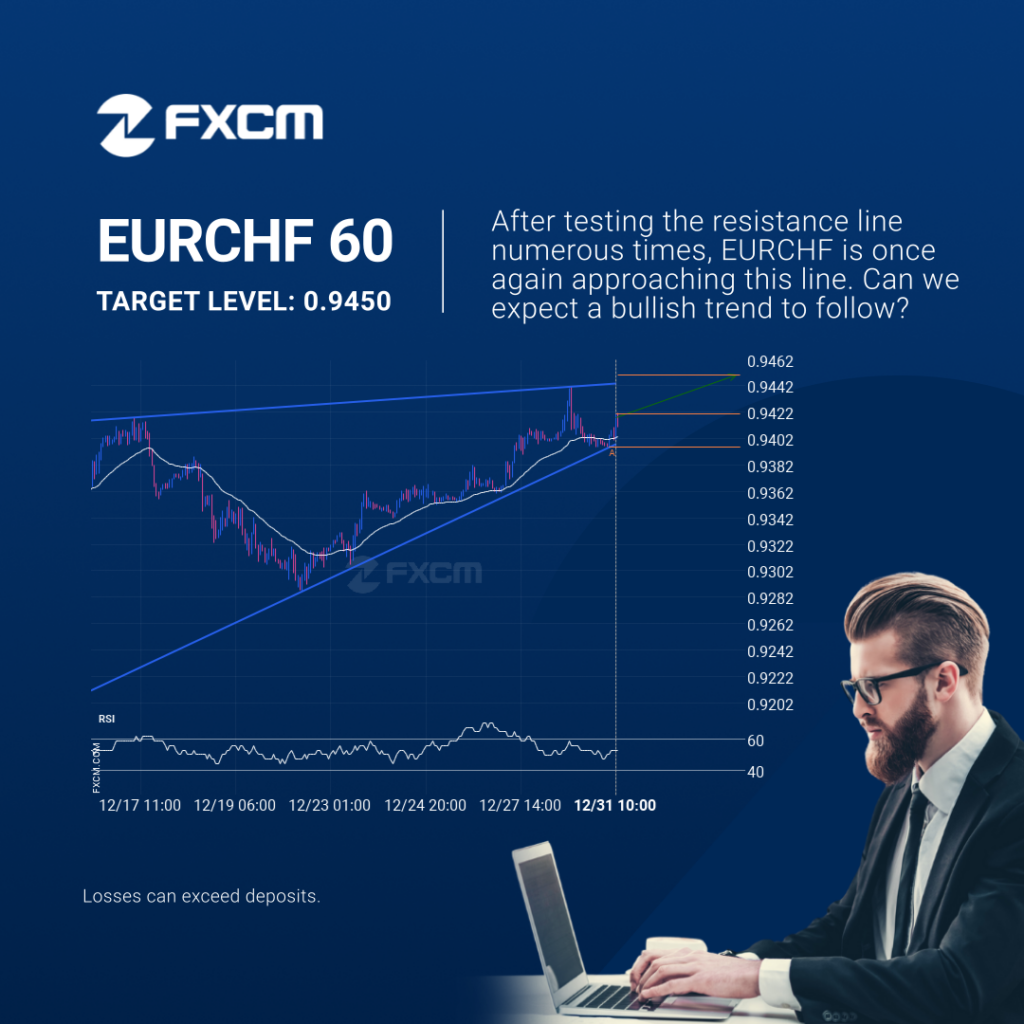
An emerging Rising Wedge has been detected on EURCHF on the 1 hour chart. There is a possible move towards 0.9450 next few candles. Once reaching support it may continue its bullish run or reverse back to current price levels. Past performance is not an indicator of future results. Losses can exceed deposits.
AUDUSD was on its way down
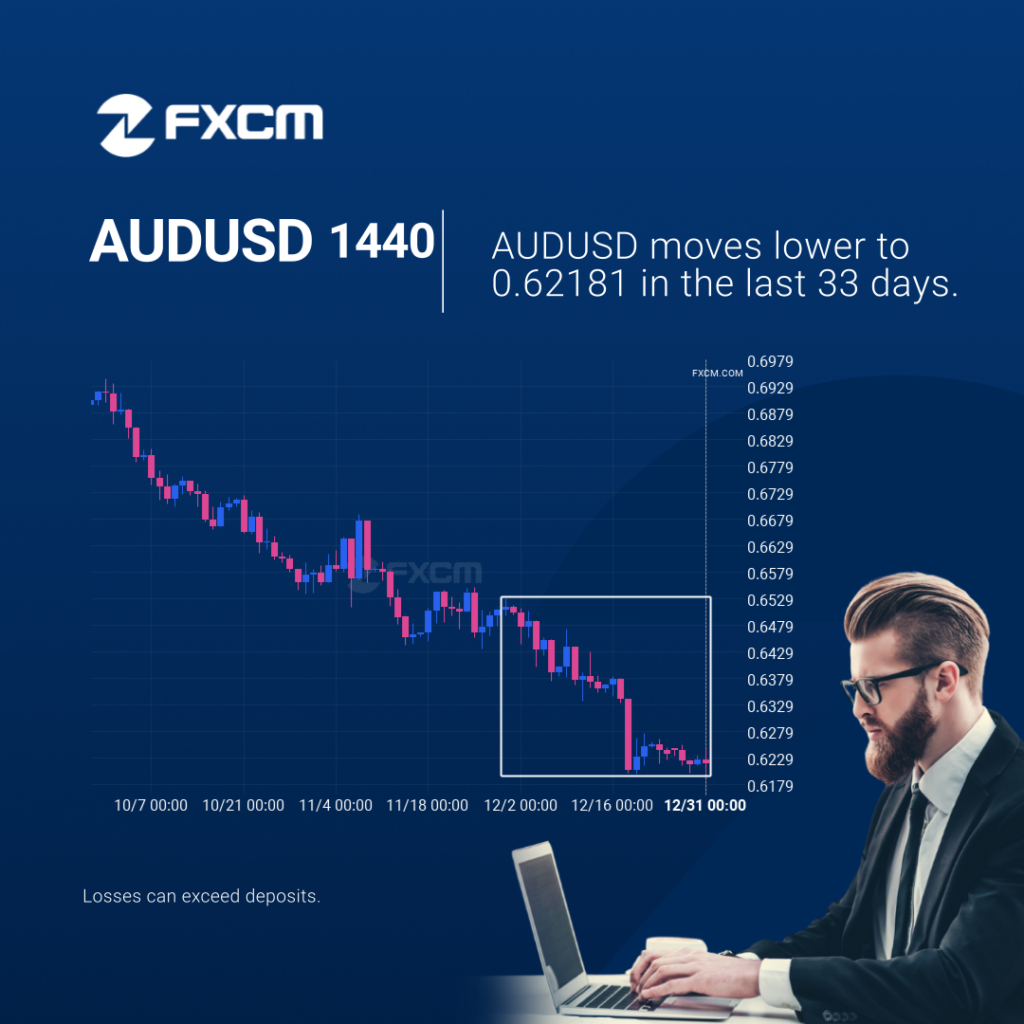
Those of you that are trend followers are probably eagerly watching AUDUSD to see if its latest 4.51% move continues. If not, the mean-reversion people out there will be delighted with this exceptionally large 33 days move. Past performance is not an indicator of future results. Losses can exceed deposits.
USDCAD breakout through support
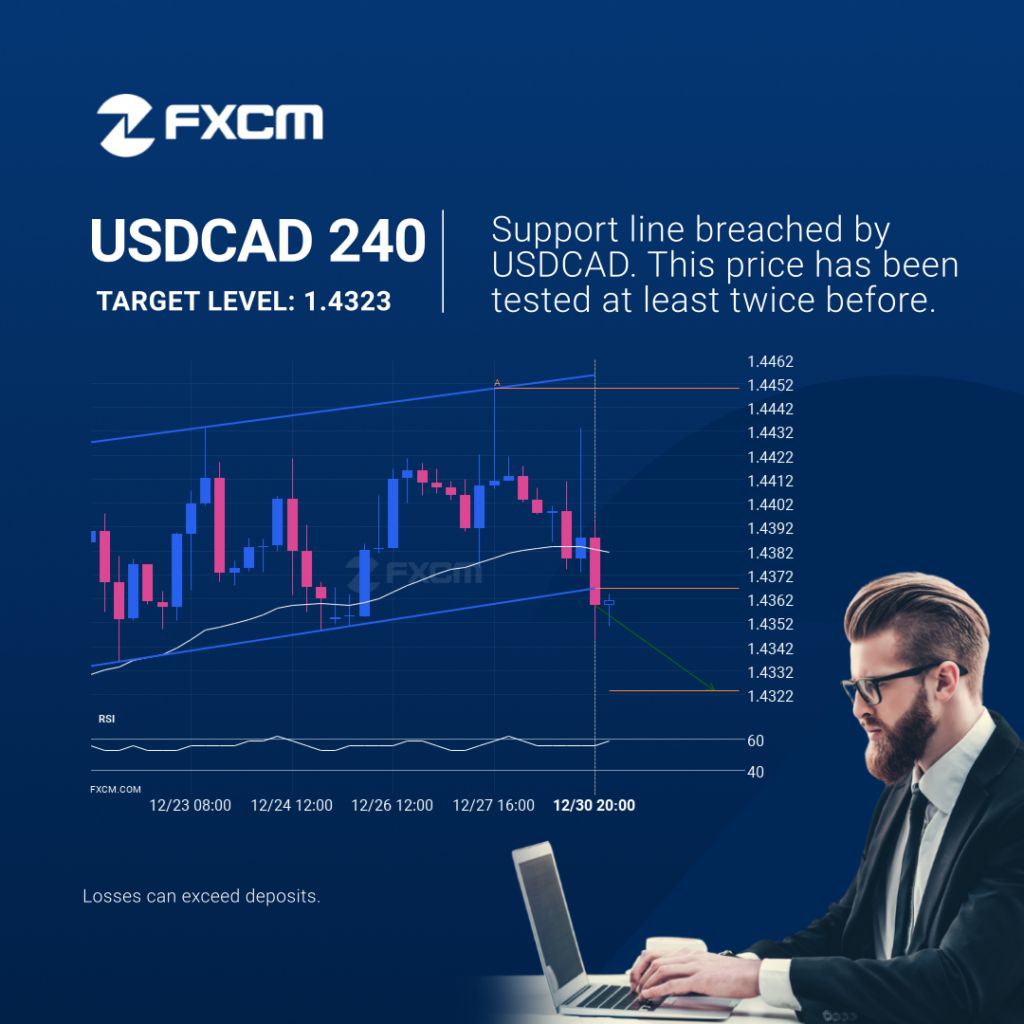
Channel Up pattern identified on USDCAD has broken through a support level with the price momentum continuing to move in an downward direction. A solid trading opportunity continues with the price expected to reach 1.4323 in the next 2. Past performance is not an indicator of future results. Losses can exceed deposits.
EURGBP – Continuation Chart Pattern – Rectangle

EURGBP is trapped in a Rectangle formation, implying that a breakout is Imminent. This is a great trade-setup for both trend and swing traders. It is now approaching a resistance line that has been tested in the past. Divergence opportunists may be very optimistic about a possible breakout and this may be the start of […]